Astragalus mulfordiae - Institute for Applied Ecology
Astragalus mulfordiae - Institute for Applied Ecology
Astragalus mulfordiae - Institute for Applied Ecology

You also want an ePaper? Increase the reach of your titles
YUMPU automatically turns print PDFs into web optimized ePapers that Google loves.
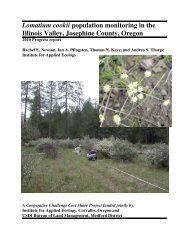
<strong>Astragalus</strong> <strong>mul<strong>for</strong>diae</strong>: Population dynamics and the effect of<br />
cattle grazing in the Vale District, BLM<br />
2009 Progress Report<br />
Robert T. Massatti and Andrea S. Thorpe<br />
<strong>Institute</strong> <strong>for</strong> <strong>Applied</strong> <strong>Ecology</strong><br />
A Challenge Cost Share project funded jointly by<br />
Bureau of Land Management, Vale District and<br />
<strong>Institute</strong> <strong>for</strong> <strong>Applied</strong> <strong>Ecology</strong>
PREFACE<br />
This report is the result of a cooperative Challenge Cost Share project between the<br />
<strong>Institute</strong> <strong>for</strong> <strong>Applied</strong> <strong>Ecology</strong> (IAE) and the USDI Bureau of Land Management. IAE is<br />
a non-profit organization dedicated to natural resource conservation, research, and<br />
education. Our aim is to provide a service to public and private agencies and individuals<br />
by developing and communicating in<strong>for</strong>mation on ecosystems, species, and effective<br />
management strategies and by conducting research, monitoring, and experiments. IAE<br />
offers educational opportunities through internships. Our current activities are<br />
concentrated on rare and endangered plants and invasive species.<br />
Questions regarding this report or IAE should be directed to:<br />
Andrea S. Thorpe, Conservation Research Program Director<br />
<strong>Institute</strong> <strong>for</strong> <strong>Applied</strong> <strong>Ecology</strong><br />
PO Box 2855<br />
Corvallis, Oregon 97339-2855<br />
phone: 541-753-3099, ext. 401<br />
fax: 541-753-3098<br />
email: andrea@appliedeco.org<br />
ACKNOWLEDGEMENTS<br />
The authors gratefully acknowledge the contributions and cooperation by the Vale<br />
District Bureau of Land Management, particularly Gillian Wigglesworth and Jean<br />
Findley. Support was also provided by IAE staff and interns: Matthew Barmann, Alexis<br />
Brickner, Denise Giles, John Grotefend, Monique Leslie, Elizabeth Mathiot, and Shell<br />
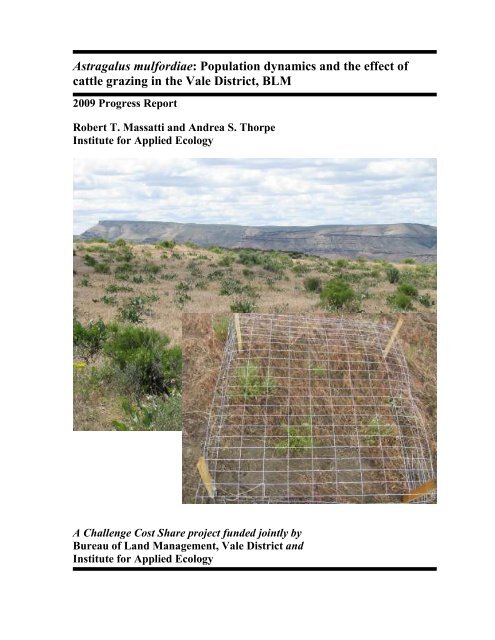
Whittington. Cover photograph: <strong>Astragalus</strong> <strong>mul<strong>for</strong>diae</strong> habitat and a caged plot<br />
including A. <strong>mul<strong>for</strong>diae</strong> and Bromus tectorum. Photos by A.S. Thorpe.<br />
Please cite this report as:<br />
Massatti, R.T. and A.S. Thorpe. 2009. <strong>Astragalus</strong> <strong>mul<strong>for</strong>diae</strong>: Population dynamics and<br />
the effect of cattle grazing in the Vale District, BLM. <strong>Institute</strong> <strong>for</strong> <strong>Applied</strong><br />
<strong>Ecology</strong>, Corvallis, Oregon and USDI Bureau of Land Management, Vale<br />
District. iv + 33 pp.<br />
<strong>Astragalus</strong> <strong>mul<strong>for</strong>diae</strong>: population monitoring and herbivore effects, 2009 ii
TABLE OF CONTENTS<br />
Preface.................................................................................................................................ii<br />
Acknowledgements .............................................................................................................ii<br />
Table of contents ................................................................................................................iii<br />
List of figures .....................................................................................................................iv<br />
List of tables.......................................................................................................................iv<br />
Introduction ......................................................................................................................... 1<br />
Methods............................................................................................................................... 2<br />
Field sites......................................................................................................................... 2<br />
Plant enclosures............................................................................................................... 3<br />
Population and community monitoring........................................................................... 3<br />
Data analysis ................................................................................................................... 5<br />
Results and Discussion........................................................................................................ 6<br />
<strong>Astragalus</strong> <strong>mul<strong>for</strong>diae</strong> enclosures ................................................................................... 6<br />
Population and community monitoring........................................................................... 7<br />
Conclusions ......................................................................................................................... 9<br />
Literature cited .................................................................................................................. 14<br />
Appendix A. Datasheet <strong>for</strong> <strong>Astragalus</strong> <strong>mul<strong>for</strong>diae</strong> monitoring ....................................... 15<br />
Appendix B. <strong>Astragalus</strong> <strong>mul<strong>for</strong>diae</strong> site maps ................................................................ 16<br />
Appendix C. <strong>Astragalus</strong> <strong>mul<strong>for</strong>diae</strong> contacts, gear list, and directions ........................... 29<br />
Appendix D. Summary of <strong>Astragalus</strong> <strong>mul<strong>for</strong>diae</strong> data from caged/uncaged plots ......... 32<br />
<strong>Astragalus</strong> <strong>mul<strong>for</strong>diae</strong>: population monitoring and herbivore effects, 2009 iii
LIST OF FIGURES<br />
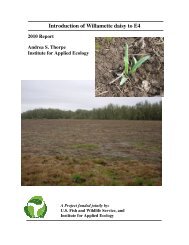
Figure 1. Mul<strong>for</strong>d’s milkvetch (<strong>Astragalus</strong> <strong>mul<strong>for</strong>diae</strong>).<br />
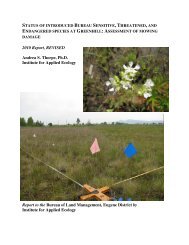
Figure 2. <strong>Astragalus</strong> <strong>mul<strong>for</strong>diae</strong> control (uncaged) monitoring plot.<br />
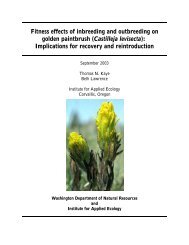
Figure 3. Sampling transect at South Alkali.<br />
Figure 4. Position of the quadrat and cells relative to the transect tape.<br />
Figure 5. Percent change of diameter of <strong>Astragalus</strong> <strong>mul<strong>for</strong>diae</strong> from 2008 to 2009.<br />
Figure 6. Percent change of inflorescences per reproductive plant on A. <strong>mul<strong>for</strong>diae</strong> from<br />
2008 to 2009.<br />
LIST OF TABLES<br />
Table 1. Locations of experimental plots and site history characteristics.<br />
Table 2. Cover classes used when monitoring plant species, ground cover, and surface<br />
disturbances in A. <strong>mul<strong>for</strong>diae</strong> plots.<br />
Table 3. Number and class of <strong>Astragalus</strong> <strong>mul<strong>for</strong>diae</strong> found at each transect.<br />
Table 4. Average percent cover of all vascular plant species and ground cover categories<br />
recorded at the five transects sampled in 2009.<br />
Table 5. Average percent cover of ground disturbances recorded at the five transects<br />
sampled in 2009.<br />
<strong>Astragalus</strong> <strong>mul<strong>for</strong>diae</strong>: population monitoring and herbivore effects, 2009 iv
INTRODUCTION<br />
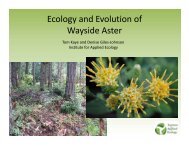
<strong>Astragalus</strong> <strong>mul<strong>for</strong>diae</strong> (Fabaceae,<br />
Mul<strong>for</strong>d’s milkvetch; Figure 1) is<br />
listed as a Sensitive Plant Species by<br />
the USDI Bureau of Land<br />
Management, a Species of Concern by<br />
the United States Fish and Wildlife<br />
Service, and endangered by the state<br />
of Oregon Department of Agriculture<br />
(ORNHIC 2007). In 1995, there were<br />
34 known A. <strong>mul<strong>for</strong>diae</strong> populations in<br />
Idaho and 38 in Oregon (DeBolt<br />
1995). Oregon Natural Heritage<br />
In<strong>for</strong>mation Center currently notes 29<br />
occurrences scattered over 1191 km 2<br />
in Oregon with a total metapopulation<br />
size of less than 12,000 (ORNHIC<br />
2009).<br />
<strong>Astragalus</strong> <strong>mul<strong>for</strong>diae</strong> is found<br />
from the Owyhee Uplands of Malheur<br />
County, Oregon east to the Owyhee<br />
Front and Boise Foothills of western<br />
Idaho. It primarily occurs in shrubsteppe<br />
and desert shrub communities<br />
Figure 1. Mul<strong>for</strong>d’s milkvetch (<strong>Astragalus</strong><br />
<strong>mul<strong>for</strong>diae</strong>). Photo by A.S. Thorpe.<br />
on sandy substrates derived from lacustrine and alluvial sediments, including old river<br />
deposits, sandy places near rivers, sandy bluffs, and dune-like talus. Primary plant<br />
associates include Hesperostipa comata (needle-and-thread grass), Achnatherum<br />
hymenoides (Indian ricegrass), Chrysothamnus viscidiflorus (yellow rabbitbrush),<br />
Penstemon acuminatus (sharpleaf penstemon), and Poa secunda (Sandberg bluegrass).<br />
<strong>Astragalus</strong> <strong>mul<strong>for</strong>diae</strong> relies on environmental cues in late winter and early spring<br />
to initiate its regrowth and phenological stages (DeBolt 1995). In general, regrowth<br />
begins in early March, followed by flowering in April, May, and sometimes into June.<br />
The pollination mechanism is unknown; flying insects or self-pollination are likely<br />
options (DeBolt 1995). Fruits mature in June and July and plants senesce shortly<br />
thereafter. <strong>Astragalus</strong> <strong>mul<strong>for</strong>diae</strong> reproduces only by seed, which is dispersed by gravity<br />
and wind (DeBolt 1995).<br />
Monitoring studies of A. <strong>mul<strong>for</strong>diae</strong> provide evidence <strong>for</strong> a drastic decline in<br />
population sizes (CPC 2009). Some populations have been extirpated through ORV use,<br />
cattle grazing, and fire. Plants were typically absent after the third year of cattle grazing<br />
(DeBolt 2001). In a study of areas seeded with Agropyron desertorum, fruits per<br />
inflorescence, inflorescences per plant, and adult plant survival were all lower in areas<br />
grazed by cattle (David Pyke, personal communication). However, populations appear to<br />
vary in their ability to withstand disturbances (DeBolt 1995, 2001) and there may be a<br />
genetic difference between populations that are more susceptible or more tolerant of<br />
disturbance (DeBolt 2001).<br />
<strong>Astragalus</strong> <strong>mul<strong>for</strong>diae</strong>: population monitoring and herbivore effects, 2009 1
Competition with exotic plant species, particularly Agropyron desertorum (desert<br />
wheatgrass), Chondrilla juncea (Rush skeletonweed), and Bromus tectorum (cheatgrass),<br />
may also impact populations of A. <strong>mul<strong>for</strong>diae</strong>. Competition with exotic species appears<br />
to be particularly problematic in areas that have recently burned and/or are heavily<br />
grazed.<br />
This project will provide data on the population biology and long-term trends of<br />
A. <strong>mul<strong>for</strong>diae</strong> in the Owyhee Uplands of eastern Oregon. In order to determine the<br />
effects of ungulates on A. <strong>mul<strong>for</strong>diae</strong>, we are using small cages to protect groups of<br />
plants that experience different levels and types of grazing. Data resulting from this<br />
project will provide valuable in<strong>for</strong>mation to assist agencies making listing decisions <strong>for</strong><br />
the species, managing livestock grazing in various allotments, and planning conservation<br />
strategies and recovery plans. More specifically, this study is designed to:<br />
1. Document long-term trends in population size and structure.<br />
2. Determine the role of climatic variation (e.g., annual changes in precipitation) in<br />
observed differences in population size and reproduction.<br />
3. Determine the effect of grazing on population size and reproduction.<br />
4. Compare Oregon population dynamics with Idaho population dynamics.<br />
METHODS<br />
Field sites<br />
All sites are located near Vale, Oregon in the Vale District, BLM. After initial<br />
site visits in 2007, six A. <strong>mul<strong>for</strong>diae</strong> populations were chosen <strong>for</strong> plot establishment:<br />
Brown Butte, Double Mountain, North Harper North, North Harper South, South Alkali<br />
ACEC, and Snively (Table 1, Appendix B).<br />
Table 1. Locations of plots and site history characteristics.<br />
Site<br />
Location Fire history Grazing # plots<br />
(location of GPS pt) (Nad83, Zone11)<br />
South Alkali #1<br />
(plot 648)<br />
South Alkali #2<br />
(plot 653)<br />
South Alkali #3<br />
(transect start)<br />
Brown Butte<br />
(transect start)<br />
Snively<br />
(transect start)<br />
Double Mountain<br />
(transect start)<br />
North Harper North<br />
(transect start)<br />
North Harper South<br />
(plot 675)<br />
0484252E<br />
4878746N<br />
0486054E<br />
4878989N<br />
0485982E<br />
4877837N<br />
0489997E<br />
4842103N<br />
0484372E<br />
4840786N<br />
0476635E<br />
4853382N<br />
0481055E<br />
4857204N<br />
0481446E<br />
4856682N<br />
unknown fall cattle grazing 3 caged<br />
3 uncaged<br />
unknown fall cattle grazing 3 caged<br />
3 uncaged<br />
unknown fall cattle grazing 4 caged<br />
4 uncaged<br />
Fire: late summer cattle 5 caged<br />
90’s grazing 5 uncaged<br />
unknown not grazed 5 caged<br />
5 uncaged<br />
Fire: 2005 sheep grazed 5 caged<br />
5 uncaged<br />
unknown cattle grazed 5 caged<br />
5 uncaged<br />
unknown cattle grazed 5 caged<br />
5 uncaged<br />
<strong>Astragalus</strong> <strong>mul<strong>for</strong>diae</strong>: population monitoring and herbivore effects, 2009 2
Plant enclosures<br />
In 2008, we established 10 or<br />
20 plots at each study site to determine<br />
the effects of ungulates (primarily<br />
sheep and cattle) on A. <strong>mul<strong>for</strong>diae</strong><br />
(Table 1). Plot locations were<br />
systematically selected to maximize<br />
the number of individuals within a 1 m<br />
x 1 m area. Half of the plots were<br />
uncaged (Figure 2), the other half were<br />
caged (cover photo). We did not use a<br />
random sampling design because we<br />
wanted to ensure that there were<br />
enough plants within each plot to<br />
detect differences in growth, survival,<br />
and reproduction; we additionally<br />
wanted the caged and control plots to<br />
be well distributed throughout the<br />
population. All plots were marked in<br />
Figure 2. <strong>Astragalus</strong> <strong>mul<strong>for</strong>diae</strong> control<br />
(uncaged) monitoring plot. The corners<br />
are marked with 10” nails. Photo by A.S.<br />
Thorpe.<br />
each corner with 10 inch steel nails and/or wooden stakes protruding from the soil<br />
surface. The plots were aligned with the cardinal directions; an aluminum tag noting the<br />
plot number was tied with wire around the plot marker in the southeast corner of each<br />
plot.<br />
Caged plots allowed us to measure the approximate effects of grazing and<br />
trampling by sheep and cattle on A. <strong>mul<strong>for</strong>diae</strong> when collected data was compared to data<br />
from uncaged plots. The cage design also inhibited native ungulate grazing and<br />
trampling, but small mammals and birds could still access the space within the cages.<br />
Although we did not pair uncaged and caged plots, we attempted to locate one of each<br />
type within close proximity to control <strong>for</strong> the effects of microclimate and<br />
microtopography. Each caged plot was covered on the top and sides with hogwire. The<br />
cages stood approximately 0.3 m high and were slightly larger than 1 m 2 . They were held<br />
in place with wire tied to wooden stakes sunk into the corners of the plots.<br />
We divided each plots into four 0.5 m x 0.5 m subplots using a divided quadrat<br />
frame (Figure 2). Within each subplot, we mapped all A. <strong>mul<strong>for</strong>diae</strong> individuals using a<br />
grid system so that recruitment, mortality, and overall trends in the plants’ growth can be<br />
ascertained over time (Appendix A). We also measured the maximum diameter (cm),<br />
length of longest stem (cm), number of inflorescences, and evidence of insect and large<br />
ungulate grazing (yes/no) of every plant. Similar methods have been used to monitor the<br />
population dynamics of A. tyghensis in the Tygh Valley (Prineville District, BLM;<br />
Thorpe and Kaye 2008).<br />
Population and community monitoring<br />
This monitoring protocol follows the methods used by the Idaho Conservation<br />
Data Center to monitor populations of A. <strong>mul<strong>for</strong>diae</strong> in southwestern Idaho (Mancuso<br />
2001, Mancuso and Colket 2005, ICDC 2008). The monitoring protocol details<br />
<strong>Astragalus</strong> <strong>mul<strong>for</strong>diae</strong>: population monitoring and herbivore effects, 2009 3
procedures to collect A. <strong>mul<strong>for</strong>diae</strong><br />
and other plant species abundance,<br />
ground disturbance data, plant<br />
community in<strong>for</strong>mation, and photo<br />
points.<br />
Five monitoring transects<br />
were established in 2009. Each<br />
transect was 20 meters long and<br />
monumented with a piece of redpainted<br />
rebar at the starting point and<br />
a large metal spike at the ending<br />
point. Sampling occurred along a<br />
meter tape running between the rebar<br />
and spike (Figure 3). A 1 m<br />
Figure 3. Sampling transect at South Alkali.<br />
2 quadrat<br />
frame was placed flush against the<br />
tape beginning at the 0 m mark.<br />
Sampling occurred at each consecutive meter mark along the transect tape. We<br />
documented the GPS coordinates of the starting and ending point, azimuth, and side of<br />
the tape sampled <strong>for</strong> each transect (Table 3). We also completed a transect in<strong>for</strong>mation<br />
<strong>for</strong>m that included in<strong>for</strong>mation to help relocate the transects.<br />
Each A. <strong>mul<strong>for</strong>diae</strong> individual rooted within the quadrat was counted and assigned<br />
to one of 3 life stage class categories:<br />
• Reproductive class (R) - individuals with flowers and/or fruits<br />
• Non-reproductive class (N) - individuals >4 cm tall without flowers or fruits<br />
• Seedling class (S) - non-reproductive individuals
Figure 4. Position of the quadrat and cells relative to the transect tape.<br />
The total area occupied by surface disturbances (e.g. OHV tracks, wildlife and<br />
cattle prints, gopher tunnels) within each quadrat was estimated and assigned a cover<br />
class (Table 2). Surface disturbance were additionally broken down by disturbance type;<br />
the cover class represented the percentage of ground surface within the quadrat that was<br />
clearly broken, crushed, or sloughed.<br />
We took a minimum of 6 photos at each monitoring site. The origin rebar served<br />
as the reference point <strong>for</strong> four photos, taken at bearings of 0°, 90°, 180°, and 270°; these<br />
provided a panoramic overview of the monitoring area. We took a fifth photo standing 3<br />
m behind the origin rebar looking towards the end spike; a sixth photo was taken standing<br />
3 m behind the end spike looking towards the origin rebar. We took additional photos to<br />
show the plant community, disturbances, and other landscape features as needed.<br />
Data analysis<br />
Population and community monitoring data were summarized descriptively. All<br />
data given cover classes were converted to midpoint percent cover values (Table 2). The<br />
effect of the hogwire cages on plant per<strong>for</strong>mance was tested using a General Linear<br />
Model with site and treatment as fixed factors, 2009 plant diameter or mean<br />
inflorescences per reproductive plant as the dependent variables, and the 2008 data of the<br />
same categories as covariates (SPSS 17.0 2009). Plots 661 at South Alkali (uncaged),<br />
668 at North Harper South (uncaged), and 685 at Double Mountain (caged) were either<br />
damaged or not relocated, and their corresponding 2008 data were not included in<br />
statistical analyses.<br />
<strong>Astragalus</strong> <strong>mul<strong>for</strong>diae</strong>: population monitoring and herbivore effects, 2009 5
Table 2. Cover classes used when monitoring plant species, ground cover, and surface<br />
disturbances in A. <strong>mul<strong>for</strong>diae</strong> plots.<br />
Cover class Percent cover range (%) Midpoint to convert to (%)<br />
0 0 0.0<br />
1
9 (16%) at Double Mountain, and 1 at each of Brown Butte and North Harper South.<br />
Many of the missing plants at Snively were associated with plots in which significant<br />
sheet erosion was noted. The cause of the erosion was unclear, but it might have been<br />
caused by ground disturbances in the surrounding microtopography. Additional missing<br />
plants at Snively were located in a plot where an ant hill was noted. At South Alkali, the<br />
dead plants were scattered throughout plots, except <strong>for</strong> one plot in which all six plants<br />
were dry and brown. The cause of this mortality is unclear, but South Alkali had the<br />
highest percent ground disturbance by cattle prints (6.1%) and total disturbance (5.9%) of<br />
all the sampling sites. Finally, plant mortality at Double Mountain seemed to be related<br />
to burial by wind-blown sand. Plants affected by the accumulation of sand deposits were<br />
much smaller on average compared to surviving plants at Double Mountain and the<br />
plants at all of the sites combined.<br />
Table 3. Number and class of <strong>Astragalus</strong> <strong>mul<strong>for</strong>diae</strong> found at each transect. All azimuth<br />
compass bearings include a 15º east declination.<br />
Area Transect<br />
azimuth/side<br />
of tape<br />
monitored<br />
# of<br />
quadrats Reproductive<br />
Nonreproductive<br />
Seedling TOTAL<br />
Brown Butte 198 182º/east 20 13 0 3 16<br />
Double Mountain 196 2º/east 20 3 0 0 3<br />
North Harper North 200 354º/west 20 22 4 11 37<br />
Snively 199 281º/south 20 21 1 3 25<br />
South Alkali 197 24º/west 20 40 10 1 51<br />
TOTAL: 100 99 15 18 132<br />
Population and community monitoring<br />
In 2009, a total of 132 A. <strong>mul<strong>for</strong>diae</strong> plants with a mean density of 1.3 plants/m 2<br />
were observed within quadrats along five transects (Table 3). Reproductive plants<br />
accounted <strong>for</strong> 75% of the total observed; the remaining 25% was divided between nonreproductive<br />
plants (>4 cm tall, 11.4%) and seedlings (
*<br />
650<br />
caged<br />
uncaged<br />
caged<br />
uncaged<br />
120<br />
550<br />
100<br />
450<br />
80<br />
350<br />
60<br />
250<br />
% change<br />
40<br />
% change<br />
150<br />
20<br />
50<br />
0<br />
-50<br />
Snively South Alkali<br />
North<br />
Harper<br />
South<br />
North<br />
Harper<br />
North<br />
Brown Butte Double<br />
Mountain<br />
Snively South Alkali<br />
North<br />
Harper<br />
South<br />
North<br />
Harper<br />
North<br />
Brown Butte Double<br />
Mountain<br />
-20<br />
-150<br />
Figure 6. Percent change of inflorescences per reproductive plant on A.<br />
<strong>mul<strong>for</strong>diae</strong> from 2008 to 2009. The Double Mountain caged treatment<br />
(starred) percent change is 1034%; this result is driven by one plot in<br />
which there were no inflorescences in 2008 and 43 in 2009. Excluding<br />
this plot, the overall caged trend is similar to that of the uncaged plots<br />
(slightly negative). There was no direct effect of caging on the number of<br />
inflorescences per reproductive plant (p=0.6), but there was a significant<br />
interaction between site and treatment (p=0.04). Error bars are ±1 SE.<br />
Figure 5. Percent change of diameter of <strong>Astragalus</strong> <strong>mul<strong>for</strong>diae</strong> from<br />
2008 to 2009. There was no significant effect of caging on diameter<br />
(p=0.3). Note that the average diameter increased regardless of site or<br />
treatment. Error bars are ±1 SE.<br />
<strong>Astragalus</strong> <strong>mul<strong>for</strong>diae</strong>: population monitoring and herbivore effects, 2009 8
The loose, sandy substrate characterizing A. <strong>mul<strong>for</strong>diae</strong> habitat readily leaves<br />
evidence of physical disturbances. Disturbances recorded in 2009 fell into the following<br />
categories: anthill, bird feces, burrow, cattle feces (>6 month old), cattle prints, deer<br />
feces, deer prints, divot, elk feces, game trails, human footprints (non-researcher), human<br />
footprints (researcher), insect burrow, lizard prints, medium sized rodents, rabbit feces,<br />
rills, shotgun shells/human trash, and unknown animal prints (Table 5). When the cause<br />
of the disturbance was not evident, “divot” was recorded. Among all sites, the average<br />
ground disturbance in all categories totaled 4.2%. Individual categories with the highest<br />
average covers included researcher footprints (2.8%), cattle prints (2.6%), cattle feces<br />
older than 6 months (1.7%), anthills (1.6%), divots (1.5%), and game trails (1.5%).<br />
Insect damage, herbivory, and trampling damage to A. <strong>mul<strong>for</strong>diae</strong> occurred on 31<br />
plants (23%). Five plants were noted as having insect damage and disease. These<br />
occurrences were spread between Snively, Brown Butte, and North Harper North. At the<br />
latter transect, the damaged individual was noted to have “mottled stems.” Although<br />
herbivory and trampling were present at four of five sites (none was recorded at North<br />
Harper North), 19 out of 26 noted occurrences were recorded at South Alkali. South<br />
Alkali had the highest percent cover of cattle prints (6.1%) and total ground disturbance<br />
(5.9%). Five of the remaining six occurrences were recorded at Brown Butte, where the<br />
highest cover of game trails (7.5%) and deer prints (4.0%) were recorded. Cattle use<br />
(prints or feces) was recorded at every site in 2009.<br />
Thirty-four species were recorded in the five transects in 2009 (Table 4). Species<br />
present in at least four transects included (with average percent cover): <strong>Astragalus</strong><br />
<strong>mul<strong>for</strong>diae</strong> (5.2%), Balsamorhiza sagittata (4.5%), Penstemon acuminatus (3%),<br />
Phacelia linearis (0.5%), Achnatherum hymenoides (4.5%), Elymus elymoides ssp.<br />
elymoides (3.5%), Poa secunda (3.1%), Chrysothamnus viscidiflorus (10.7%), Bromus<br />
tectorum (10.7%), Salsola tragus (1.9%), and cf. Sisymbrium altissimum (>0.4%). Other<br />
locally important species with at least 5% cover included: Opuntia polyacantha,<br />
Linanthus pungens, Hesperostipa comata ssp. comata, Atriplex sp, and Poa bulbosa. The<br />
plant community can be best described as an open shrubland with scattered graminoids<br />
and <strong>for</strong>bs. While most of the non-native taxa were annuals, all native species were<br />
perennials except <strong>for</strong> Phacelia linearis and Cryptantha sp. The non-vegetated ground<br />
surface was dominated by bare ground (average 58% cover) and litter (23.1% cover);<br />
small amounts (
There was little evidence that grazing by cattle and/or sheep directly affected<br />
<strong>Astragalus</strong> <strong>mul<strong>for</strong>diae</strong> population size and reproductive success. Few plants were<br />
definitely grazed by cattle; those that were grazed were extensively damaged. Cattle and<br />
sheep may affect A. <strong>mul<strong>for</strong>diae</strong> populations indirectly by disturbing the ground surface<br />
either in or adjacent to plots. The loose, sandy, and exposed nature of the soil means that<br />
ground disturbance can propagate disturbance to adjacent areas. Cattle and human prints<br />
could alter surface hydrology and potentially cause some of the erosion events that led to<br />
plant mortality in plots at South Alkali and Snively. Inversely, ground disturbance at<br />
Double Mountain may have facilitated sediment deposition into plots. Limiting ground<br />
disturbance through larger fencing plots (see Massatti et al. 2009) would be one way test<br />
this hypothesis.<br />
Invasive species were ubiquitous in A. <strong>mul<strong>for</strong>diae</strong> sampling plots. Bromus<br />
tectorum was abundant at every site and other invasive species were locally important.<br />
These species appeared to be more abundant in areas with higher disturbance by grazing.<br />
Continued population community monitoring will determine if invasive species are<br />
becoming more abundant and what impact they are having on A. <strong>mul<strong>for</strong>diae</strong> populations.<br />
Comparison of Oregon and Idaho A. <strong>mul<strong>for</strong>diae</strong> population dynamics should<br />
commence cautiously and only on a same-year basis; Idaho Conservation Data Center<br />
(ICDC) data show A. <strong>mul<strong>for</strong>diae</strong> population densities can fluctuate from year-to-year. In<br />
2009, we established and monitored population transects in Oregon using the same<br />
protocol as the ICDC (2008), which will facilitate future region-wide population<br />
comparisons.<br />
Lomatium cookii population monitoring progress report, 2009 10
Table 4. Average percent cover of all vascular plant species and ground cover categories recorded at the<br />
five transects sampled in 2009. Plants are organized by native status and growth habit, with the ground<br />
cover categories occurring at the end of the list. Abbreviations include: “N” = native, “I” = invasive, “F”<br />
= <strong>for</strong>b, “G” = graminoid, “S” = shrub, “P” = perennial, and “A” = annual/biennial. Continued on next<br />
page.<br />
Species<br />
Common<br />
Name<br />
Native<br />
Status<br />
Growth<br />
Habit<br />
Life<br />
<strong>for</strong>m North<br />
Harper<br />
North<br />
Double<br />
Mtn<br />
Average % cover<br />
South<br />
Alkali<br />
Brown<br />
Butte<br />
Lomatium cookii population monitoring progress report, 2009 11<br />
Snively Mean<br />
<strong>Astragalus</strong><br />
<strong>mul<strong>for</strong>diae</strong><br />
Mul<strong>for</strong>d's<br />
milkvetch<br />
N F P 5.0 4.0 6.2 4.4 6.2 5.2<br />
Balsamorhiza<br />
sagittata<br />
arrowleaf<br />
balsamroot<br />
N F P 8.5 4.5 4.5 0 5.2 4.5<br />
Penstemon<br />
acuminatus<br />
sharpleaf<br />
penstemon<br />
N F P 2.5 0.5 5.2 0 6.8 3.0<br />
Opuntia<br />
polyacantha<br />
plains<br />
pricklypear<br />
N F P 7.5 0 0 0 0 1.5<br />
Linanthus pungens<br />
granite<br />
prickly phlox<br />
N F P 6.1 0 0 0 0.5 1.3<br />
Crepis acuminata<br />
tapertip<br />
hawksbeard<br />
N F P 3.3 0 2.8 0 0 1.2<br />
Comandra<br />
umbellata<br />
bastard<br />
toadflax<br />
N F P 0 0 0 4.0 0 0.8<br />
Phacelia sp. phacelia N F P 4.0 0 0 0 0 0.8<br />
Phacelia linearis<br />
threadleaf<br />
phacelia<br />
N F A 0.5 0 0.5 0.5 0.5 0.4<br />
Leucocrinum<br />
montanum<br />
common<br />
starlily<br />
N F P 0.5 0 0 0 0.5 0.2<br />
Cryptantha sp. cryptantha N F A 0 0 0 0.5 0 0.1<br />
Oenothera pallida<br />
pale eveningprimrose<br />
N F P 0 0.5 0 0 0 0.1<br />
Sphaeralcea<br />
grossulariifolia<br />
globemallow N F P 0 0 0 0.5 0 0.1<br />
Achnatherum<br />
hymenoides<br />
Indian<br />
ricegrass<br />
N G P 1.7 12.3 0 2.8 5.8 4.5<br />
Elymus elymoides<br />
ssp. elymoides<br />
squirreltail N G P 5.2 3.3 4.7 0 4.3 3.5<br />
Hesperostipa<br />
comata ssp. comata<br />
needle and<br />
thread<br />
N G P 8.2 0 0 4.0 5.3 3.5<br />
Poa secunda<br />
Sandberg<br />
bluegrass<br />
N G P 5.0 0 4.8 2.8 2.8 3.1<br />
Elymus sp. wildrye N G P 0 1.6 0 0 0 0.3
Table 4 cont. Average percent cover of all vascular plant species and ground cover categories recorded<br />
at the five transects sampled in 2009. Plants are organized by native status and growth habit, with the<br />
ground cover categories occurring at the end of the list. Abbreviations include: “N” = native, “I” =<br />
invasive, “F” = <strong>for</strong>b, “G” = graminoid, “S” = shrub, “P” = perennial, and “A” = annual/biennial.<br />
Species<br />
Common<br />
Name<br />
Native<br />
Status<br />
Growth<br />
Habit<br />
Life<br />
<strong>for</strong>m North<br />
Harper<br />
North<br />
Double<br />
Mtn<br />
Average % cover<br />
South<br />
Alkali<br />
Brown<br />
Butte<br />
Lomatium cookii population monitoring progress report, 2009 12<br />
Snively Mean<br />
Danthonia sp. oatgrass N G P 0 0 0 0 0.5 0.1<br />
Chrysothamnus<br />
viscidiflorus<br />
yellow<br />
rabbitbrush<br />
N S P 11.5 12.1 7.9 13.2 8.8 10.7<br />
Atriplex sp. saltbush N S P 0 0 0 12.5 22.5 7.0<br />
Purshia tridentata<br />
antelope<br />
bitterbrush<br />
N S P 0 0 0 0.5 0 0.1<br />
Salsola tragus<br />
DEAD<br />
prickly<br />
Russian thistle<br />
I F A 7.5 1.0 0 0.5 0.5 1.9<br />
Sisymbrium<br />
altissimum<br />
LIVE + DEAD<br />
tall<br />
tumblemustard<br />
I F A 0 0.5 7.5 0.5 0 1.7<br />
Erodium cicutarium<br />
redstem stork's<br />
bill<br />
I F A 0 0 0 4.6 0 0.9<br />
Alyssum desertorum<br />
desert<br />
madwort<br />
I F A 0 0 0.5 0 0 0.1<br />
Tragopogon dubius yellow salsify I F A 0.5 0 0 0 0 0.1<br />
Bromus tectorum cheatgrass I G A 8.0 2.4 22.5 8.8 12.0 10.7<br />
Poa bulbosa<br />
bulbous<br />
bluegrass<br />
I G P 0 0 0 0 7.5 1.5<br />
Vulpia sp. annual fescue I G A 0.5 0 0.5 0 0.5 0.3<br />
cf. Sisymbrium<br />
altissimum<br />
I F A 0.5 0 0.5 0.5 0.5 0.4<br />
Unknown <strong>for</strong>b F 0 0 0.5 0.5 7.5 1.7<br />
Unknown <strong>for</strong>b<br />
(purple culm)<br />
F 0 0 0 0.5 0.5 0.2<br />
Asteraceae F 0 0 0.5 0 0 0.1<br />
Basal veg<br />
(cut off at ground)<br />
0.7 0 0.1 0.1 0.5 0.3<br />
Bare ground 58.6 79.4 41.0 59.6 51.4 58.0<br />
Biological crust 0 0 0 0 0 0<br />
Rock/gravel (≥2mm) 0 2.5 1.2 2.4 6.1 2.4<br />
Litter (
Table 5. Average percent cover of ground disturbances recorded at the five transects<br />
sampled in 2009. The total ground disturbance was collected in the field and is not a<br />
sum of all listed disturbances.<br />
Disturbance Category<br />
North<br />
Harper<br />
North<br />
Double<br />
Mtn<br />
Average % Cover<br />
South<br />
Alkali<br />
Brown<br />
Butte<br />
Snively Mean<br />
anthill 0 0 7.5 0.5 0 1.6<br />
bird feces (other) 0 0 0.5 0.5 0 0.2<br />
burrow 0 0 0 3.0 0 0.6<br />
cattle feces-older (>0.5 yr) 3.0 1.8 1.1 2.4 0 1.7<br />
cattle prints 3.0 0 6.1 1.1 3.0 2.6<br />
deer feces 1.3 0 0.5 0.5 0 0.5<br />
deer prints 1.8 0 0 4.0 0 1.2<br />
divot 3.0 0.5 0.5 2.4 1.3 1.5<br />
elk feces 0 0.5 0 0 0 0.1<br />
game trails 0 0 0 7.5 0 1.5<br />
human footprints (NOT researcher) 3.0 0 0 0 0.5 0.7<br />
human footprints (researcher) 2.2 4.8 2.2 2.0 2.9 2.8<br />
insect burrow (diameter < 0.5 cm) 0.5 0.5 0.5 0.5 0.5 0.5<br />
lizard prints 0 1.0 0 0 0 0.2<br />
medium sized rodents (pocket gopher,<br />
kangaroo rat, ground squirrel)<br />
0 0 0.5 0 0 0.1<br />
rabbit feces 0 0.5 0 0 0 0.1<br />
rills (erosion) 0 0.5 0 0 0 0.1<br />
shotgun shell(s), human trash 0 0 0.5 0 0.5 0.2<br />
unknown animal prints 0 1.3 0 0 0 0.3<br />
Total ground disturbance 3.8 3.5 5.9 3.6 4.1 4.2<br />
Lomatium cookii population monitoring progress report, 2009 13
LITERATURE CITED<br />
Center <strong>for</strong> Plant Conservation. 2009. CPC national collection plant profile: Mul<strong>for</strong>d’s<br />
milkvetch. http://www.center<strong>for</strong>plantconservation.org/. Accessed: 03/18/2009.<br />
DeBolt, A. 1995. Habitat Conservation Assessment <strong>for</strong> Mul<strong>for</strong>d's Milkvetch (<strong>Astragalus</strong><br />
<strong>mul<strong>for</strong>diae</strong>). Unpublished report. Bureau of Land Management.<br />
DeBolt, A. 2001. E-mail communication. 12/5/01. In BBG files. in Center <strong>for</strong> Plant<br />
Conservation 2008. CPC national collection plant profile: Mul<strong>for</strong>d’s milkvetch.<br />
http://www.center<strong>for</strong>plantconservation.org/. Accessed: 03/18/2009.<br />
Idaho Conservation Data Center (ICDC). 2008. Mul<strong>for</strong>d’s milkvetch (<strong>Astragalus</strong><br />
<strong>mul<strong>for</strong>diae</strong>) monitoring in southwestern Idaho: 2007 results. Idaho Department<br />
of Fish and Game, Boise, Id. 40pp. plus appendices.<br />
Mancuso, M. 2001. Monitoring Mul<strong>for</strong>d’s milkvetch (<strong>Astragalus</strong> <strong>mul<strong>for</strong>diae</strong>) in the<br />
Boise Foothills: 2000 results. Idaho Department of Fish and Game, Idaho<br />
Conservation Data Center, Boise, ID. 12 pp. plus appendices.<br />
Mancuso, M., and B. C. Colket. 2005. Monitoring Mul<strong>for</strong>d’s milkvetch (<strong>Astragalus</strong><br />
<strong>mul<strong>for</strong>diae</strong>) on the Owyhee Front: 2004 results. Idaho Department of Fish and<br />
Game, Idaho Conservation Data Center, Boise, Id. 15 pp. plus appendices.<br />
Massatti, R.T., A.S. Thorpe, and T.N. Kaye. 2009. Lupinus lepidus var. cusickii<br />
population monitoring in Denny Flat, Baker County, Oregon. <strong>Institute</strong> <strong>for</strong><br />
<strong>Applied</strong> <strong>Ecology</strong>, Corvallis, Oregon and USDI Bureau of Land Management,<br />
Vale District. iv + 16 pp.<br />
Oregon Natural Heritage In<strong>for</strong>mation Center. 2007. Rare, Threatened and Endangered<br />
Species of Oregon. Oregon Natural Heritage In<strong>for</strong>mation Center, Oregon State<br />
University, Portland, Oregon. 100 pp.<br />
Oregon Natural Heritage In<strong>for</strong>mation Center. 2009. Oregon Threatened and Endangered<br />
Plant Field Guide. http://oregonstate.edu/ornhic/plants/view_plants2.php.<br />
Accessed: 03/18/2009.<br />
Thorpe, A.S., and T.N. Kaye. 2008. <strong>Astragalus</strong> tyghensis population trends: Actual vs.<br />
predicted population sizes. Final Report. Prepared by the <strong>Institute</strong> <strong>for</strong> <strong>Applied</strong><br />
<strong>Ecology</strong> <strong>for</strong> the USDI Bureau of Land Management, Prineville District.<br />
Corvallis, Oregon. iii + 14.<br />
USDA, NRCS. 2010. The PLANTS Database (http://plants.usda.gov, 25 January 2010).<br />
National Plant Data Center, Baton Rouge, LA 70874-4490 USA.<br />
Lomatium cookii population monitoring progress report, 2009 14
APPENDIX A. DATASHEET FOR ASTRAGALUS MULFORDIAE MONITORING<br />
<strong>Astragalus</strong> <strong>mul<strong>for</strong>diae</strong> demographic monitoring plot<br />
Site:<br />
Plot #: Caged or Uncaged<br />
Date:<br />
Names:<br />
Note location of rebar posts and compass bearing to top of page<br />
Compass bearing:<br />
Plant #<br />
Xcoord <br />
Ycoord<br />
Diam<br />
(cm)<br />
longest<br />
stem<br />
(cm) #Infl. Insect<br />
Herbivory<br />
Deer /<br />
Cattle Notes<br />
Lomatium cookii population monitoring progress report, 2009 15
APPENDIX B. ASTRAGALUS MULFORDIAE SITE MAPS<br />
Owyhee Lake Rd.<br />
Owyhee Ave.<br />
Driving route to Snively from State Route 201. Written driving directions can be<br />
found in Appendix C.<br />
Lomatium cookii population monitoring progress report, 2009 16
South Alkali field site. Blue polygons represent known populations of A. <strong>mul<strong>for</strong>diae</strong>.<br />
11T 0485982E 4877837N (start of transect at population 3, Nad83)<br />
Close-up of the plot layout at Snively. Park at the river turnoff across the road.<br />
Several undeveloped campsites can be found along the river. Note scale bar at lower<br />
left corner of the photo (163 ft).<br />
11T 0484372E 4840786N (transect start point, Nad83), GPS accuracy ±25 ft.<br />
Lomatium cookii population monitoring progress report, 2009 17
Vale View Rd.<br />
Lagoon Dr.<br />
Foothill Dr.<br />
Driving route to South Alkali 1, 2, and 3. From Jordan Waterhole, it is advisable to<br />
drive clockwise around the loop, visiting S. Alkali 1 first. The road basically stays on<br />
top of a ridgeline all the way around this valley. Follow the 7.5” USGS topo map and<br />
written driving directions (Appendix C) carefully, especially once you are on Valley<br />
View Road.<br />
Lomatium cookii population monitoring progress report, 2009 18
Close-up of the plot layout at South Alkali 1. Plots 646 – 649 are on the north side of<br />
the dirt access road, and plots 650 and 651 are on the south side of the dirt access road<br />
(road indistinguishable). Note the scale bar at the bottom left of this photo (75 ft).<br />
11T 0484252E 4878746N (Nad83, plot 648), GPS accuracy ±25 ft.<br />
Lomatium cookii population monitoring progress report, 2009 19
Close-up of the plot layout at South Alkali 2. Note the scale bar at the bottom left of<br />
this photo (181 ft). The red line represents an estimate of the dirt access road.<br />
11T 0486054E 4878989N (Nad83, plot 653), GPS accuracy ±25 ft.<br />
Lomatium cookii population monitoring progress report, 2009 20
Close-up of the plot layout at South Alkali 3. The dirt access road is to the east (right).<br />
Note the scale bar at the bottom left corner of the photo (88 ft).<br />
11T 0485982E 4877837N (Nad83, transect start point), GPS accuracy ±25 ft.<br />
Lomatium cookii population monitoring progress report, 2009 21
Driving route to North Harper from Lytle Blvd. Vale is north (up) on Lytle Blvd. If<br />
you drive past the dump, you went too far south on Lytle. Follow the 7.5” USGS topo<br />
quad and written driving directions carefully (Appendix C). An alternative route<br />
through Cow Hollow to North Harper South is marked on the Double Mountain<br />
overview map.<br />
Lomatium cookii population monitoring progress report, 2009 22
Close-up of the plot layout at North Harper North. Note the scale bar at the bottom<br />
left corner of the photo (89 ft).<br />
11T 0481055E 4857204N (transect start point, Nad83), GPS accuracy ±25 ft.<br />
Lomatium cookii population monitoring progress report, 2009 23
Close-up of the plot layout at North Harper South. Note the scale bar at the bottom<br />
left corner of the photo (609 ft). If area is approached from Lytle Blvd., the parking<br />
place <strong>for</strong> sampling North Harper South is marked (upper right). If area is approached<br />
from Cow Hollow, you can park at North Harper South and will have to walk up to<br />
North Harper North. The hill below the parking place is too steep to drive up.<br />
11T 0481446E 4856682N (Plot 675, Nad83), GPS accuracy ±25 ft.<br />
Lomatium cookii population monitoring progress report, 2009 24
Russell Rd.<br />
Driving route to Double Mountain (red) and alternative route to North Harper South<br />
(green). Highway 20 is north on Russell Road. Follow the 7.5” USGS topo quad and<br />
written driving directions carefully (Appendix C).<br />
Lomatium cookii population monitoring progress report, 2009 25
Close-up of plot layout at the Double Mountain sampling site. The label <strong>for</strong> 677 is<br />
hidden within the group to the east (right). Plot 685 is not plotted because the cage<br />
was found rolled up in 2009. Note the scale bar in the lower left corner of the photo<br />
(199 ft).<br />
11T 0476635E 4853382N (transect start point, Nad83), GPS accuracy ± 25 ft.<br />
Lomatium cookii population monitoring progress report, 2009 26
Clover Ln..<br />
Mendiola Rd.<br />
Driving route to Brown Butte sampling site from State Route 201. See Appendix C <strong>for</strong><br />
written directions. After Clover Lane, follow the written directions carefully.<br />
Lomatium cookii population monitoring progress report, 2009 27
Close-up of the plot layout at Brown Butte. The faint trail bisecting the photo is the<br />
top of the ridge. Access road is 165 meters northeast of plot 545 (north is up). Note<br />
scale bar in lower left corner of photo (95ft).<br />
11T 0489997E 4842103N (Nad83, transect starting point), GPS accuracy ±25 ft.<br />
Lomatium cookii population monitoring progress report, 2009 28
APPENDIX C. ASTRAGALUS MULFORDIAE CONTACTS, GEAR LIST, AND DIRECTIONS<br />
Contacts<br />
Vale District BLM: Gillian Wigglesworth, (541) 473-3144<br />
Gear List<br />
Camping Box<br />
Dry foods box<br />
Water jug *2<br />
Camp table<br />
Camping chairs (one/person)<br />
Large cooler & soft cooler<br />
Health and Safety Box<br />
Small trowel<br />
Last year’s report<br />
Last year’s data<br />
Maps (USGS 7.5” topos, Gazetteer, BLM overview topo)<br />
Datasheets<br />
Printout of text file including GPS pts <strong>for</strong> all plots (in ASMU folder)<br />
Clipboards (tatum + 3 extra)<br />
Mechanical pencils<br />
3 50m tapes<br />
Ruler—one per person<br />
2 pieces rebar<br />
5 10” steel nails<br />
5 wooden stakes<br />
Mallet<br />
Compasses (at least 2)<br />
5 plot frames<br />
string to divide frames<br />
GPS unit<br />
Flora (H&C, Jepson)<br />
Plot tags<br />
Wire<br />
Wire cutters<br />
Work gloves<br />
Fencing (small amount if replacements necessary)<br />
4 candy canes<br />
flagging<br />
Lomatium cookii population monitoring progress report, 2009 29
Directions – Update directions as needed <strong>for</strong> future sampling. DO NOT assume<br />
directions, especially mileages, are precise. You can use the Google maps (above) and a<br />
compass to ensure you are always basically going in the right direction. Leave all gates as<br />
you find them (open or closed)!<br />
South Alkali Field Site<br />
In Vale, get onto 10 th Street and go north. 10 th curves to the right and turns into Lagoon<br />
Dr. Lagoon parallels railroad tracks until it dead ends, go left (north) onto Foothill Dr. At<br />
intersection, Foothill turns right, stay straight, road changes to Vale View Rd. After 0.5 --<br />
0.75mi, turn right onto a dirt road, it looks like a driveway. Dirt road curves to left, drive<br />
through farm fields and over an irrigation ditch, towards the hills! The irrigation ditch<br />
should be on your left on the way up. The road turns right, away from the ditch, make an<br />
immediate left. At this point you must go through a gate that has rock columns (fenced),<br />
on either side. Arrive at Jordan Water Hole (marked on USGS quad). Follow road (to<br />
left) up ridge, you should be able to look into valley to east the entire time. At the top of<br />
the ridge you must go through a second gate.<br />
Double Mountain Field Site (from BLM office in Vale)<br />
Turn right out of the BLM visitor’s parking lot. Turn left onto 14 th street. Turn right onto<br />
Hope Street. Turn left onto 17 th street. Turn right onto Washington (20W). Take 20W<br />
past Vale. Turn left onto Russell Rd. Go 2 miles and turn left onto Dry Creek. Go<br />
through gate on left after a mile (it may be closed). Continue to site.<br />
Brown Butte/Blackjack Field Site<br />
Mendiola Road to Clover Lane (will see stand of trees); where pavement ends, turn left;<br />
cross canal and make a hard right turn (onto Road E); bear right, drive along base of<br />
butte, next to canal; cross over cattle guard, continue into pasture; at intersection/power<br />
lines, make a right turn (follow power lines <strong>for</strong> 3 mi); near gravel pit.<br />
North Harper (North and South)<br />
From Cow Hollow<br />
From Vale, take 20 west. Turn left onto Russell Rd. Turn left onto Dry Creek/Twin<br />
Spring (Cow Hollow) and go through clipped gate to left. After ~4mi, turn left onto 2<br />
track, drive fence line, go past cattle station (road goes through big thicket of Russian<br />
thistle, kind of invisible), continue to gate on left. Go through the gate on left and<br />
continue to drive the fenceline to the right. You will next come to a locked gate, follow<br />
the road to the left and up into the hills (along a drainage). This road will take you<br />
directly to the site. Do not go up the large steep hill, this is too far.<br />
From Lytle Blvd.<br />
Turn right onto dirt road (if coming from Vale) that cuts to northwest and goes behind<br />
ridge paralleling road. If you pass the dump, you went too far. Keep on dirt road <strong>for</strong> ~2.5<br />
miles (always going ±NW) until you come to a triangle junction, turn left (towards water<br />
tower). Road runs ~SW <strong>for</strong> 0.9 miles be<strong>for</strong>e turning WNW (near the water tower). Drive<br />
1.5 miles (total from last triangle junction), go through fence and turn left (south). Road<br />
Lomatium cookii population monitoring progress report, 2009 30
will follow fenceline <strong>for</strong> ~1.25 miles until it reaches another triangle junction, take right<br />
<strong>for</strong>k, which will spit you out going west on new road after 1.35 total miles from last<br />
junction. After 0.1 miles, take left <strong>for</strong>k. In 0.3 miles you will reach another <strong>for</strong>k (with a<br />
large patch of Oenothera cespitosa). Go left and park at top of hill to walk down and<br />
sample N. Harper South, go right, drive 0.4 miles west, and park to sample N. Harper<br />
North. Follow USGS 7.5” topo carefully.<br />
Snively Field Site<br />
Take 201 South past Nyssa. If you get to Adrian, you’ve gone too far. Turn right onto<br />
Owyhee Avenue. Turn left onto Owyhee Lake Road. Follow past Snively Hot Springs,<br />
field site is across the road from a campground with cottonwoods.<br />
Lomatium cookii population monitoring progress report, 2009 31
APPENDIX D. SUMMARY OF ASTRAGALUS MULFORDIAE DATA FROM CAGED/UNCAGED PLOTS<br />
<strong>Astragalus</strong> <strong>mul<strong>for</strong>diae</strong> characteristics in caged and uncaged (open) plots at six sites in the Vale District BLM in<br />
2009. All herbivory in caged plots marked as “ungulate” was the result of rodents.<br />
ave.<br />
Total Total<br />
Total diameter ave. longest ave. insect ungulate<br />
Site Treatment plants (cm) stem (cm) inflo herbivory herbivory<br />
Brown Butte caged 19 33.2 21.9 42.6 4 4<br />
Brown Butte open 20 25.6 19.8 15.0 3 7<br />
Double Mtn caged 16 25.7 17.9 14.4 2 5<br />
Double Mtn open 25 23.9 15.2 18.9 2 11<br />
N. Harper North caged 30 35.8 23.9 47.2 3 10<br />
N. Harper North open 27 31.6 20.9 41.9 1 10<br />
N. Harper South caged 19 26.9 18.6 26.4 5 2<br />
N. Harper South open 19 26.2 17.2 33.2 0 2<br />
Snively caged 27 24.4 21.1 17.9 0 0<br />
Snively open 12 34.2 22.8 42.8 1 2<br />
South Alkali caged 43 25.8 20.4 11.2 6 1<br />
South Alkali open 29 33.0 23.0 25.0 5 14<br />
TOTALS: 286 28.9 20.2 28.0 32 68<br />
Lomatium cookii population monitoring progress report, 2009 32
<strong>Astragalus</strong> <strong>mul<strong>for</strong>diae</strong> characteristics in caged and uncaged (open) plots at six sites in the Vale District BLM in<br />
2008. All herbivory in caged plots marked as “ungulate” was the result of rodents.<br />
ave.<br />
Total Total<br />
Total diameter ave. long stem ave. insect ungulate<br />
Site Treatment plants (cm) (cm) inflo herbivory herbivory<br />
Brown Butte caged 19 19.4 13.2 13.8 0 5<br />
Brown Butte open 21 16.7 12.4 14.4 0 2<br />
Double Mtn caged 21 21.7 13.6 13.0 0 0<br />
Double Mtn open 28 20.2 13.4 31.6 1 5<br />
N. Harper North caged 29 27.3 18.0 44.5 1 11<br />
N. Harper North open 27 29.0 20.4 58.6 0 13<br />
N. Harper South caged 19 22.7 15.6 19.7 0 1<br />
N. Harper South open 20 21.0 14.1 20.2 1 0<br />
Snively caged 38 12.3 11.5 8.8 1 0<br />
Snively open 22 19.7 17.3 17.5 0 0<br />
South Alkali caged 56 21.9 17.0 35.8 0 2<br />
South Alkali open 38 28.3 19.6 55.9 0 1<br />
TOTALS: 338 21.7 15.5 27.8 4 40<br />
Lomatium cookii population monitoring progress report, 2009 33