Investigation of Two-Photon Laser-Induced Fluorescence Detection ...
Investigation of Two-Photon Laser-Induced Fluorescence Detection ...
Investigation of Two-Photon Laser-Induced Fluorescence Detection ...

Create successful ePaper yourself
Turn your PDF publications into a flip-book with our unique Google optimized e-Paper software.
<strong>Investigation</strong> <strong>of</strong> <strong>Two</strong>-<strong>Photon</strong> <strong>Laser</strong>-<strong>Induced</strong> <strong>Fluorescence</strong> <strong>Detection</strong> <strong>of</strong><br />
Carbon Monoxide for Applied Combustion Diagnostics<br />
M. Richter, Z. S. Li * and M. Aldén<br />
Division <strong>of</strong> Combustion Physics, LTH, P.O. Box 118<br />
Lund University, S-221 00 Lund, Sweden<br />
Abstract<br />
The properties <strong>of</strong> two-photon laser-induced fluorescence (LIF) signals from carbon monoxide have been studied in<br />
order to investigate the applicability <strong>of</strong> this technique for measurement and visualization <strong>of</strong> CO molecules in applied<br />
combustion environments. Spectrally and spatially resolved measurements were carried out in a test cell, in a flame<br />
and in an engine. In the cell measurements, the two-photon fluorescence signal from CO was studied as a function<br />
<strong>of</strong> laser flux and ambient pressure. In addition, measurements with buffer gas at pressures from 0.1 up to 10 bars<br />
were carried out. In the flame measurements, problems from spectral interference due to undesired C2 molecules<br />
produced by photodecomposition <strong>of</strong> fuel and fuel fragments were investigated at different stoichiometries. <strong>Two</strong><br />
dimensional LIF imaging <strong>of</strong> CO was also performed in an engine. The interference from C2 and photolysis <strong>of</strong> hot<br />
CO2 was excluded from the spectral and spatial resolved measurements.<br />
.<br />
Introduction<br />
<strong>Detection</strong> <strong>of</strong> Carbon monoxide has always been a<br />
important task for laser combustion diagnostics.<br />
Various laser diagnostic techniques have been<br />
developed during the last decades and they have<br />
become <strong>of</strong> utmost importance for a deepened<br />
understanding <strong>of</strong> combustion processes. This<br />
statement is to a large degree due to the outstanding<br />
features like non-intrusiveness in combination with<br />
high temporal and spatial resolution for<br />
measurements <strong>of</strong> species concentrations,<br />
temperatures, velocities and particle characteristics,<br />
see e.g. [1-3]. The technique that has attracted most<br />
attention is <strong>Laser</strong>-<strong>Induced</strong> <strong>Fluorescence</strong> (LIF), see<br />
e.g [4]. Most <strong>of</strong> the combustion diagnostic<br />
experiments using LIF have been directed towards<br />
single photon excitation. There are, however, several<br />
species <strong>of</strong> combustion interest that do not have easily<br />
accessible excitation wavelengths in the UV/visible<br />
part <strong>of</strong> the spectrum, e.g. the light atoms O, N, H, C<br />
and molecules like H2, H2O, NH3, CO. Many <strong>of</strong> these<br />
species have their main electronic resonances in the<br />
vacuum ultraviolet region <strong>of</strong> the electromagnetic<br />
spectrum. In order to overcome the problems <strong>of</strong><br />
generating and using VUV laser beam and the<br />
problems associated with excitation in this spectral<br />
region, multi-photon excitation processes have been<br />
utilized for the probing <strong>of</strong> these species.<br />
One <strong>of</strong> the species mentioned above, CO, as an<br />
indicator <strong>of</strong> the combustion efficiency and as a major<br />
pollutant, is one <strong>of</strong> the most important molecules in<br />
combustion processes. In combustion environments<br />
CO has been measured commonly by exciting the<br />
molecule from its ground state, X 1 Σ + , to the excited<br />
* Corresponding author: zhongshan.li@forbrf.lth.se<br />
Associated Web site: http://spartacus.forbrf.lth.se/<br />
Proceedings <strong>of</strong> the European Combustion Meeting 2005<br />
state, B 1 Σ + , via two-photon excitation at 230.1 nm<br />
and observing the fluorescence from the excited level<br />
to the lower lying A 1 Π level by detecting the<br />
fluorescence in the spectral range between 451 nm<br />
(v’=0, v’’=0) and 662 nm (v’=0, v’’=5), see Figure 1<br />
where the collision induced triplet transitions are also<br />
indicated. Using this excitation scheme several flame<br />
measurements have been performed [5-9]. Quenching<br />
measurements in flames using pico-second excitation<br />
[10, 11] have also been reported. In order to achieve<br />
a quantitative interpretation <strong>of</strong> the two-photon LIF<br />
signal, substantial efforts have been put in measuring<br />
important parameters such as the two-photon<br />
excitation cross-sections [12], photoionization crosssections<br />
and ac Stark shift [13], collisional<br />
broadening and shift [14], species-specific and<br />
temperature-dependent quenching cross-sections [15,<br />
16]. Photochemical effects from vibrational hot CO2<br />
[17] has been investigated as an interference for twophoton<br />
LIF CO detection in atmospheric pressure<br />
flames. Among other alternative spatial-resolved CO<br />
detection techniques, Linow et al. reported the<br />
comparison between the excitation scheme<br />
mentioned above and excitation from the ground<br />
state, X 1 Σ + , to the excited state, C 1 Σ for two photon<br />
LIF measurements [18]; infrared LIF detection <strong>of</strong> CO<br />
has been reported by Hanson’s group [19, 20], by<br />
probing infrared active ro-vibrational overtone bands;<br />
two-photon polarization spectroscopic was<br />
investigated by Nyholm et al. for spatial resolved CO<br />
detection [21].<br />
Despite the relatively large number <strong>of</strong><br />
publications including flame measurements <strong>of</strong> CO<br />
detection using two-photon LIF, so far to our
knowledge no investigation at high pressure and<br />
engine applications have been reported. The aim <strong>of</strong><br />
the present work was to investigate the applicability<br />
<strong>of</strong> CO detection with two-photon LIF in combustion<br />
engine. In order to understand the behaviour and<br />
achieve a quantitative interpretation <strong>of</strong> the CO LIF<br />
signal from the combustion engine, where both high<br />
pressure and high temperature presented, a pressure<br />
dependent measurement in a static cell and a flame<br />
measurement with different stoichiometries have<br />
been performed. Single shot, two dimensional CO<br />
LIF imaging in a test engine was finally<br />
demonstrated with exclusion <strong>of</strong> the potential<br />
interference from C2 and from photolysis <strong>of</strong> hot CO2.<br />
Figure 1. Schematic energy level diagram for<br />
carbon monoxide. Depicted also the two-photon<br />
excitation, the fluorescence decay and the collisioninduced<br />
triplet state transitions.<br />
Cell and flame measurements<br />
In order to investigate the potential for<br />
quantitative LIF measurements <strong>of</strong> CO in general and<br />
at elevated pressure in specific, it is necessary to<br />
control a range <strong>of</strong> properties affecting the relation<br />
between laser power and the generated signal level<br />
and the signal dependences on pressure and possible<br />
photolytic creation <strong>of</strong> C2 radicals. When probing CO,<br />
in addition to the more conventional quenching<br />
phenomenon (marked with a Q in Figure 1),<br />
properties like two-photon absorption, stimulated<br />
emission and ionization effects have to be taken into<br />
account, which are all dependent on the laser<br />
intensity. The laboratory experiments served to<br />
investigate these properties in simulated combustion<br />
environments, i.e. to investigate the dependencies on<br />
laser energy, pressure, temperature and<br />
stoichiometry, as well as, the influence from the<br />
presence <strong>of</strong> other species.<br />
A Nd:YAG (Continuum NY82-S)) pump dye<br />
laser (continuum ND60) system are utilized in the<br />
cell and the flame measurements. The dye laser (with<br />
a mixture <strong>of</strong> Rhodamine 590 and Rhodamine 610<br />
dissolved in methanol) was pumped by the second<br />
2<br />
harmonic from the Nd:YAG laser, producing<br />
radiation at 587.2 nm. Frequency doubling in a KDPcrystal<br />
resulted in 293.6 nm. By mixing this with the<br />
fundamental 1064 nm from the Nd:YAG laser,<br />
approximately 4.5 mJ <strong>of</strong> the required radiation at<br />
230.1 nm was generated.<br />
The investigated gas mixtures were kept in a<br />
stainless steel high pressure vessel equipped with<br />
quartz windows. The laser beam was focused with a<br />
single spherical lens through the cell with the focus<br />
point centred in the middle. The interaction region<br />
between the CO molecules and the laser beam was<br />
imaged with an image intensified CCD (ICCD)<br />
camera (Princeton Instruments, ICCD-5765S)<br />
perpendicular to the excitation laser beam. A long<br />
pass filter was placed in front <strong>of</strong> the ICCD to block<br />
the scattered light from the 230 nm excitation laser.<br />
Figure 2. Plot showing the CO LIF signal measured<br />
at twelve different pressures ranging from 0.1 to 3.0<br />
bar.<br />
Shown in Figure 2 is the resulting CO LIF signal<br />
versus pressure when the cell was filled with pure<br />
carbon monoxide and the pressure varied from 0.1<br />
bar to 3 bar. The laser was propagating from left to<br />
right and the focus point located at 0 mm. The<br />
absorption effect <strong>of</strong> the excitation laser as it<br />
transverse the cell was obvious as indicated by the<br />
decrease <strong>of</strong> the LIF signal along the laser beam and<br />
the absorption increase with the increased CO<br />
pressure in the cell. Note that even for a fix laser<br />
energy output the laser flux density will vary along<br />
the focal line, i.e. it will decrease with the distance to<br />
focus. As can be seen this results in a variation <strong>of</strong> the<br />
fluorescence intensity along the beam. The ionization<br />
potential <strong>of</strong> the CO molecule is 14.0139 eV. This<br />
gives that when the B 1 Σ + level is excited, absorption<br />
<strong>of</strong> one additional photon would be sufficient to ionize<br />
the molecule. The dip at the focus location is<br />
probably due to the increased influence <strong>of</strong> photo<br />
ionization. To understand this better, spatial resolved<br />
CO LIF measurement with 400 mbar pure CO in the<br />
cell was performed with varied excitation laser pulse<br />
energy. Shown in Figure 3 is an example <strong>of</strong> such a<br />
measurement with the laser pulse energy varied from<br />
0.2 to 2.4 mJ. The CO LIF emission is highly
dependent on several parameters, like laser intensity,<br />
ionization, non-linear absorption which all contribute<br />
to the question <strong>of</strong> correct signal interpretation in an<br />
applied combustion situation. In order to understand<br />
the phenomena taking place and the interaction<br />
between these phenomena a simulation based on a<br />
four level rate equation system including photoionisation,<br />
quenching, two-photon absorption, and<br />
spontaneous emission was applied to calculate the<br />
spatial distribution <strong>of</strong> the CO LIF signal [22]. The<br />
thick line shown in Figure 3 is a simulation <strong>of</strong> the<br />
measured curves with 2.4 mJ per pulse the laser<br />
intensity. A general similarity between the simulated<br />
pr<strong>of</strong>ile and the measured one was achieved, which<br />
indicates that the model are proper in prescribe the<br />
observed the phenomenon.<br />
Figure 3. The variation <strong>of</strong> the CO LIF intensity along<br />
the laser beam. The gas pressure <strong>of</strong> CO in the cell was<br />
held constant at 400 mbar, while the energy <strong>of</strong> the laser<br />
pulse was varied from 0.2 to 2.4 mJ. The thick line<br />
represents a simulated fluorescence signal along the<br />
laser beam with 2.4 mJ per pulse.<br />
Signal intensity (counts)<br />
10 4<br />
10 3<br />
k = 2<br />
k = 1<br />
0.1 bar<br />
0.2 bar<br />
0.5 bar<br />
1.0 bar<br />
2.0 bar<br />
3.0 bar<br />
106 107 108 109 <strong>Laser</strong> fluence (W/cm2) Figure 4. Plot showing the measured LIF<br />
signal vs excitation laser fluxes at different CO<br />
pressures.<br />
Shown in Figure 4 are the LIF signal intensities<br />
as the laser energy was increased for different<br />
pressures <strong>of</strong> CO in the cell. Normally, the<br />
3<br />
fluorescence signal, S, in a two-photon excitation<br />
processes depends quadratically on the incident laser<br />
intensity, I, i.e. S ∼ I k , where k = 2. However, at<br />
higher laser energies photo-ionization <strong>of</strong> the CO<br />
molecule becomes significant. Moreover, the<br />
transition starts to saturate and also at higher laser<br />
energy two-photon absorption decreases the signal<br />
intensity. Hence, the fluorescence signal scales with k<br />
= 2 in the low laser intensity limit, and turns into k is<br />
close to one when the laser intensity is increased. If<br />
the laser intensity is further increased the signal goes<br />
through a maximum until the signal actually<br />
decreases as the laser intensity is increased further.<br />
Figure 5. LIF signal dependence on the buffer N2 pressures (100 mbar CO, N2 pressure varied).<br />
In order to estimate the delectability <strong>of</strong> using<br />
two-photon LIF at elevated pressure, e.g. in engines,<br />
measurements in the cell with and without buffer<br />
gases were carried out at pressures from 0.1 bar up to<br />
8 bar. It is more realistic to investigate the CO LIF<br />
signal intensity while adding a buffer gas to a<br />
constant pressure <strong>of</strong> CO in the cell. Shown in Figure<br />
5 is the signal distribution from CO at a pressure <strong>of</strong><br />
100 mbar while the pressure <strong>of</strong> the buffer gas, N2,<br />
was varied from 0 to 10 bar. As expected the signal<br />
decreases as the pressure is increased. Also the shape<br />
<strong>of</strong> the signal distribution changes as the pressure<br />
increases.<br />
In the flame investigations, the behaviour <strong>of</strong><br />
spectral interference from non-resonantly excited C2<br />
molecules, produced by photo-decomposition <strong>of</strong> fuel<br />
and fuel fragments, were studied at various<br />
stoichiometries and laser intensities. The first flame<br />
measurement was performed in a laminar, premixed,<br />
methane/air flame. During the flame measurements<br />
the cell was replaced by a premixed Bunsen-type<br />
conical burner, which has a prolonged intake duct in<br />
order to assure a laminar flow. Through a<br />
spectrometer (Acton, SpectraPro-150) equipped the<br />
ICCD camera, a spectral resolved CO LIF spectrum,<br />
as shown in Figure 6, was recorded for a Φ = 1.5<br />
methane/air flame with 50 laser shots averaged. As<br />
shown in the Figure, some C2 interference lines are<br />
clearly shown.
C 2 interferences<br />
(c 1 Π g – b 1 Π u)<br />
(d 3 Π g – a 3 Π u)<br />
-7 -6 -5 -4 -3 -2 -1 0 1 2 3 4 5 6 7<br />
Distance (mm)<br />
400<br />
450<br />
500<br />
550<br />
600<br />
650<br />
Wavelength (nm)<br />
Figure 6. A CO fluorescence spectrum from a<br />
methane/air (φ=1.5) burner is shown above. The C 2<br />
lines around 474 nm and 520 nm are visible.<br />
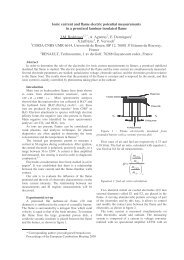
Engine measurements<br />
The measurements in the cell and the premixed<br />
flame were followed by measurements in a small<br />
single-cylinder four-stroke Briggs & Stratton engine<br />
[23]. The engine featured a side-valve design with the<br />
spark plug located above the exhaust valve. The<br />
original crankcase, cylinder liner and piston remained<br />
unaltered, while the cylinder head was modified to<br />
allow for optical access to the combustion chamber.<br />
Three windows were mounted in the cylinder head<br />
for this purpose. <strong>Two</strong> vertical windows, one on the<br />
side <strong>of</strong> the combustion chamber, made it possible to<br />
have a horizontal laser sheet passing through it. The<br />
induced fluorescence was imaged through a third<br />
window mounted horizontally above the two valves.<br />
A picture taken from above, through the top window,<br />
is shown in Figure 7. In this image the intake valve<br />
can be seen to the left and the exhaust valve to the<br />
right. The spark plug electrodes are also visible in the<br />
lower right corner. The field <strong>of</strong> view for the ICCD<br />
camera is also shown in this figure, where the outer<br />
white frame illustrates the area covered during the<br />
flame chemiluminescence imaging and the inner<br />
frame illustrates the area covered during the CO LIF<br />
imaging.<br />
Isooctane was used as the fuel for the engine<br />
measurements. Shown in Figure 8 are single-shot<br />
images <strong>of</strong> the flame chemiluminescence. These<br />
images are recorded at subsequent crank angle<br />
positions to cover the different parts <strong>of</strong> the engine<br />
cycle. The exposure time for the ICCD camera was<br />
set to 5 µs, which corresponded to a crank shaft<br />
rotation <strong>of</strong> less than 0.04 crank angle degrees (CAD).<br />
At Top Dead Center (TDC), a developing flame<br />
kernel originating from the vicinity <strong>of</strong> the spark plug<br />
can be seen; 5 CAD after TDC, the flame is more<br />
spread out from the spark plug; the flame then<br />
continues to expand as expected and as shown by the<br />
images recorded at 15 and 30 CAD after TDC.<br />
4<br />
Figure 7. Vision <strong>of</strong> the engine chamber from the top<br />
window. Outer write frame indicate the chemiluminescence<br />
collection area; inner write frame<br />
indicates the LIF imaging area.<br />
300 600 900 400 1000 1800 2400<br />
TDC<br />
15 TDC<br />
5 TDC 30 TDC<br />
Figure 8. Flame chemiluminescence emission taken<br />
with 5 microsecond gate time.<br />
During the engine LIF experiments a singlemode<br />
Nd:YAG laser (Spectra Physics, PRO 290-10)<br />
pumping a OPO laser system (Spectra Physics,<br />
MOPO 730-10) was utilized to produce the required<br />
230 nm laser radiation. When pumped with 550 mJ<br />
per pulse at 355 nm, the OPO delivered 75 mJ per<br />
pulse at 460 nm. After frequency doubling in a BBO<br />
crystal, laser radiation at 230 nm with a pulse energy<br />
<strong>of</strong> 15 mJ was obtained. For this setup the 230 nm<br />
laser has an estimated linewidth <strong>of</strong> ~ 0.3 cm -1 . The<br />
230 nm beam was formed into a 12 mm wide laser<br />
sheet with a thickness <strong>of</strong> approximately 300 µm. The<br />
laser sheet was sent through the combustion chamber<br />
right above the valves as indicated in Figure 9. The<br />
ICCD camera was used for detection <strong>of</strong> the LIF<br />
through the top window perpendicular to the laser<br />
sheet. A long-pass filter was used for suppressing the<br />
scattered laser radiation while transmitting the redshifted<br />
fluorescence. The engine was run at 1200 rpm<br />
corresponding to a firing frequency <strong>of</strong> 10 Hz<br />
matching the repetition rate <strong>of</strong> the laser system.<br />
Setting the engine as master, a trigger signal for each<br />
engine cycle, locked at a selected crank angle<br />
position, was sent to a pulse-delay generator<br />
(Stanford, DG535), which was used to synchronize<br />
the laser system and the ICCD camera. This enabled
LIF images to be recorded at any desired crank<br />
angles <strong>of</strong> the engine cycle. The integration time for<br />
the ICCD camera was set to 50 ns in order to<br />
minimize the flame chemiluminescence background.<br />
200 300 400 500 600 700 800 900 1000 1100 1200<br />
TDC<br />
5 TDC<br />
10 TDC<br />
20 TDC<br />
30 TDC<br />
Figure 9. CO TPLIF images at different crank angles.<br />
Single-shot CO PLIF images from the engine were<br />
recorded at subsequent crank angles, examples are<br />
shown in Figure 9. At TDC just before the ignition, a<br />
faint CO LIF image was recorded. This small amount<br />
<strong>of</strong> CO originates from the exhaust gas <strong>of</strong> the previous<br />
cycle, remembering this is a side valve engine with<br />
high amounts <strong>of</strong> residuals. At 5 and 10 CAD after<br />
TDC, the increased intensity and spread out CO LIF<br />
distribution reveal the flame location. At 20 and 30<br />
CAD after TDC, the CO PLIF images show a more<br />
intense signal in the left part <strong>of</strong> the combustion<br />
chamber (furthest away from the spark plug) and<br />
only a weak signal in the right part indicating the<br />
fading away <strong>of</strong> the reaction zone <strong>of</strong> the flame.<br />
Compared with the flame chemiluminescence images<br />
shown in Figure 8, one can find that although a<br />
strong flame chemiluminescence was observed at 30<br />
CAD after TDC the CO LIF had already decreased. It<br />
should be kept in mind that the recording <strong>of</strong><br />
chemiluminescence is a line-<strong>of</strong>-sight technique<br />
integrating across the entire thickness <strong>of</strong> the<br />
combustion chamber whereas the PLIF technique<br />
monitors a thin slice in the middle <strong>of</strong> the combusting<br />
volume. The results indicate that the CO<br />
concentration reaches the highest value in the flame<br />
reaction zone in this high pressure engine combustion<br />
environment. This is in agreement with the expected<br />
scenario where CO is formed as an intermediate<br />
species when the fuel is decomposed and then<br />
consumed as the temperature increases. At high<br />
5<br />
temperature and pressure, the interference from<br />
photolysis <strong>of</strong> hot CO2 molecule [24] can be a<br />
problem in the CO LIF detection. From the fact that<br />
only weak CO LIF was detected at 30 TDC, where<br />
high temperature are revealed from the<br />
chemiluminescence measurement, one can judge that<br />
the hot CO2 photo-fragmentation are <strong>of</strong> little concern<br />
in this experiment. This might be due to the high<br />
nascent CO concentration in the engine flame.<br />
Intensity (arb. Units)<br />
Intensity (arb. units)<br />
Intensity (arb. units)<br />
Intentisty (arb. units)<br />
6 x10⁴<br />
5<br />
4<br />
3<br />
2<br />
1<br />
0<br />
7 x10⁴<br />
6<br />
5<br />
4<br />
3<br />
2<br />
1<br />
0<br />
6 x10⁴<br />
5<br />
4<br />
3<br />
2<br />
1<br />
0<br />
14 x104<br />
12<br />
10<br />
8<br />
6<br />
4<br />
2<br />
scattered 460 nm laser light<br />
emission from C2<br />
5 degree ATDC<br />
15 degree ATDC<br />
scattered 460 nm laser light<br />
25 degree ATDC<br />
scattered 460 nm laser light<br />
a<br />
b<br />
c<br />
20 degree BTDC<br />
exhaust cycle<br />
scattered 460 nm laser light<br />
d<br />
0<br />
450 500 550 600 650 700<br />
Wavelength (nm)<br />
Figure 10. Spectra <strong>of</strong> TPLIF <strong>of</strong> CO from engine<br />
chamber.<br />
In order to clarify any other possible<br />
interference in the recorded CO LIF images, spectral
investigations <strong>of</strong> the fluorescence emission from the<br />
engine were performed. The CO LIF was sent<br />
through a spectrometer (Acton, SpectraPro-150) and<br />
detected with the ICCD camera. Shown in Figure 10<br />
are CO LIF spectra from the engine recorded at<br />
different crank angles. A spectral line at 460 nm,<br />
which is residuals from the OPO signal beam, is<br />
evident in every spectrum. The relative intensity <strong>of</strong><br />
this line can be used as a measure <strong>of</strong> the CO LIF<br />
intensity. The emission from C2 can introduce strong<br />
interference in CO LIF measurements especially in<br />
fuel rich flames. In Figure 10 (a), the strongest C2<br />
line showed only a very small peak, which indicates<br />
that the C2 interference were negligible in the<br />
presented measurement. Shown in Figure 10 (d) is a<br />
CO spectrum recorded at 20 CAD before TDC in the<br />
exhaust stroke, hence, the detected CO LIF signal<br />
originates from the CO in the exhaust gases. The low<br />
temperature and low pressure at this crank angle may<br />
explain the relatively intense CO LIF spectrum<br />
observed there, as indicated in Figure 5 there is a<br />
strong pressure dependence <strong>of</strong> the LIF signal. One<br />
might also be encouraged to use CO LIF technique to<br />
study engine exhaust gas recycling (EGR)<br />
distributions by performing single-shot 2D EGR<br />
measurements.<br />
Summary<br />
<strong>Two</strong>-photon LIF detection <strong>of</strong> carbon monoxide<br />
has been performed in a cell at elevated pressure, in<br />
flames with different stoichiometric and in an engine.<br />
The dependence <strong>of</strong> the LIF signal on pressure and<br />
excitation laser power density was investigated.<br />
Despite the complex involving photo-ionization,<br />
quenching, absorption etc, a general understand <strong>of</strong><br />
the behaviour <strong>of</strong> the CO LIF signal was achieved. In<br />
flame measurements, C2 interference was clearly<br />
observed especially in rich flames. Finally in the<br />
engine measurements, single-shot, two dimensional<br />
CO imaging was achieved. With the spatial- and<br />
spectral- resolved measurements, interference both<br />
from C2 and from hot CO2 photo fragmentation are<br />
excluded. To the best <strong>of</strong> our knowledge, this<br />
represents the first single shot CO imaging in<br />
combustion engines.<br />
Acknowledgments<br />
This work is supported by the Swedish Science<br />
Council (VR) and The Swedish Energy<br />
Administration (STEM).<br />
References<br />
1. A. C Eckbreth, “<strong>Laser</strong> Diagnostics for<br />
Combustion Temperature and Species”, 2 nd<br />
edition, Gordon and Breach, UK, 1996.<br />
2. K. Kohse-Höinghaus, and J. B. Jeffries, (eds.),<br />
“Applied Combustion Diagnostics”, Taylor and<br />
Francis, New York, 2002.<br />
6<br />
3. J. Wolfrum, Twenty-Seventh Symposium<br />
(International) on Combustion, The Combustion<br />
Institute, Pittsburgh, 1-41 (1998).<br />
4. K. Kohse-Höinghaus, Prog. Energy Combust.<br />
Sci. 20, 203-279 (1994).<br />
5. M. Aldén, S. Wallin and W. Wendt, Appl. Phys.<br />
B 69, 505 (1984).<br />
6. J. Haumann, J. M. Seitzman and R. K. Hanson,<br />
Opt. Letts. 11, 776-779 (1986).<br />
7. J. M. Sertzman, J. Haumann and R. K. Hansson,<br />
Appl .Opt. 26, 2892-2899 (1987).<br />
8. D. A. Everest, C. R. Shaddix and K. C. Smyth,<br />
Twenty-Sixth Symposium (International) on<br />
Combustion, The Combustion Institute, 1161-<br />
1169 (1996).<br />
9. N. Georgiev and M. Aldén, Appl. Spec. 51,<br />
1229-1237 (1997).<br />
10. S. Agrup and M. Aldén, Chem. Phys. Letts. 189,<br />
211-216 (1992).<br />
11. S. Agrup and M. Aldén, Applied Spectroscopy<br />
48, 1118 (1994).<br />
12. M. D. Di Rosa and R. L. Farrow, J. Opt. Soc.<br />
Am. B 16, 1988-1994 (1999).<br />
13. M. D. Di Rosa and R. L. Farrow, J. Opt. Soc.<br />
Am. B 16, 861-870 (1999).<br />
14. M. D. Di Rosa and R. L. Farrow, J. Quant. Spec.<br />
Rad. Trans. 68, 363-375 (2001).<br />
15. F. D. Teodoro, J. E. Rehm, R. L. Farrow and P.<br />
H. Paul, J. Chem. Phys. 113, 3046-3054 (2000).<br />
16. T. B. Settersten, a. Dreizler and R. L. Farrow,<br />
“Temperature- and species-dependent quenching<br />
<strong>of</strong> CO B probed by tow-photon laer-induced<br />
fluorescence using a picosecond laser”, J. Chem.<br />
Phys. 117, 3173-3179 (2002).<br />
17. A. P. Nefedov, V. A. Sinel’shchikov, A. D.<br />
Usachev and A. V. Zobnin, Appl. Opt. 37, 7729<br />
(1998).<br />
18. S. Linow, A. Dreizler, J. Janicka and F. P.<br />
Hassel, Appl. Phys. B 71, 689-696 (2000).<br />
19. B.J. Kirby and R.K. Hanson, Appl. Phys. B 69,<br />
505-507 (1999).<br />
20. B. J. Kirby and R. K. Hanson, Appl. Opt. 41,<br />
1190-1201 (2002).<br />
21. K. Nyholm, R. Fritzon, N. Georgiev and M.<br />
Aldén, Opt. Commu. 97, 2246-2250 (1995).<br />
22. M. Karlsson, “Experimental and theoretical<br />
studies <strong>of</strong> two-pnoton laer-induced fluorescence<br />
<strong>of</strong> carbon monoxide”, Master’s thesis, Lund<br />
Instituted <strong>of</strong> Technology, LRCP-44 (1998).<br />
23. C. F. Kaminski, X. S. Bai, J. Hult, M. Richter, J.<br />
Nygren, A. Franke, M. Aldén, S .Lindenmaier,<br />
A. Dreizler, U. Maas, R. B. Williams, SAE<br />
Paper 2000-01-2833, Journal <strong>of</strong> Fuels &<br />
Lubricants (2000).<br />
24. W. G. Bessler, C. Shculz, t. Lee, J. B. Jeffries<br />
and R. K. Hanson, Chem. Phys. Letts. 375, 344-<br />
349 (2003).