Hunger Doesn't Take A Vacation: - Food Research and Action Center
Hunger Doesn't Take A Vacation: - Food Research and Action Center
Hunger Doesn't Take A Vacation: - Food Research and Action Center
Create successful ePaper yourself
Turn your PDF publications into a flip-book with our unique Google optimized e-Paper software.
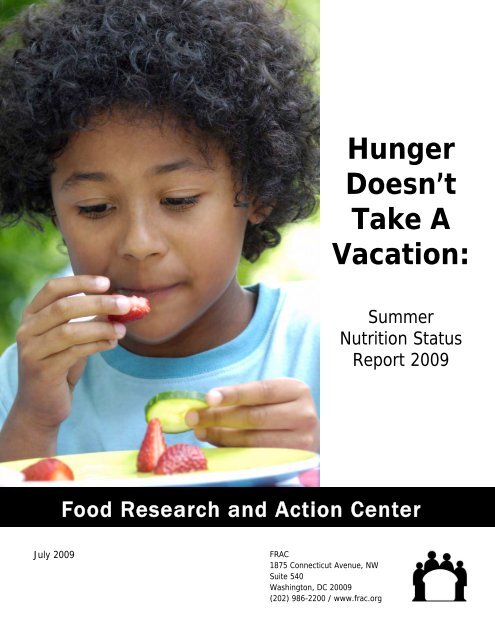
<strong>Hunger</strong><br />
Doesn’t<br />
<strong>Take</strong> A<br />
<strong>Vacation</strong>:<br />
Summer<br />
Nutrition Status<br />
Report 2009<br />
<strong>Food</strong> <strong>Research</strong> <strong>and</strong> <strong>Action</strong> <strong>Center</strong><br />
July 2009 FRAC<br />
1875 Connecticut Avenue, NW<br />
Suite 540<br />
Washington, DC 20009<br />
(202) 986-2200 / www.frac.org
About FRAC<br />
The <strong>Food</strong> <strong>Research</strong> <strong>and</strong> <strong>Action</strong> <strong>Center</strong> (FRAC) is the leading national organization working for more effective<br />
public <strong>and</strong> private policies to eradicate domestic hunger <strong>and</strong> undernutrition.<br />
For more information about FRAC, or to sign up for FRAC’s Weekly News Digest, visit www.frac.org. For<br />
information about out-of-school time nutrition programs, go to www.frac.org/afterschool/.<br />
Acknowledgements<br />
This report was prepared by Rachel Cooper, Crystal FitzSimons, Katherine Moos <strong>and</strong> Ben Hecht.<br />
The <strong>Food</strong> <strong>Research</strong> <strong>and</strong> <strong>Action</strong> <strong>Center</strong> gratefully acknowledges the following funders whose major<br />
support in 2008-2009 has helped to make possible our work on exp<strong>and</strong>ing <strong>and</strong> improving nutrition<br />
programs:<br />
Anonymous Donors<br />
The Atlantic Philanthropies<br />
California Endowment<br />
Annie E. Casey Foundation<br />
The Claneil Foundation<br />
Evangelical Lutheran Church in America<br />
General Mills Foundation<br />
Robert Wood Johnson Foundation<br />
Kaiser Permanente<br />
Kraft <strong>Food</strong>s<br />
L<strong>and</strong> O’Lakes Foundation<br />
A.L. Mailman Family Foundation<br />
MAZON: A Jewish Response to <strong>Hunger</strong><br />
The Moriah Fund<br />
Charles Stewart Mott Foundation<br />
National Dairy Council<br />
New Directions Foundation<br />
Presbyterian <strong>Hunger</strong> Program<br />
Pritzker Early Childhood Foundation<br />
Public Welfare Foundation<br />
Sara Lee Foundation<br />
Taste of the NFL<br />
UPS Foundation<br />
<strong>Food</strong> <strong>Research</strong> <strong>and</strong> <strong>Action</strong> <strong>Center</strong> <strong>Hunger</strong> Doesn’t <strong>Take</strong> a <strong>Vacation</strong> 2009 www.frac.org
Even in good economic times, millions of families<br />
struggle to feed their children healthy, filling meals<br />
when schools close for the summer <strong>and</strong> children<br />
lose access to the free <strong>and</strong> reduced-price school<br />
meals on which they depend during the regular<br />
school.<br />
But these are not good economic times. As the<br />
worst economic conditions in decades continue,<br />
millions of parents are now unemployed or have<br />
had their wages cut, <strong>and</strong> their families’ budgets are<br />
overwhelmed. As summer begins, parents of the<br />
nearly 16.8 million children who relied on the<br />
National School Lunch Program for free or<br />
reduced-price meals every day during the 2007-<br />
2008 school year must figure out how to prevent<br />
their children from going hungry during the<br />
summer.<br />
Two federal programs—the Summer <strong>Food</strong> Service<br />
Program (SFSP) <strong>and</strong> the National School Lunch<br />
Program (NSLP)— are designed to fill this food gap<br />
<strong>and</strong> provide children from low-income families the<br />
kind of nutritious meals <strong>and</strong> snacks in the summer<br />
that they receive during the school year. But<br />
beyond fighting hunger, both programs (FRAC<br />
describes them together in this report as the<br />
“Summer Nutrition Programs”) have other<br />
important benefits for children:<br />
• <strong>Research</strong> finds that children gain more<br />
weight during the summer. Summer<br />
Nutrition Programs can help to combat<br />
childhood obesity. Summer Nutrition<br />
Programs provide foods that meet federal<br />
nutrition st<strong>and</strong>ards, thus providing many<br />
children well balanced meals that are<br />
nutritionally superior to the meals they<br />
would consume on their own.<br />
• Summer Nutrition Programs support<br />
quality programs for children <strong>and</strong> teens<br />
that keep them safe, learning, engaged,<br />
<strong>and</strong> active during the summer months,<br />
reducing the loss of learning that often<br />
happens to children during the long<br />
summer break. The food provided through<br />
Summer Nutrition Programs helps draw<br />
the children into quality summer programs<br />
<strong>and</strong> provides the nutrition necessary for<br />
children to be fully engaged throughout<br />
the day.<br />
Introduction<br />
Despite fighting childhood hunger, obesity <strong>and</strong><br />
summer learning loss, the reach of the Summer<br />
Nutrition Programs falls far short of meeting the<br />
needs of low-income children. In July 2008, the<br />
Summer Nutrition Programs only served lunch to<br />
2.9 million children on an average day. That means<br />
that only one in six low-income children who ate a<br />
school lunch during the regular 2007-2008 school<br />
year were reached by the Summer Nutrition<br />
Programs. Much more must be done to increase<br />
the reach of the Summer Nutrition Programs to<br />
give children access to the healthy food they<br />
deserve.<br />
The Summer Nutrition Programs<br />
The two federal Summer Nutrition Programs—<br />
the National School Lunch Program (NSLP) <strong>and</strong><br />
the Summer <strong>Food</strong> Service Program (SFSP)—<br />
provide funding to serve meals <strong>and</strong> snacks to<br />
children at sites where at least half the children<br />
in the geographic area are eligible for free or<br />
reduced-price school meals; at sites in which at<br />
least 50 percent of the children participating in<br />
the program are individually determined eligible<br />
for free or reduced-price school meals; <strong>and</strong> at<br />
sites that serve primarily migrant children. Once<br />
the site is eligible, all of the children can eat for<br />
free. In areas that do not meet the 50 percent<br />
threshold, sites can only serve the children<br />
enrolled in the program, not other children in<br />
the community. Some summer camps also can<br />
participate.<br />
Public <strong>and</strong> private nonprofit schools, local<br />
governments, National Youth Sports Programs,<br />
<strong>and</strong> private nonprofit organizations can<br />
participate in the SFSP <strong>and</strong> operate one or<br />
multiple sites. Only schools are eligible to<br />
participate in the NSLP, but they can provide<br />
federally-funded meals <strong>and</strong> snacks to school <strong>and</strong><br />
non-school public <strong>and</strong> nonprofit sites over the<br />
summer. The NSLP also reimburses schools for<br />
feeding children that attend summer school.<br />
The United States Department of Agriculture<br />
(USDA) provides the funding through a state<br />
agency in each state—usually the state<br />
department of education.<br />
<strong>Food</strong> <strong>Research</strong> <strong>and</strong> <strong>Action</strong> <strong>Center</strong> <strong>Hunger</strong> Doesn’t <strong>Take</strong> a <strong>Vacation</strong> 2009 www.frac.org 1
National Participation<br />
Nationally in July 2008, an average of 2.9 million<br />
children participated each weekday in the Summer<br />
Nutrition Programs (i.e., the Summer <strong>Food</strong> Service<br />
Program <strong>and</strong> the National School Lunch Program<br />
combined).<br />
The number of low-income children who are<br />
receiving free <strong>and</strong> reduced-price lunch during the<br />
regular school year is an excellent indicator of the<br />
need for the Summer Nutrition Programs, so FRAC<br />
uses it as a benchmark to measure summer<br />
participation nationally <strong>and</strong> in the states. While the<br />
total number of children participating in Summer<br />
Nutrition grew by more than 49,000, or 1.7<br />
percent, from July 2007 to July 2008, the number<br />
of children enrolled in the regular year school lunch<br />
program grew faster so that the reach of Summer<br />
Nutrition decreased slightly. In July 2008, 17.3<br />
children received Summer Nutrition for every 100<br />
Simplified Summer <strong>Food</strong><br />
The summer of 2008 was the first year that all<br />
states <strong>and</strong> the District of Columbia operated<br />
under the Simplified Summer <strong>Food</strong> rules, which<br />
reduce administrative work for Summer <strong>Food</strong><br />
Service Program (SFSP) sponsors by eliminating<br />
unnecessary rules for tracking different<br />
categories of costs <strong>and</strong> thereby ensure that all<br />
sponsors received the maximum federal<br />
reimbursement available. Previously, only 26<br />
states were able to operate under the easier<br />
Simplified rules.<br />
The nationwide expansion of the Simplified<br />
rules gave an important boost to the Summer<br />
<strong>Food</strong> Service Program. Use of the SFSP grew by<br />
8 percent in 2008, while use of the NSLP<br />
program (which did not offer any reduction in<br />
administrative work) fell by 5.7 percent.<br />
Because SFSP was more attractive (both to<br />
schools operating the NSLP <strong>and</strong> new sponsors),<br />
the number of Summer <strong>Food</strong> sponsors grew by<br />
6.2 percent <strong>and</strong> the number of sites grew by 5<br />
percent. It is likely that the full potential of<br />
Simplified may have been diminished due to<br />
the rising fuel <strong>and</strong> food costs that occurred in<br />
the spring of 2008; according to state agencies,<br />
these higher costs had a negative impact on<br />
sponsors <strong>and</strong> sites in a number of states.<br />
Key Findings for 2008<br />
low-income students who received lunch in the<br />
2007-2008 school year, compared to a ratio of<br />
17.5:100 children in July 2007.<br />
Participation in the States<br />
The disparities in participation among the 50 states<br />
plus the District of Columbia are dramatic. Only 10<br />
states managed to reach at least one quarter of<br />
their low-income children in July 2008. The District<br />
of Columbia, followed by New Mexico, South<br />
Carolina, Nevada <strong>and</strong> New York had the highest<br />
rates for Summer Nutrition participation by lowincome<br />
children.<br />
Eleven states failed to even serve one-tenth of<br />
their low-income children through their Summer<br />
Nutrition Programs in 2008. Mississippi, Oklahoma,<br />
Kansas, Louisiana, <strong>and</strong> Colorado had the lowest<br />
rates for Summer Nutrition participation by lowincome<br />
children in July 2008.<br />
Children in Summer Nutrition in 2008 per<br />
100 Children in Free & Reduced-Price<br />
School-Year National School Lunch<br />
Program 2007-2008<br />
State Ratio<br />
Top 5 States<br />
District of Columbia 88.8<br />
New Mexico 34.6<br />
South Carolina 32.0<br />
Nevada 31.2<br />
New York 30.3<br />
Bottom 5 States<br />
Colorado 8.2<br />
Louisiana 8.1<br />
Kansas 6.8<br />
Oklahoma 4.6<br />
Mississippi 4.4<br />
For a full list of states see Table 1.<br />
The Cost of Low Participation<br />
Not only are states with low Summer Nutrition<br />
participation rates failing to provide for their lowincome<br />
children, they are missing out on the<br />
millions of dollars in federal funds that exist to<br />
provide healthy foods for these children. These<br />
<strong>Food</strong> <strong>Research</strong> <strong>and</strong> <strong>Action</strong> <strong>Center</strong> <strong>Hunger</strong> Doesn’t <strong>Take</strong> a <strong>Vacation</strong> 2009 www.frac.org 2
dollars also support summer programs for children<br />
<strong>and</strong> youth <strong>and</strong> can help stimulate the economy.<br />
To estimate the total dollars being forfeited by the<br />
states in unclaimed Summer Nutrition funding,<br />
FRAC uses a benchmark for the ratio of<br />
participation that states should be reaching. Based<br />
on the performance of the most effective states, if<br />
states commit the necessary effort <strong>and</strong> resources,<br />
the goal of serving 40 children Summer Nutrition<br />
for every 100 children receiving free <strong>and</strong> reducedprice<br />
lunches during the regular school year is<br />
eminently achievable. By calculating the additional<br />
number of children that would be fed by each state<br />
if this goal were met, <strong>and</strong> multiplying it by the<br />
federal reimbursement rate for the 22 weekdays in<br />
July 2008 (not counting the July 4 th holiday), an<br />
estimate of the federal funding lost by each state<br />
was calculated.<br />
Top Ten States in Lost Federal Funds<br />
(Amounts Foregone Because State Falls Short<br />
of Reaching 40 Children in the Summer<br />
Nutrition Programs per 100 Free & Reduced-<br />
Price Students in the Regular Year School<br />
Lunch Program)<br />
State<br />
Additional<br />
Children Dollars Lost<br />
Texas 630,303 $41,426,683<br />
California 269,794 $17,732,228<br />
Florida 233,551 $15,350,167<br />
Georgia 188,594 $12,395,365<br />
Illinois 154,808 $10,174,773<br />
Ohio 148,210 $9,741,074<br />
North Carolina 137,137 $9,013,302<br />
Michigan 125,618 $8,256,272<br />
Arizona 116,097 $7,630,456<br />
Louisiana 112,812 $7,414,576<br />
For a full list of states see Table 6.<br />
In July 2008 if every state had reached the goal of<br />
serving 40 children Summer Nutrition for every 100<br />
receiving free <strong>and</strong> reduced-price lunches during<br />
the 2007-2008 school year, an additional 3.8<br />
million children would have been fed each day, <strong>and</strong><br />
the states would have collected an additional $250<br />
million in child nutrition funding.<br />
While the losses were higher in states with larger<br />
populations (e.g. $41.4 million in Texas, $17.7<br />
million in California, $15.3 million in Florida, <strong>and</strong><br />
$12.4 million in Georgia), 18 states each lost more<br />
than $5 million in federal funding.<br />
Of course, the Summer Nutrition Programs are<br />
meant to be available throughout the entire<br />
summer recess—not just in the month of July.<br />
States are losing out on additional federal dollars<br />
due to low participation rates in June <strong>and</strong> August.<br />
Participation Throughout the Summer<br />
As children need to know they can eat a healthy<br />
meal every day, Summer Nutrition Programs<br />
should be available from the first day of summer<br />
vacation until the start of the new school year.<br />
Unfortunately, many summer food sites do not<br />
stay open for the entire summer break. This is<br />
often due to inadequate funding, labor restrictions,<br />
or limited programming. Therefore, participation<br />
rates fluctuate throughout the summer.<br />
In calculating the Summer Nutrition participation<br />
ratios used in this report, FRAC focuses on data<br />
from the month of July because it is the peak<br />
month for Summer Nutrition participation for most<br />
states. And as school schedules vary widely across<br />
the country, it is also the month when the vast<br />
majority of schools are closed.<br />
While not used in calculations for this report, it is<br />
important to note that 20 states have their peak<br />
participation in Summer Nutrition Programs during<br />
the month of June. Some states—Texas,<br />
Oklahoma, Missouri, Mississippi, Louisiana <strong>and</strong><br />
Arizona—served more than twice the number of<br />
SFSP meals in June as July (see Table 5). In every<br />
state the number of meals served in August<br />
dropped substantially.<br />
<strong>Food</strong> <strong>Research</strong> <strong>and</strong> <strong>Action</strong> <strong>Center</strong> <strong>Hunger</strong> Doesn’t <strong>Take</strong> a <strong>Vacation</strong> 2009 www.frac.org 3
Increasing Participation through Child Nutrition Reauthorization<br />
Participation in the Summer Nutrition Programs is<br />
too low—only one in six low-income children<br />
participates in the program. The low participation<br />
is not an accident. Reaching children in the<br />
summer is harder than during the regular school<br />
year, <strong>and</strong> over the years, the Summer Nutrition<br />
Programs have suffered a series of critical blows<br />
inflicted by Congress that have decreased the<br />
number of sponsors <strong>and</strong> sites, <strong>and</strong> made it harder<br />
to build momentum to improve children’s access to<br />
nutritious meals during the summer. These cuts<br />
include: lowering the reimbursement rates,<br />
reducing the number of communities that are<br />
eligible to participate, <strong>and</strong> eliminating start-up <strong>and</strong><br />
expansion funding.<br />
Congress now is in the process of reauthorizing all<br />
of the federal child nutrition programs, including<br />
the Summer Nutrition Programs. Reauthorization<br />
provides the opportunity to reverse previous cuts,<br />
build a stronger program, <strong>and</strong> make significant<br />
new investments in the Summer Nutrition<br />
Programs so that more low-income children have<br />
access to healthy food during summer vacation.<br />
The following recommendations should be included<br />
in reauthorization so that more low-income<br />
children have access to summer meals that stave<br />
off hunger, help reduce obesity, <strong>and</strong> draw children<br />
into educational <strong>and</strong> enrichment programs that<br />
keep them learning throughout the summer.<br />
Improve the Area Eligibility Test<br />
The best, easiest, <strong>and</strong> most frequently used way<br />
for a Summer Nutrition site to qualify for the<br />
program is through “area eligibility.” If a program<br />
is located in a low-income area, then the site can<br />
participate <strong>and</strong> receive federal reimbursements for<br />
all the children. The current definition for lowincome<br />
requires that 50 percent of the children in<br />
the area be eligible for free or reduced-price school<br />
meals, a test which excludes many communities<br />
with significant numbers of low-income children<br />
from participating.<br />
In fact, the 50 percent threshold keeps many<br />
federally-funded summer <strong>and</strong> afterschool programs<br />
from getting nutrition dollars. There is a 40 percent<br />
threshold in the 21 st Century Community Learning<br />
<strong>Center</strong>s program, which is the largest federal<br />
funding source for the underlying costs of summer<br />
<strong>and</strong> afterschool programs, as well as school-wide<br />
summer <strong>and</strong> afterschool programs funded through<br />
Title I.<br />
Since the Summer Nutrition Programs are intended<br />
to support exactly these types of education<br />
programs, the inconsistency is self-defeating <strong>and</strong> a<br />
classic example of lack of coordination <strong>and</strong> creation<br />
of unnecessary red tape. The Summer Nutrition<br />
Program threshold should be lowered to 40<br />
percent. Otherwise, important education dollars<br />
that should be used to provide better services <strong>and</strong><br />
reach more at-risk children will be spent on food.<br />
Or, if no food is provided during the educational<br />
<strong>and</strong> enrichment programs, children will be hungry<br />
<strong>and</strong> unable to benefit from the program.<br />
The current 50 percent area eligibility test is the<br />
most restrictive it has ever been. Prior to 1981, the<br />
threshold for Summer <strong>Food</strong> was 33 percent.<br />
Raising the threshold from 33 percent to 50<br />
percent made many communities with significant<br />
numbers of low-income children but without large<br />
enough concentrations of poverty ineligible for the<br />
Summer Nutrition Programs. The change caused<br />
participation to drop by 500,000 children, from<br />
1981 to 1982. Making a change in the opposite<br />
direction by lowering it to 40 percent would bring<br />
hundreds of thous<strong>and</strong>s of low-income children<br />
back into the program.<br />
Restore the Reimbursement Rates<br />
The Summer <strong>Food</strong> Service Program (SFSP)<br />
reimbursement rates were cut by 10 percent in<br />
1996, making it extremely difficult for SFSP<br />
sponsors to participate without losing money. A<br />
report by the U.S. Department of Agriculture on<br />
summer food found that 73 percent of sponsors<br />
expect to lose money operating SFSP. It is time to<br />
restore the reimbursement rates to their pre-1996<br />
levels, indexed to inflation.<br />
Provide Start-Up <strong>and</strong> Expansion Grants<br />
Start-up funds were available until 1996. They<br />
gave sponsors the resources necessary to begin<br />
<strong>and</strong> grow their programs. Without these dollars, it<br />
is extremely difficult to recruit new sponsors <strong>and</strong> to<br />
encourage current sponsor to serve additional<br />
sites, both of which are necessary in order to<br />
increase participation.<br />
<strong>Food</strong> <strong>Research</strong> <strong>and</strong> <strong>Action</strong> <strong>Center</strong> <strong>Hunger</strong> Doesn’t <strong>Take</strong> a <strong>Vacation</strong> 2009 www.frac.org 4
Provide Funding for Transportation Costs<br />
In rural areas, transportation is one of the biggest<br />
barriers to Summer Nutrition participation. Providing<br />
funding to get children to Summer Nutrition<br />
Programs that offer high quality educational <strong>and</strong><br />
enrichment activities is a vital way to support access<br />
in rural areas.<br />
Exp<strong>and</strong> the Year-Round Summer <strong>Food</strong> Pilot<br />
Many organizations that operate summer programs<br />
also provide high quality afterschool programming<br />
<strong>and</strong> afterschool nutrition during the school year.<br />
The last Child Nutrition Reauthorization included a<br />
pilot program that allows community-based<br />
programs in California to feed children year-round<br />
through the Summer <strong>Food</strong> Service Program. The<br />
pilot significantly reduces administrative work<br />
because organizations do not have to operate<br />
The Summer Nutrition Programs are meant to be a<br />
vital support for millions of struggling families, but<br />
nationally the programs serve only one in six of the<br />
low-income children who rely on school meals<br />
during the school year. Many of the program rules<br />
<strong>and</strong> its limited resources keep too many lowincome<br />
children from participating. To fix the<br />
Conclusion<br />
multiple child nutrition programs, each of which<br />
requires an application <strong>and</strong> has different<br />
programmatic rules. The reauthorization should<br />
exp<strong>and</strong> the pilot nationwide <strong>and</strong> strengthen it so<br />
that children can receive meals after school, on<br />
weekends, <strong>and</strong> during school holidays.<br />
Provide Performance Awards<br />
Summer Nutrition participation varies dramatically,<br />
with the top performing states serving at least one<br />
in three low-income children who eat lunch during<br />
the school year, <strong>and</strong> the lowest performing states<br />
serving fewer than one in 20. Providing<br />
performance awards to states that are doing the<br />
best job <strong>and</strong> are growing participation is an<br />
important way to encourage states to run strong<br />
Summer Nutrition Programs.<br />
Summer Nutrition Programs so that low-income<br />
children really do have access to nutritious meals<br />
<strong>and</strong> snacks during the summer months, Congress<br />
must use Child Nutrition Reauthorization as an<br />
opportunity to make the effective <strong>and</strong> proven<br />
policy changes outlined in this report.<br />
<strong>Food</strong> <strong>Research</strong> <strong>and</strong> <strong>Action</strong> <strong>Center</strong> <strong>Hunger</strong> Doesn’t <strong>Take</strong> a <strong>Vacation</strong> 2009 www.frac.org 5
T<br />
he data in this report are collected from the<br />
United States Department of Agriculture<br />
(USDA) <strong>and</strong> an annual survey of state child<br />
nutrition officials conducted by FRAC. This report<br />
does not include data for Summer Nutrition<br />
Programs or for regular school year lunch<br />
programs in Puerto Rico, Guam, the Virgin Isl<strong>and</strong>s,<br />
or Department of Defense schools.<br />
Due to rounding, totals in the tables may not add<br />
up to 100 percent.<br />
Summer <strong>Food</strong> Service Program (SFSP)<br />
USDA provided FRAC with the number of SFSP<br />
lunches served in each state. FRAC calculated each<br />
state’s July average daily lunch attendance in the<br />
SFSP by dividing the total number of SFSP lunches<br />
served by the total number of weekdays (excluding<br />
the Independence Day holiday) in July.<br />
FRAC does not include data for the months of June<br />
or August in the analysis because it is impossible to<br />
determine how many days of each month schools<br />
were actually closed for the summer recess. And<br />
because of the limits of the available USDA data, it<br />
is not possible to divide up National School Lunch<br />
Program data to determine if meals were served as<br />
part of the summer program or as part of the<br />
regular school year.<br />
The average daily lunch attendance numbers<br />
reported in this report are slightly different from<br />
the average daily participation numbers reported<br />
by USDA. FRAC’s revised measure allows<br />
consistent comparisons from state to state <strong>and</strong><br />
year to year. This measure is also more in line with<br />
the average daily lunch attendance numbers in the<br />
school year National School Lunch Program, as<br />
described below. The numbers of lunches served<br />
by state are from USDA.<br />
USDA does not report the number of sponsors or<br />
sites for June or August—it only reports these data<br />
for July of each year. USDA obtains the July<br />
numbers from the states <strong>and</strong> reports them as they<br />
receive them.<br />
For this report, FRAC gave states the opportunity<br />
to update the data on sponsors, sites, <strong>and</strong> total<br />
number of lunches for June, July, <strong>and</strong> August that<br />
FRAC obtained from USDA.<br />
Technical Notes<br />
National School Lunch Program<br />
Using data provided by USDA, FRAC calculated the<br />
school-year NSLP average daily low-income<br />
attendance for each state based on the number of<br />
free <strong>and</strong> reduced-price meals served from<br />
September through May.<br />
FRAC used the July average daily attendance<br />
figures for the NSLP as provided by USDA for the<br />
summertime NSLP participation data in the report.<br />
The NSLP numbers include the lunches served at<br />
summer school <strong>and</strong> through the NSLP Seamless<br />
Summer Option.<br />
Note that USDA calculates average daily<br />
participation in the NSLP by dividing the average<br />
daily lunch attendance by 0.927. This is to account<br />
for children who were absent from school on a<br />
particular day. FRAC’s School Breakfast Scorecard<br />
reports the NSLP average daily participation<br />
numbers—that is, including the 0.927 factor. To<br />
make the regular year NSLP numbers consistent<br />
with the summer food numbers, for which there is<br />
no analogous absenteeism factor, the <strong>Hunger</strong><br />
Doesn’t <strong>Take</strong> a <strong>Vacation</strong> 2009 report does not<br />
include the absenteeism factor. As a result, the<br />
NSLP numbers in this report do not match the<br />
NSLP numbers USDA publishes or FRAC’s in the<br />
School Breakfast Scorecard School Year 2007-<br />
2008.<br />
The Cost of Low Participation<br />
For each state, FRAC calculated the average daily<br />
number of children receiving Summer Nutrition for<br />
every 100 children receiving free or reduced-price<br />
lunches during the regular school year. FRAC<br />
calculated the number of additional children who<br />
would be reached if each state reached a 40 to<br />
100 ratio. FRAC then multiplied this unserved<br />
population by the reimbursement rate for 22 days<br />
(the number of weekdays in July 2008 not<br />
counting the July 4 th holiday) of SFSP lunches.<br />
FRAC assumed each meal is reimbursed at the<br />
lowest st<strong>and</strong>ard rate available.<br />
<strong>Food</strong> <strong>Research</strong> <strong>and</strong> <strong>Action</strong> <strong>Center</strong> <strong>Hunger</strong> Doesn’t <strong>Take</strong> a <strong>Vacation</strong> 2009 www.frac.org 6
State<br />
TABLE 1: Summer Nutrition Participation in July 2007 <strong>and</strong> July 2008 by State<br />
(Lunches in Summer <strong>Food</strong> Service Program (SFSP) <strong>and</strong> National School Lunch Program (NSLP)** Combined)<br />
Children in<br />
Summer<br />
Nutrition<br />
July 2007 Summer Nutrition<br />
Children in 06-<br />
07 School-<br />
Year NSLP*<br />
Children in<br />
Summer<br />
Nutrition per<br />
100 in 06-07<br />
School-Year<br />
NSLP* Rank<br />
Children in<br />
Summer<br />
Nutrition<br />
July 2008 Summer Nutrition<br />
Children in 07-<br />
08 School-<br />
Year NSLP*<br />
Children in<br />
Summer<br />
Nutrition per<br />
100 in 07-08<br />
School-Year<br />
NSLP* Rank<br />
Alabama 30,719 324,192 9.5 41 29,187 327,310 8.9 45 -5.0%<br />
Alaska 2,064 32,519 6.3 49 2,887 31,664 9.1 44 39.9%<br />
Arizona 37,689 378,732 10.0 38 41,617 394,285 10.6 39 10.4%<br />
Arkansas 18,524 209,310 8.9 42 21,618 214,219 10.1 40 16.7%<br />
California 622,090 2,032,893 30.6 4 588,175 2,144,923 27.4 7 -5.5%<br />
Colorado 14,785 180,349 8.2 46 15,008 184,112 8.2 47 1.5%<br />
Connecticut 34,304 131,977 26.0 10 33,434 132,985 25.1 10 -2.5%<br />
Delaware 8,244 38,294 21.5 13 11,593 40,478 28.6 6 40.6%<br />
District of Columbia 29,036 30,263 95.9 1 26,198 29,518 88.8 1 -9.8%<br />
Florida 157,978 926,719 17.0 21 153,673 968,060 15.9 24 -2.7%<br />
Georgia 95,956 705,967 13.6 31 100,473 722,667 13.9 29 4.7%<br />
Hawaii 6,216 44,255 14.0 29 10,623 44,366 23.9 12 70.9%<br />
Idaho 18,002 80,197 22.4 12 20,874 82,312 25.4 9 16.0%<br />
Illinois 108,304 653,483 16.6 22 109,852 661,651 16.6 22 1.4%<br />
Indiana 43,350 318,301 13.6 30 45,829 339,180 13.5 33 5.7%<br />
Iowa 11,255 133,213 8.4 45 11,512 136,472 8.4 46 2.3%<br />
Kansas 9,713 147,987 6.6 48 10,421 152,547 6.8 49 7.3%<br />
Kentucky 46,374 289,365 16.0 24 40,508 293,511 13.8 31 -12.6%<br />
Louisiana 29,593 349,034 8.5 44 28,689 353,752 8.1 48 -3.1%<br />
Maine 7,604 49,469 15.4 26 7,820 50,537 15.5 26 2.8%<br />
Maryl<strong>and</strong> 42,843 204,726 20.9 15 46,097 212,257 21.7 15 7.6%<br />
Massachusetts 48,026 225,483 21.3 14 47,715 230,129 20.7 17 -0.6%<br />
Michigan 58,023 459,684 12.6 34 62,425 470,108 13.3 34 7.6%<br />
Minnesota 27,629 209,479 13.2 32 28,249 215,137 13.1 35 2.2%<br />
Mississippi 13,860 279,621 5.0 50 12,400 279,534 4.4 51 -10.5%<br />
Missouri 49,246 300,976 16.4 23 51,743 304,384 17.0 21 5.1%<br />
Montana 4,839 37,596 12.9 33 5,763 39,187 14.7 28 19.1%<br />
Nebraska 8,886 92,699 9.6 40 8,802 95,131 9.3 43 -0.9%<br />
Nevada 37,054 111,803 33.1 3 36,202 116,012 31.2 4 -2.3%<br />
New Hampshire 4,303 30,466 14.1 28 4,319 31,531 13.7 32 0.4%<br />
New Jersey 62,390 305,132 20.4 17 69,043 313,939 22.0 13 10.7%<br />
New Mexico 50,907 145,440 35.0 2 50,873 146,881 34.6 2 -0.1%<br />
New York 314,011 1,054,083 29.8 5 320,544 1,059,276 30.3 5 2.1%<br />
North Carolina 79,500 538,470 14.8 27 81,267 546,008 14.9 27 2.2%<br />
North Dakota 2,204 25,453 8.7 43 2,459 25,796 9.5 41 11.6%<br />
Ohio 58,245 510,883 11.4 37 61,308 523,795 11.7 37 5.3%<br />
Oklahoma 12,498 252,776 4.9 51 11,720 253,177 4.6 50 -6.2%<br />
Oregon 34,254 172,750 19.8 19 36,349 177,323 20.5 18 6.1%<br />
Pennsylvania 124,611 482,420 25.8 11 121,937 492,438 24.8 11 -2.1%<br />
Rhode Isl<strong>and</strong> 12,566 42,673 29.4 6 7,520 47,814 15.7 25 -40.2%<br />
South Carolina 78,845 295,657 26.7 9 95,266 297,809 32.0 3 20.8%<br />
South Dakota 8,491 41,334 20.5 16 8,602 41,406 20.8 16 1.3%<br />
Tennessee 38,307 385,676 9.9 39 39,985 375,870 10.6 38 4.4%<br />
Texas 164,085 2,004,897 8.2 47 190,174 2,051,194 9.3 42 15.9%<br />
Utah 35,234 123,357 28.6 7 32,290 127,001 25.4 8 -8.4%<br />
Vermont 5,724 21,416 26.7 8 4,684 21,484 21.8 14 -18.2%<br />
Virginia 62,052 307,723 20.2 18 62,840 316,342 19.9 19 1.3%<br />
Washington 33,969 275,336 12.3 36 35,740 279,557 12.8 36 5.2%<br />
West Virginia 16,723 107,985 15.5 25 15,051 108,999 13.8 30 -10.0%<br />
Wisconsin 27,960 221,611 12.6 35 37,238 227,138 16.4 23 33.2%<br />
Wyoming 3,794 20,607 18.4 20 3,588 20,885 17.2 20 -5.4%<br />
United States 2,852,877 16,344,732 17.5 2,902,184 16,752,091 17.3 1.7%<br />
* School-Year NSLP numbers reflect free <strong>and</strong> reduced price lunch attendance in school-years 2006-2007 <strong>and</strong> 2007-2008, respectively.<br />
** National School Lunch Program July numbers reflect free <strong>and</strong> reduced price lunch attendance <strong>and</strong> include participation in the Seamless Summer Option.<br />
Percent<br />
Change in<br />
Summer<br />
Nutrition<br />
2007 to<br />
2008
TABLE 2: Change in Summer <strong>Food</strong> Service Program <strong>and</strong> National School Lunch Program Participation<br />
from July 2007 to July 2008, by State<br />
State<br />
Children in Summer <strong>Food</strong> Service Program Children in National School Lunch Program<br />
July 2007 July 2008<br />
Change 2007<br />
to 2008<br />
July 2007 July 2008<br />
Change 2007<br />
to 2008<br />
Alabama 20,187 19,323 -4.3% 10,532 9,863 -6.4%<br />
Alaska 846 1,815 114.7% 1,218 1,071 -12.0%<br />
Arizona 7,156 6,997 -2.2% 30,533 34,621 13.4%<br />
Arkansas 12,198 14,773 21.1% 6,326 6,845 8.2%<br />
California 90,786 107,738 18.7% 531,304 480,437 -9.6%<br />
Colorado 8,409 9,360 11.3% 6,376 5,649 -11.4%<br />
Connecticut 8,479 14,647 72.7% 25,826 18,787 -27.3%<br />
Delaware 6,978 10,287 47.4% 1,267 1,306 3.1%<br />
District of Columbia 26,925 23,744 -11.8% 2,111 2,454 16.3%<br />
Florida 93,716 131,441 40.3% 64,262 22,232 -65.4%<br />
Georgia 44,727 47,507 6.2% 51,229 52,966 3.4%<br />
Hawaii 3,306 3,072 -7.1% 2,910 7,551 159.5%<br />
Idaho 16,640 19,543 17.4% 1,362 1,331 -2.3%<br />
Illinois 58,600 55,737 -4.9% 49,704 54,115 8.9%<br />
Indiana 33,861 35,239 4.1% 9,489 10,590 11.6%<br />
Iowa 7,508 7,947 5.8% 3,746 3,565 -4.8%<br />
Kansas 7,867 8,590 9.2% 1,846 1,831 -0.8%<br />
Kentucky 41,741 36,136 -13.4% 4,633 4,372 -5.6%<br />
Louisiana 26,799 26,025 -2.9% 2,794 2,663 -4.7%<br />
Maine 6,943 7,223 4.0% 661 596 -9.8%<br />
Maryl<strong>and</strong> 38,417 42,542 10.7% 4,426 3,555 -19.7%<br />
Massachusetts 41,856 41,237 -1.5% 6,170 6,478 5.0%<br />
Michigan 39,111 42,244 8.0% 18,913 20,181 6.7%<br />
Minnesota 19,816 21,507 8.5% 7,812 6,743 -13.7%<br />
Mississippi 12,356 10,791 -12.7% 1,505 1,609 7.0%<br />
Missouri 23,983 26,619 11.0% 25,263 25,125 -0.5%<br />
Montana 4,269 5,243 22.8% 570 520 -8.7%<br />
Nebraska 4,837 6,781 40.2% 4,049 2,021 -50.1%<br />
Nevada 3,856 4,598 19.3% 33,199 31,604 -4.8%<br />
New Hampshire 3,353 3,567 6.4% 950 752 -20.8%<br />
New Jersey 40,023 48,454 21.1% 22,366 20,589 -7.9%<br />
New Mexico 32,017 35,701 11.5% 18,890 15,172 -19.7%<br />
New York 257,616 264,753 2.8% 56,395 55,791 -1.1%<br />
North Carolina 31,089 36,534 17.5% 48,412 44,733 -7.6%<br />
North Dakota 1,799 2,084 15.8% 405 375 -7.4%<br />
Ohio 48,730 50,080 2.8% 9,516 11,229 18.0%<br />
Oklahoma 10,679 10,050 -5.9% 1,819 1,670 -8.2%<br />
Oregon 27,230 31,721 16.5% 7,024 4,628 -34.1%<br />
Pennsylvania 73,924 71,313 -3.5% 50,687 50,623 -0.1%<br />
Rhode Isl<strong>and</strong> 10,256 5,596 -45.4% 2,310 1,925 -16.7%<br />
South Carolina 43,030 58,351 35.6% 35,815 36,915 3.1%<br />
South Dakota 2,896 3,596 24.2% 5,596 5,006 -10.5%<br />
Tennessee 28,151 28,474 1.1% 10,156 11,511 13.3%<br />
Texas 94,887 94,473 -0.4% 69,198 95,701 38.3%<br />
Utah 11,108 11,978 7.8% 24,125 20,312 -15.8%<br />
Vermont 3,620 2,529 -30.1% 2,104 2,155 2.4%<br />
Virginia 48,299 48,299 0.0% 13,753 14,541 5.7%<br />
Washington 27,015 28,732 6.4% 6,954 7,008 0.8%<br />
West Virginia 13,710 11,980 -12.6% 3,013 3,071 1.9%<br />
Wisconsin 24,588 33,374 35.7% 3,372 3,864 14.6%<br />
Wyoming 2,498 2,230 -10.7% 1,296 1,358 4.8%<br />
United States 1,548,688 1,672,574 8.0% 1,304,189 1,229,610 -5.7%
State<br />
TABLE 3: Summer <strong>Food</strong> Service Program (SFSP) Participation in July 2008 by State<br />
Children in SFSP,<br />
July 2008<br />
Children in 07-08<br />
School-Year NSLP*<br />
Children in SFSP per<br />
100 in 07-08 School-<br />
Year NSLP*<br />
Rank<br />
Percent SFSP Contributes<br />
to Summer Nutrition<br />
Participation<br />
Alabama 19,323 327,310 5.9 42 66.2%<br />
Alaska 1,815 31,664 8.5 32 62.9%<br />
Arizona 6,997 394,285 1.8 51 16.8%<br />
Arkansas 14,773 214,219 6.9 39 68.3%<br />
California 107,738 2,144,923 5.0 46 18.3%<br />
Colorado 9,360 184,112 5.1 45 62.4%<br />
Connecticut 14,647 132,985 11.0 21 43.8%<br />
Delaware 10,287 40,478 25.4 2 88.7%<br />
District of Columbia 23,744 29,518 80.4 1 90.6%<br />
Florida 131,441 968,060 13.6 15 85.5%<br />
Georgia 47,507 722,667 6.6 41 47.3%<br />
Hawaii 3,072 44,366 6.9 38 28.9%<br />
Idaho 19,543 82,312 23.7 5 93.6%<br />
Illinois 55,737 661,651 8.4 33 50.7%<br />
Indiana 35,239 339,180 10.4 24 76.9%<br />
Iowa 7,947 136,472 5.8 43 69.0%<br />
Kansas 8,590 152,547 5.6 44 82.4%<br />
Kentucky 36,136 293,511 12.3 17 89.2%<br />
Louisiana 26,025 353,752 7.4 36 90.7%<br />
Maine 7,223 50,537 14.3 14 92.4%<br />
Maryl<strong>and</strong> 42,542 212,257 20.0 6 92.3%<br />
Massachusetts 41,237 230,129 17.9 8 86.4%<br />
Michigan 42,244 470,108 9.0 29 67.7%<br />
Minnesota 21,507 215,137 10.0 26 76.1%<br />
Mississippi 10,791 279,534 3.9 50 87.0%<br />
Missouri 26,619 304,384 8.7 30 51.4%<br />
Montana 5,243 39,187 13.4 16 91.0%<br />
Nebraska 6,781 95,131 7.1 37 77.0%<br />
Nevada 4,598 116,012 4.0 49 12.7%<br />
New Hampshire 3,567 31,531 11.3 20 82.6%<br />
New Jersey 48,454 313,939 15.4 10 70.2%<br />
New Mexico 35,701 146,881 24.3 4 70.2%<br />
New York 264,753 1,059,276 25.0 3 82.6%<br />
North Carolina 36,534 546,008 6.7 40 45.0%<br />
North Dakota 2,084 25,796 8.1 34 84.8%<br />
Ohio 50,080 523,795 9.6 27 81.7%<br />
Oklahoma 10,050 253,177 4.0 48 85.8%<br />
Oregon 31,721 177,323 17.9 9 87.3%<br />
Pennsylvania 71,313 492,438 14.5 13 58.5%<br />
Rhode Isl<strong>and</strong> 5,596 47,814 11.7 19 74.4%<br />
South Carolina 58,351 297,809 19.6 7 61.3%<br />
South Dakota 3,596 41,406 8.7 31 41.8%<br />
Tennessee 28,474 375,870 7.6 35 71.2%<br />
Texas 94,473 2,051,194 4.6 47 49.7%<br />
Utah 11,978 127,001 9.4 28 37.1%<br />
Vermont 2,529 21,484 11.8 18 54.0%<br />
Virginia 48,299 316,342 15.3 11 76.9%<br />
Washington 28,732 279,557 10.3 25 80.4%<br />
West Virginia 11,980 108,999 11.0 22 79.6%<br />
Wisconsin 33,374 227,138 14.7 12 89.6%<br />
Wyoming 2,230 20,885 10.7 23 62.1%<br />
United States 1,672,574 16,752,091 10.0 57.6%<br />
* School-Year NSLP numbers reflect free <strong>and</strong> reduced-price lunch attendance in school-year 2007-2008.
TABLE 4: Change in Number of Summer <strong>Food</strong> Service Program Sponsors <strong>and</strong> Sites from July 2007 to July 2008, by State<br />
State<br />
Number of Sponsors Number of Sites<br />
July 2007 July 2008 Percent Change July 2007 July 2008 Percent Change<br />
Alabama 37 37 0.0% 536 483 -9.9%<br />
Alaska 20 25 25.0% 36 63 75.0%<br />
Arizona 34 34 0.0% 163 161 -1.2%<br />
Arkansas 75 106 41.3% 174 220 26.4%<br />
California 167 173 3.6% 1,450 1,417 -2.3%<br />
Colorado 47 54 14.9% 153 198 29.4%<br />
Connecticut 23 24 4.3% 144 225 56.3%<br />
Delaware 19 20 5.3% 413 310 -24.9%<br />
District of Columbia 19 16 -15.8% 404 329 -18.6%<br />
Florida 78 106 35.9% 1,744 2,556 46.6%<br />
Georgia 72 85 18.1% 1,211 1,441 19.0%<br />
Hawaii 23 22 -4.3% 109 102 -6.4%<br />
Idaho 66 65 -1.5% 214 228 6.5%<br />
Illinois 123 130 5.7% 1,286 1,196 -7.0%<br />
Indiana 130 130 0.0% 957 836 -12.6%<br />
Iowa 59 70 18.6% 185 210 13.5%<br />
Kansas 50 58 16.0% 185 216 16.8%<br />
Kentucky 151 90 -40.4% 2,007 1,200 -40.2%<br />
Louisiana 67 81 20.9% 387 479 23.8%<br />
Maine 50 53 6.0% 123 128 4.1%<br />
Maryl<strong>and</strong> 41 41 0.0% 587 877 49.4%<br />
Massachusetts 82 82 0.0% 795 812 2.1%<br />
Michigan 129 147 14.0% 849 870 2.5%<br />
Minnesota 44 71 61.4% 308 339 10.1%<br />
Mississippi 63 58 -7.9% 213 209 -1.9%<br />
Missouri 62 69 11.3% 445 505 13.5%<br />
Montana 51 54 5.9% 139 139 0.0%<br />
Nebraska 33 45 36.4% 93 190 104.3%<br />
Nevada 24 27 12.5% 78 87 11.5%<br />
New Hampshire 25 26 4.0% 90 93 3.3%<br />
New Jersey 88 89 1.1% 940 1,020 8.5%<br />
New Mexico 46 56 21.7% 561 665 18.5%<br />
New York 283 284 0.4% 2,549 2,595 1.8%<br />
North Carolina 77 87 13.0% 646 777 20.3%<br />
North Dakota 29 25 -13.8% 35 34 -2.9%<br />
Ohio 150 177 18.0% 1,242 1,404 13.0%<br />
Oklahoma 59 53 -10.2% 254 223 -12.2%<br />
Oregon 94 107 13.8% 448 545 21.7%<br />
Pennsylvania 222 227 2.3% 2,033 1,949 -4.1%<br />
Rhode Isl<strong>and</strong> 11 12 9.1% 157 145 -7.6%<br />
South Carolina 44 48 9.1% 1,021 1,021 0.0%<br />
South Dakota 18 24 33.3% 39 50 28.2%<br />
Tennessee 45 45 0.0% 1,000 968 -3.2%<br />
Texas 167 177 6.0% 1,694 1,909 12.7%<br />
Utah 10 15 50.0% 100 114 14.0%<br />
Vermont 28 32 14.3% 70 82 17.1%<br />
Virginia 115 116 0.9% 1,183 1,385 17.1%<br />
Washington 105 103 -1.9% 558 562 0.7%<br />
West Virginia 95 90 -5.3% 420 364 -13.3%<br />
Wisconsin 90 98 8.9% 431 475 10.2%<br />
Wyoming 14 16 14.3% 36 40 11.1%<br />
United States 3,654 3,880 6.2% 30,895 32,446 5.0%
TABLE 5: Number of Summer <strong>Food</strong> Service Program Lunches* Served in June, July, <strong>and</strong> August 2007 <strong>and</strong> 2008, by State<br />
State<br />
June 2007<br />
SFSP<br />
Lunches<br />
June 2008<br />
SFSP Lunches<br />
%<br />
Change<br />
July 2007<br />
SFSP Lunches<br />
July 2008<br />
SFSP<br />
Lunches<br />
%<br />
Change<br />
August 2007<br />
SFSP Lunches<br />
August 2008<br />
SFSP Lunches<br />
%<br />
Change<br />
Alabama 632,375 617,317 -2% 423,917 425,115 0% 6,172 1,668 -73%<br />
Alaska 23,669 38,443 62% 17,756 39,936 125% 6,543 13,143 101%<br />
Arizona 410,298 480,041 17% 150,278 153,927 2% 57,086 9,650 -83%<br />
Arkansas 280,717 325,508 16% 256,163 324,996 27% 38,980 61,569 58%<br />
California 540,239 2,041,066 278% 1,906,509 2,370,246 24% 732,014 666,875 -9%<br />
Colorado 285,235 246,205 -14% 176,594 205,912 17% 10,117 13,971 38%<br />
Connecticut 0 0 N/A 178,052 322,227 81% 46,187 59,084 28%<br />
Delaware 76,989 94,100 22% 146,534 226,323 54% 107,829 83,604 -22%<br />
District of Columbia 97,077 119,560 23% 565,432 522,372 -8% 200,546 165,871 -17%<br />
Florida 1,997,182 2,010,617 1% 1,968,033 2,891,696 47% 258,472 257,777 0%<br />
Georgia 1,209,936 1,202,954 -1% 939,265 1,045,148 11% 129,426 88,130 -32%<br />
Hawaii 72,409 79,138 9% 69,431 67,580 -3% 452 817 81%<br />
Idaho 387,453 436,751 13% 349,437 429,939 23% 153,397 155,850 2%<br />
Illinois 555,288 597,892 8% 1,230,594 1,226,223 0% 464,151 305,293 -34%<br />
Indiana 496,022 556,427 12% 711,072 775,260 9% 113,019 90,832 -20%<br />
Iowa 176,299 180,968 3% 157,678 174,831 11% 31,294 20,496 -35%<br />
Kansas 312,326 344,120 10% 165,204 188,972 14% 9,138 1,356 -85%<br />
Kentucky 1,107,964 961,670 -13% 876,565 794,993 -9% 42,174 47,260 12%<br />
Louisiana 934,696 1,187,896 27% 562,786 572,555 2% 161,423 128,272 -21%<br />
Maine 13,725 8,665 -37% 145,806 158,915 9% 36,376 36,375 0%<br />
Maryl<strong>and</strong> 185,555 211,379 14% 806,754 935,914 16% 149,726 151,093 1%<br />
Massachusetts 33,306 73,530 121% 878,967 907,220 3% 443,400 409,699 -8%<br />
Michigan 216,888 314,997 45% 821,324 929,368 13% 278,939 261,725 -6%<br />
Minnesota 213,541 264,553 24% 416,142 473,147 14% 84,276 92,513 10%<br />
Mississippi 811,689 799,188 -2% 259,468 237,393 -9% 652 456 -30%<br />
Missouri 1,201,889 1,567,657 30% 503,646 585,608 16% 69,032 69,043 0%<br />
Montana 87,281 82,235 -6% 89,658 115,350 29% 29,868 29,760 0%<br />
Nebraska 145,097 178,073 23% 101,587 149,184 47% 20,130 21,446 7%<br />
Nevada 58,929 79,609 35% 80,967 101,163 25% 44,041 47,665 8%<br />
New Hampshire 7,841 7,308 -7% 70,413 78,472 11% 40,207 38,679 -4%<br />
New Jersey 15,419 13,719 -11% 840,493 1,065,992 27% 507,251 429,634 -15%<br />
New Mexico 771,323 858,636 11% 672,349 785,425 17% 13,559 14,711 8%<br />
New York 283,718 147,655 -48% 5,409,932 5,824,568 8% 3,361,462 3,365,502 0%<br />
North Carolina 312,600 319,867 2% 652,863 803,746 23% 241,540 219,695 -9%<br />
North Dakota 58,961 60,040 2% 37,782 45,849 21% 10,823 10,248 -5%<br />
Ohio 695,840 729,460 5% 1,023,321 1,101,757 8% 328,477 363,244 11%<br />
Oklahoma 499,130 498,298 0% 224,260 221,105 -1% 17,101 13,984 -18%<br />
Oregon 195,171 207,835 6% 571,831 697,852 22% 290,449 217,229 -25%<br />
Pennsylvania 478,435 522,167 9% 1,552,394 1,568,891 1% 813,604 743,180 -9%<br />
Rhode Isl<strong>and</strong> 50,956 13,995 N/A 215,368 123,101 -43% 147,627 63,614 -57%<br />
South Carolina 995,763 1,176,510 18% 903,634 1,283,728 42% 293,919 390,628 33%<br />
South Dakota 60,245 74,991 24% 60,810 79,118 30% 27,210 32,436 19%<br />
Tennessee 897,860 942,900 5% 591,164 626,436 6% 23,110 18,882 -18%<br />
Texas 5,408,560 4,741,914 -12% 1,992,629 2,078,405 4% 492,975 898,459 82%<br />
Utah 286,363 286,529 0% 233,275 263,520 13% 90,128 82,806 -8%<br />
Vermont 1,233 10,546 755% 76,022 55,646 -27% 9,441 18,375 95%<br />
Virginia 176,943 310,196 75% 1,014,287 1,073,332 6% 398,353 363,124 -9%<br />
Washington 141,159 172,772 22% 567,315 632,095 11% 236,647 206,455 -13%<br />
West Virginia 85,457 89,867 5% 287,900 263,558 -8% 54,323 57,142 5%<br />
Wisconsin 193,006 195,357 1% 516,342 734,226 42% 197,870 180,817 -9%<br />
Wyoming 28,963 38,292 32% 52,454 49,050 -6% 18,672 14,832 -21%<br />
United States 24,209,020 26,519,413 10% 32,522,457 36,807,385 13% 11,339,608 11,034,969 -3%<br />
* Some states may serve lunches for a few days in June or August, but do not have data in those months. This is because sponsors are allowed, if they do not serve for<br />
more than 10 days in those months, to claim those lunches in July to reduce paperwork.
TABLE 6: Estimated Number of Children Participating <strong>and</strong> Additional Federal Payments in July 2008 Summer Nutrition, if States<br />
Served 40 Children per 100 Served in School Year National School Lunch Program<br />
State<br />
Children in Summer<br />
Nutrition (School<br />
Lunch* & Summer<br />
<strong>Food</strong> Combined),<br />
July 2008<br />
Children in<br />
Summer<br />
Nutrition per 100<br />
in 07-08 School-<br />
Year NSLP**<br />
Total Children Who<br />
Would Be in July<br />
Summer Nutrition if<br />
State Reached a Ratio of<br />
40 Children per 100 in<br />
School-Year NSLP**<br />
Additional Children<br />
Reached in July if State<br />
Reached a Ratio of 40<br />
Children per 100 in<br />
School-Year NSLP**<br />
Additional Federal<br />
Reimbursement if State<br />
Reached in July a Ratio<br />
of 40 Children per 100<br />
in School-Year NSLP***<br />
Alabama 29,187 8.9 130,924 101,737 $6,686,672<br />
Alaska 2,887 9.1 12,666 9,779 $642,722<br />
Arizona 41,617 10.6 157,714 116,097 $7,630,456<br />
Arkansas 21,618 10.1 85,687 64,070 $4,210,969<br />
California 588,175 27.4 857,969 269,794 $17,732,228<br />
Colorado 15,008 8.2 73,645 58,636 $3,853,875<br />
Connecticut 33,434 25.1 53,194 19,760 $1,298,739<br />
Delaware 11,593 28.6 16,191 4,598 $302,216<br />
District of Columbia 26,198 88.8 -- -- --<br />
Florida 153,673 15.9 387,224 233,551 $15,350,167<br />
Georgia 100,473 13.9 289,067 188,594 $12,395,365<br />
Hawaii 10,623 23.9 17,746 7,123 $468,159<br />
Idaho 20,874 25.4 32,925 12,051 $792,063<br />
Illinois 109,852 16.6 264,660 154,808 $10,174,773<br />
Indiana 45,829 13.5 135,672 89,843 $5,904,944<br />
Iowa 11,512 8.4 54,589 43,077 $2,831,245<br />
Kansas 10,421 6.8 61,019 50,598 $3,325,556<br />
Kentucky 40,508 13.8 117,405 76,897 $5,054,026<br />
Louisiana 28,689 8.1 141,501 112,812 $7,414,576<br />
Maine 7,820 15.5 20,215 12,395 $814,666<br />
Maryl<strong>and</strong> 46,097 21.7 84,903 38,806 $2,550,530<br />
Massachusetts 47,715 20.7 92,052 44,336 $2,914,015<br />
Michigan 62,425 13.3 188,043 125,618 $8,256,272<br />
Minnesota 28,249 13.1 86,055 57,805 $3,799,264<br />
Mississippi 12,400 4.4 111,813 99,413 $6,533,942<br />
Missouri 51,743 17.0 121,754 70,011 $4,601,441<br />
Montana 5,763 14.7 15,675 9,912 $651,435<br />
Nebraska 8,802 9.3 38,052 29,250 $1,922,453<br />
Nevada 36,202 31.2 46,405 10,202 $670,547<br />
New Hampshire 4,319 13.7 12,612 8,293 $545,072<br />
New Jersey 69,043 22.0 125,576 56,533 $3,715,620<br />
New Mexico 50,873 34.6 58,752 7,880 $517,888<br />
New York 320,544 30.3 423,711 103,167 $6,780,646<br />
North Carolina 81,267 14.9 218,403 137,137 $9,013,302<br />
North Dakota 2,459 9.5 10,318 7,859 $516,561<br />
Ohio 61,308 11.7 209,518 148,210 $9,741,074<br />
Oklahoma 11,720 4.6 101,271 89,551 $5,885,713<br />
Oregon 36,349 20.5 70,929 34,580 $2,272,802<br />
Pennsylvania 121,937 24.8 196,975 75,039 $4,931,910<br />
Rhode Isl<strong>and</strong> 7,520 15.7 19,126 11,605 $762,760<br />
South Carolina 95,266 32.0 119,124 23,857 $1,568,006<br />
South Dakota 8,602 20.8 16,562 7,960 $523,169<br />
Tennessee 39,985 10.6 150,348 110,362 $7,253,572<br />
Texas 190,174 9.3 820,478 630,303 $41,426,683<br />
Utah 32,290 25.4 50,801 18,511 $1,216,609<br />
Vermont 4,684 21.8 8,594 3,909 $256,933<br />
Virginia 62,840 19.9 126,537 63,697 $4,186,496<br />
Washington 35,740 12.8 111,823 76,083 $5,000,553<br />
West Virginia 15,051 13.8 43,600 28,549 $1,876,352<br />
Wisconsin 37,238 16.4 90,855 53,618 $3,524,022<br />
Wyoming 3,588 17.2 8,354 4,766 $313,260<br />
United States 2,902,184 17.3 6,700,836 3,798,653 $249,666,444<br />
* National School Lunch Program July numbers reflect free <strong>and</strong> reduced price lunch attendance <strong>and</strong> include participation in the Seamless Summer Option.<br />
** School-Year NSLP numbers reflect free <strong>and</strong> reduced price lunch attendance in school-year 2007-2008.<br />
*** This estimate is calculated assuming that the state's sponsors are reimbursed for each child each day only for lunch (not breakfast or a snack) <strong>and</strong> at the lowest rate<br />
for a SFSP lunch ($2.9875 per lunch). It also assumes that all participants are served for the full 22 weekdays in July 2008 (not counting the July 4th holiday).
State M<strong>and</strong>ate (M) State Funding ($) Reporting Requirement (R)<br />
Summer Nutrition Legislation by State<br />
Types of state summer nutrition legislation included in this table:<br />
State M<strong>and</strong>ate (M) – State law requiring that all or certain schools offer the Summer <strong>Food</strong> Service Program (SFSP)<br />
State Funding ($) – State funds for a purpose related to SFSP<br />
Reporting Requirement (R) – State law that state, schools or districts convene advisory group, <strong>and</strong>/or report<br />
participation or reasons for nonparticipation in SFSP<br />
STATE DETAILS<br />
Alabama NONE<br />
Alaska NONE<br />
Arizona NONE<br />
Arkansas NONE<br />
California $ Grants of up to $15,000 are available per school, on a competitive basis, up to the<br />
annual appropriation, for summer nutrition program or breakfast program start-up <strong>and</strong><br />
expansion expenses where 20 percent or more of students are approved for F&RP meals.<br />
In 2007-08, the state appropriated $1.017 million in grant funding. CAL. EDUC. CODE §<br />
49550.3.<br />
$<br />
During the 2007 summer, the state allocated $0.2195 in additional reimbursement for<br />
each free <strong>and</strong> reduced-price meal served by a school through NSLP, including those<br />
served under the Seamless Summer Option. During June 2008, the appropriation for this<br />
funding was exhausted, thus school districts received no additional reimbursement for<br />
meals served through NSLP or SSFO. CAL Ed Code § 49430.5.<br />
M Existing law requires all schools to offer meals to needy students during summer school.<br />
Recent legislation limited the allowable exemptions, which brought more schools under<br />
the m<strong>and</strong>ate. CAL Ed Code § 49548.<br />
Colorado NONE<br />
Connecticut NONE<br />
Delaware NONE<br />
District of<br />
Columbia<br />
$ NONE<br />
Florida M Each school district is required to sponsor a summer nutrition program that operates at<br />
least one site within 5 miles of at least one elementary school at which 50 percent or<br />
more of the students are free or reduced-price eligible, <strong>and</strong> at least one site within 10<br />
miles of every other elementary school in which 50 percent or more of the students are<br />
free or reduced-price eligible. Districts may only seek an exemption from the m<strong>and</strong>ate by<br />
voting on the issue at a school board meeting that provides the opportunity for public<br />
comment. The school board must reconsider each year. FLA. STAT. Ch 1006.0606.<br />
Georgia NONE<br />
Hawaii NONE<br />
Idaho NONE<br />
Illinois M Beginning the summer of 2008, all school districts (regardless of whether or not they<br />
already participate in a federal child nutrition program) must implement a summer<br />
breakfast <strong>and</strong>/or lunch program for the duration of the summer school program in all<br />
schools in which 50 percent or more of the student population is eligible for free or<br />
reduced-price meals AND that operate a summer school program. Public Act 095-0155,<br />
amended the Childhood <strong>Hunger</strong> Relief Act (105 ILCS 126/20).<br />
Indiana NONE<br />
Iowa NONE<br />
Kansas NONE<br />
Kentucky NONE<br />
<strong>Food</strong> <strong>Research</strong> <strong>and</strong> <strong>Action</strong> <strong>Center</strong> <strong>Hunger</strong> Doesn’t <strong>Take</strong> a <strong>Vacation</strong> 2008 www.frac.org
State M<strong>and</strong>ate (M) State Funding ($) Reporting Requirement (R)<br />
Louisiana NONE<br />
Maine NONE<br />
Maryl<strong>and</strong> M If the public school system operates summer school, it must provide a meal program<br />
(can be breakfast, lunch, or breakfast <strong>and</strong> lunch). MD. CODE ANN., EDUC. § 7-603,<br />
Massachusetts $ In total for 2008, $5,024,557 million total was allocated for breakfast <strong>and</strong> summer<br />
outreach, start up <strong>and</strong> expansion grants, <strong>and</strong> reimbursements. Of that, a minimum of<br />
$300,000 is allocated for SFSP outreach.<br />
Michigan NONE<br />
Minnesota $ State contributes $150,000 in additional funds for education department-approved SFSP<br />
sponsors to supplement federal reimbursement rates: up to 4 cents per breakfast, 14<br />
cents per lunch or supper, <strong>and</strong> 10 cents per snack. MINN. STAT. § 124D.119.<br />
Mississippi NONE<br />
Missouri M SFSP required in school districts where 50 percent or more of the children are eligible for<br />
free or reduced-price lunch <strong>and</strong> in service institutions where more than 40 children<br />
congregate; districts can request a waiver. MO. REV. STAT. §191.810.<br />
Montana NONE<br />
Nebraska NONE<br />
Nevada NONE<br />
New Hampshire NONE<br />
New Jersey NONE<br />
New Mexico NONE<br />
New York $ State allocates $3.3 million to SFSP sponsors to supplement all summer breakfasts,<br />
lunches, suppers <strong>and</strong> snacks claimed for federal funds. This allocation also provides a per<br />
meal rate for sponsors serving <strong>and</strong> claiming a fourth meal supplement.<br />
North Carolina<br />
In 2008, SFSP funding was reduced by six percent. The reduced amount resulted in<br />
$3,049,410 being distributed to SFSP sponsors.<br />
NONE<br />
North Dakota NONE<br />
Ohio M The governing body for each school that is required to provide student intervention<br />
programs during the summer months shall establish an extension of the School Breakfast<br />
Program <strong>and</strong> the National School Lunch Program or participate in the Summer <strong>Food</strong><br />
Service Program. Schools may opt out for financial reasons <strong>and</strong> ask for a waiver from<br />
the State Board of Education. If the governing board decides that it cannot comply, it<br />
shall communicate its decision to the residents of the district. OHIO REV. CODE ANN.<br />
3313.813; 3314.18.<br />
Oklahoma NONE<br />
Oregon $ State appropriates $150,000 for reimbursements for summer lunches. The Department of<br />
Education supplements the federal reimbursement with 5 cents per lunch served during<br />
the summer as part of SFSP or NSLP. OR STAT 327.527.<br />
Pennsylvania NONE<br />
Rhode Isl<strong>and</strong> NONE<br />
South Carolina NONE<br />
South Dakota NONE<br />
Tennessee NONE<br />
Texas M School districts are required to offer SFSP where more than 60 percent of children are<br />
eligible for free or reduced-price meals. TEX. HUM. RES. CODE § 33.024 (1993).<br />
Oversight of the Summer Nutrition Programs was transferred the Texas Department of<br />
Agriculture in 2007.<br />
Utah NONE<br />
Vermont $ The state allocated $51,387.00 for SFSP in 2007 <strong>and</strong> $50,873 in 2008. Sponsors can use<br />
the funds either as reimbursement supplements or for activities <strong>and</strong>/or transportation in<br />
order to promote the program. The Department of Education encourages sponsors to use<br />
the funds for activities <strong>and</strong>/or transportation. The state also allocated $48,550 to<br />
<strong>Food</strong> <strong>Research</strong> <strong>and</strong> <strong>Action</strong> <strong>Center</strong> <strong>Hunger</strong> Doesn’t <strong>Take</strong> a <strong>Vacation</strong> 2008 www.frac.org
State M<strong>and</strong>ate (M) State Funding ($) Reporting Requirement (R)<br />
Virginia<br />
Vermont Campaign to End Childhood <strong>Hunger</strong> for budget year 2007 – 2008.<br />
NONE<br />
Washington M If the public school district operates a summer program <strong>and</strong> fifty percent or more of the<br />
students enrolled in the school qualify for free or reduced-price meals, the school district<br />
must implement a summer food service program in each of the operating public schools.<br />
Sites providing the meals should be open to all children in the area unless a compelling<br />
case can be made to limit access to the program. Schools may be exempt from<br />
implementing the Summer <strong>Food</strong> Service Program if they can demonstrate the availability<br />
of an adequate alternative summer feeding program. WA. LEGIS 287 (2005)<br />
$<br />
State allocates $100,000 to support SFSP sponsors that participated during the previous<br />
summer. The funding is distributed based upon the proportion of the meals each sponsor<br />
served during the previous summer.<br />
$ For the summer of 2007 <strong>and</strong> 2008, state advanced $70,000 for grants for start up,<br />
expansion, equipment, or other costs.<br />
West Virginia NONE<br />
Wisconsin NONE<br />
Wyoming NONE<br />
<strong>Food</strong> <strong>Research</strong> <strong>and</strong> <strong>Action</strong> <strong>Center</strong> <strong>Hunger</strong> Doesn’t <strong>Take</strong> a <strong>Vacation</strong> 2008 www.frac.org


