School Breakfast -Making It Work in Large Districts - Food Research ...
School Breakfast -Making It Work in Large Districts - Food Research ...
School Breakfast -Making It Work in Large Districts - Food Research ...

Create successful ePaper yourself
Turn your PDF publications into a flip-book with our unique Google optimized e-Paper software.
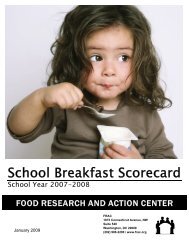
<strong>School</strong> <strong>Breakfast</strong>: <strong>Mak<strong>in</strong>g</strong> it <strong>Work</strong> <strong>in</strong> <strong>Large</strong> <strong>School</strong> <strong>Districts</strong><br />
<strong>School</strong> Year 2011-2012<br />
<strong>Food</strong> <strong>Research</strong> and Action Center | January 2013<br />
Executive Summary<br />
This report exam<strong>in</strong>es the performance of school breakfast programs <strong>in</strong> 57 large urban and suburban school districts<br />
dur<strong>in</strong>g the 2011–2012 school year, with the goal of monitor<strong>in</strong>g their progress <strong>in</strong> <strong>in</strong>creas<strong>in</strong>g school breakfast participation<br />
among low-<strong>in</strong>come students. Given the concentration of poverty with<strong>in</strong> the student population <strong>in</strong> most of the districts<br />
and the potential for economies of scale afforded by the large number of students, it is somewhat easier to reach<br />
children with breakfast <strong>in</strong> districts <strong>in</strong> large metropolitan areas than elsewhere. Yet almost half of these districts failed to<br />
reach a majority of the low-<strong>in</strong>come students who eat school lunch each day with the important morn<strong>in</strong>g nourishment<br />
they need to succeed <strong>in</strong> school.<br />
All seven districts that met FRAC’s goal of reach<strong>in</strong>g at least 70 low-<strong>in</strong>come children with breakfast through the <strong>School</strong><br />
<strong>Breakfast</strong> Program for every 100 low-<strong>in</strong>come children who received lunch through the National <strong>School</strong> Lunch Program<br />
had widespread breakfast <strong>in</strong> the classroom programs. These programs, where students eat breakfast <strong>in</strong> their classroom<br />
at the beg<strong>in</strong>n<strong>in</strong>g of the school day, are clearly the most effective strategy to get school breakfast to the large number of<br />
students who need it. <strong>It</strong> is especially effective for schools with high concentrations of free and reduced-price eligible<br />
students that can offer breakfast at no charge to all students.<br />
Key F<strong>in</strong>d<strong>in</strong>gs<br />
• The top 10 school districts served breakfast to two-thirds or more of the low-<strong>in</strong>come students that<br />
received school lunch each day. These districts all offer breakfast free to all or many students and all have<br />
breakfast <strong>in</strong> the classroom programs <strong>in</strong> at least one-third of their schools. Seven districts — Boise, ID,<br />
Charleston, SC, Detroit, MI, Houston, TX, Newark, NJ, San Antonio, TX, and Wash<strong>in</strong>gton, DC — achieved the<br />
goal of reach<strong>in</strong>g at least 70 low-<strong>in</strong>come children with breakfast for every 100 receiv<strong>in</strong>g lunch. If all 57 districts<br />
had reached this goal <strong>in</strong> the 2011–2012 school year, 667,734 additional children would have been eat<strong>in</strong>g a<br />
healthy school breakfast every day, and the districts comb<strong>in</strong>ed would have collected an additional $175 million <strong>in</strong><br />
federal child nutrition fund<strong>in</strong>g.<br />
• The bottom ten districts reached 40 or fewer low-<strong>in</strong>come children with breakfast for every 100<br />
with lunch. Some very large districts with high poverty levels were <strong>in</strong> this group. The five worst were:<br />
Brentwood (Long Island), NY, Elg<strong>in</strong>, IL, Guilford County (Greensboro), NC, Miami-Dade County, FL, and New<br />
York City, NY.
• Ten districts <strong>in</strong>creased low-<strong>in</strong>come breakfast participation by 20 percent or more <strong>in</strong> the 2011-<br />
2012 school year, compared to the previous year. Brentwood (Long Island), NY, Chicago, IL, Clark<br />
County (Las Vegas), NV, Little Rock, AR, and Orange County (Orlando), FL, had exceptional growth of more<br />
than 25 percent. These districts all implemented breakfast <strong>in</strong> the classroom programs dur<strong>in</strong>g the 2011-2012<br />
school year, result<strong>in</strong>g <strong>in</strong> many more children participat<strong>in</strong>g <strong>in</strong> the program each day.<br />
• <strong>Breakfast</strong> <strong>in</strong> the classroom programs, offered to all children at no charge, are now found <strong>in</strong> at<br />
least some schools <strong>in</strong> most of the school districts <strong>in</strong>cluded <strong>in</strong> this report. Forty-seven of the 57<br />
districts <strong>in</strong> this study had some type of alternative breakfast service method—where breakfast is offered after<br />
the school day beg<strong>in</strong>s—<strong>in</strong> at least some of their schools dur<strong>in</strong>g the 2011–2012 school year. Serv<strong>in</strong>g models<br />
<strong>in</strong>clude breakfast brought to classrooms and offered to children dur<strong>in</strong>g the first 10 m<strong>in</strong>utes of class, “grab and<br />
go” breakfast service from carts or kiosks set up <strong>in</strong> school hallways or cafeterias, and breakfast after first<br />
period <strong>in</strong> middle and high schools.<br />
• The new federal Community Eligibility Option – <strong>in</strong> seven states now and <strong>in</strong> all states beg<strong>in</strong>n<strong>in</strong>g <strong>in</strong><br />
the 2014-2015 school year – shows great promise of boost<strong>in</strong>g participation further. Detroit was<br />
one of the districts pilot<strong>in</strong>g Community Eligibility <strong>in</strong> 2011-2012, and experienced a 28.6 percent growth <strong>in</strong><br />
students eat<strong>in</strong>g lunch and 17.8 percent growth <strong>in</strong> students eat<strong>in</strong>g breakfast.<br />
013<br />
Acknowledgments<br />
Special thanks go to the participat<strong>in</strong>g school district nutrition directors and their staff. This report would not be<br />
possible without their responsiveness and will<strong>in</strong>gness to share their experiences with others. We also are grateful<br />
to state partners who provided data for this report—Maryland Hunger Solutions, Florida Impact, and Texas<br />
Hunger Initiative—and for assistance from the American Association of <strong>School</strong> Adm<strong>in</strong>istrators.<br />
This report was written by FRAC Senior Policy Analyst Madele<strong>in</strong>e Lev<strong>in</strong>.<br />
The <strong>Food</strong> <strong>Research</strong> and Action Center gratefully acknowledges major support of its work to expand and improve<br />
the <strong>School</strong> <strong>Breakfast</strong> Program <strong>in</strong> 2011–2012 from the follow<strong>in</strong>g:<br />
ConAgra <strong>Food</strong>s Foundation<br />
Kraft <strong>Food</strong>s Foundation<br />
National Dairy Council/Dairy Management, Inc.<br />
Newman’s Own Foundation<br />
Sara Lee Foundation<br />
Taste of the NFL<br />
Walmart Foundation<br />
Additional support for FRAC’s work on the federal child nutrition programs <strong>in</strong> 2011–2012 was provided by:<br />
Anonymous Donors<br />
Annie E. Casey Foundation<br />
The California Endowment<br />
CREDO/<strong>Work</strong><strong>in</strong>g Assets<br />
General Mills Foundation<br />
Robert Wood Johnson Foundation<br />
Kaiser Permanente<br />
About FRAC<br />
Kresge Foundation<br />
Land O’Lakes Foundation<br />
Leaves of Grass Fund<br />
MAZON: A Jewish Response to Hunger<br />
The Moriah Fund<br />
New Directions Foundation<br />
Open Society Foundations<br />
The <strong>Food</strong> <strong>Research</strong> and Action Center (FRAC) is the lead<strong>in</strong>g national organization work<strong>in</strong>g for more effective public and private<br />
policies to eradicate domestic hunger and undernutrition.<br />
For more <strong>in</strong>formation about FRAC, or to sign up for FRAC’s Weekly News Digest, go to: www.frac.org. For <strong>in</strong>formation about the <strong>School</strong><br />
<strong>Breakfast</strong> <strong>Food</strong> <strong>Research</strong> Program, and go Action to: http://bit.ly/sbprogram<br />
Center | <strong>School</strong> <strong>Breakfast</strong>: <strong>Mak<strong>in</strong>g</strong> <strong>It</strong> <strong>Work</strong> <strong>in</strong> <strong>Large</strong> <strong>School</strong> <strong>Districts</strong> 2
Introduction<br />
Effective school breakfast programs play an important role <strong>in</strong> ensur<strong>in</strong>g the food security of low-<strong>in</strong>come children,<br />
while also boost<strong>in</strong>g diets, support<strong>in</strong>g improved attendance, greater academic success, good student behavior,<br />
improved health, and reduced obesity rates. A full review of the positive effects of school breakfast can be found<br />
at www.frac.org. <strong>School</strong> breakfast provides an especially needed support to millions of struggl<strong>in</strong>g families, but<br />
with only half of low-<strong>in</strong>come children gett<strong>in</strong>g breakfast at school, too many children are miss<strong>in</strong>g out. Many of the<br />
children who do not eat breakfast start the school day unable to concentrate and not ready to learn.<br />
As schools prepare to implement new federal meal standards for breakfast <strong>in</strong> the 2013-2014 school year, it is<br />
more important than ever for them to <strong>in</strong>crease participation <strong>in</strong> their breakfast programs. That will mean more<br />
children benefitt<strong>in</strong>g from healthier food. <strong>School</strong>s with higher breakfast participation rates also will be better able<br />
to realize sav<strong>in</strong>gs from economies of scale both <strong>in</strong> food purchases and labor costs. Most schools can serve<br />
breakfast to many more children without experienc<strong>in</strong>g concomitant <strong>in</strong>creases <strong>in</strong> their costs for labor and<br />
equipment. Each breakfast served br<strong>in</strong>gs <strong>in</strong> federal dollars (and <strong>in</strong> some cases additional state fund<strong>in</strong>g and<br />
student payments). The additional revenue improves the f<strong>in</strong>ancial health of the schools’ nutrition programs and<br />
helps schools afford the somewhat higher costs of the healthier food required by the new regulations.<br />
This report focuses on breakfast participation rates – and strategies to <strong>in</strong>crease them – <strong>in</strong> large school districts<br />
with many low-<strong>in</strong>come students. <strong>It</strong> does so because of the great need and such districts’ unique position to<br />
benefit from economies of scale to <strong>in</strong>crease breakfast participation. The concentration of poverty <strong>in</strong> many of<br />
these districts dictates an especially important mission to ensure that children have access to adequate nutrition<br />
<strong>in</strong> order to learn, grow, and thrive. This report describes both the successes and the gaps <strong>in</strong> current efforts to<br />
reach more children with a healthy morn<strong>in</strong>g meal.<br />
How the <strong>School</strong> <strong>Breakfast</strong> Program <strong>Work</strong>s<br />
Who Operates the <strong>School</strong> <strong>Breakfast</strong> Program:<br />
Any public school, nonprofit private school or residential child care <strong>in</strong>stitution can participate <strong>in</strong> the <strong>School</strong> <strong>Breakfast</strong><br />
Program. The program is adm<strong>in</strong>istered at the federal level by the U.S. Department of Agriculture and <strong>in</strong> each state<br />
through the state Department of Education or Agriculture.<br />
Who can participate <strong>in</strong> the <strong>School</strong> <strong>Breakfast</strong> Program:<br />
Any student attend<strong>in</strong>g a school that offers the program can eat breakfast. Children from families with <strong>in</strong>comes at or<br />
below 130 percent of the federal poverty level are eligible for free school meals. Children from families with <strong>in</strong>comes<br />
between 130 and 185 percent of the federal poverty level qualify for reduced-price meals and can be charged no more<br />
than 30 cents per breakfast. Children from families with <strong>in</strong>comes above 185 percent of the federal poverty level pay<br />
charges (referred to as “paid meals”) which are set by the school, but schools receive a small federal reimbursement for<br />
such children.<br />
Most children are certified for free or reduced-price meals via applications collected by the school district each year.<br />
However, children <strong>in</strong> households participat<strong>in</strong>g <strong>in</strong> the Supplemental Nutrition Assistance Program (SNAP), Temporary<br />
Assistance for Needy Families (TANF), and <strong>Food</strong> Distribution Program on Indian Reservations (FDPIR), as well as foster<br />
youth, migrant, homeless, or runaway youth, and Head Start participants are “categorically eligible” (automatically<br />
eligible) for free school meals without the need for an application. <strong>School</strong> districts are required to “directly certify”<br />
children <strong>in</strong> SNAP participant households for free school meals through data match<strong>in</strong>g of SNAP records with school<br />
enrollment lists, and have the option of directly certify<strong>in</strong>g children <strong>in</strong> TANF and FDPIR households as well.<br />
How the <strong>School</strong> <strong>Breakfast</strong> Program is funded:<br />
The <strong>School</strong> <strong>Breakfast</strong> Program is funded by the federal government through per meal reimbursements. The amount the<br />
school is reimbursed for each meal depends on whether a student qualifies for free, reduced-price, or paid meals. For<br />
the 2011-2012 school year, schools received $1.51 per free breakfast, $1.21 per reduced-price breakfast, and $0.27 per<br />
paid breakfast. “Severe need” schools qualify for an additional 29 cents for each free or reduced-price breakfast served.<br />
<strong>School</strong>s are considered severe need if at least 40 percent of the lunches served dur<strong>in</strong>g the second preced<strong>in</strong>g school year<br />
were free or reduced-price.<br />
<strong>Food</strong> <strong>Research</strong> and Action Center | <strong>School</strong> <strong>Breakfast</strong>: <strong>Mak<strong>in</strong>g</strong> <strong>It</strong> <strong>Work</strong> <strong>in</strong> <strong>Large</strong> <strong>School</strong> <strong>Districts</strong> 3
Survey F<strong>in</strong>d<strong>in</strong>gs<br />
Student Enrollment and Low-Income Student Eligibility Rates<br />
The 57 districts that participated <strong>in</strong> this study ranged <strong>in</strong> size from 17,000 students to more than one million<br />
students dur<strong>in</strong>g the 2011–2012 school year. The districts respond<strong>in</strong>g to FRAC’s survey reported the percent of<br />
their student enrollment determ<strong>in</strong>ed to be eligible for free and reduced-price meals through the National <strong>School</strong><br />
Lunch Program. The same determ<strong>in</strong>ation applies to breakfast. Table 1 lists the participat<strong>in</strong>g districts’ reported<br />
student enrollment, and their reported enrollment of free and reduced-price eligible (i.e., low-<strong>in</strong>come) students,<br />
as well as a total comb<strong>in</strong>ed percentage of both free and reduced-price eligible students. These eligibility figures<br />
provide a snapshot of the relative level of poverty and nutritional need. The percentages varied from a low of 32<br />
percent comb<strong>in</strong>ed free and reduced-price eligible students <strong>in</strong> Montgomery County, MD to a high of nearly 100<br />
percent <strong>in</strong> Detroit, MI.<br />
<strong>Breakfast</strong> Participation<br />
For this report, FRAC calculated the number of low-<strong>in</strong>come students (i.e., those eligible for free or reduced-price<br />
school meals) eat<strong>in</strong>g breakfast and eat<strong>in</strong>g lunch each day (average daily participation, or ADP) <strong>in</strong> each district by<br />
divid<strong>in</strong>g the number of free and reduced-price breakfasts and lunches (respectively) served over the course of the<br />
school year by the number of days on which breakfast and lunch were served, as reported <strong>in</strong> the survey by each<br />
district. Table 2 provides data for each district on the average daily number of low-<strong>in</strong>come children participat<strong>in</strong>g<br />
<strong>in</strong> free or reduced-price breakfast and lunch for the 2011-2012 school year.<br />
FRAC also collected data on participation for the prior school year -- 2010-2011-- for 43 of the 57 districts. Table<br />
3 compares the average daily participation <strong>in</strong> breakfast of low-<strong>in</strong>come students for each district <strong>in</strong> the 2010-2011<br />
and 2011-2012 school years, and shows the percent change. Ten districts <strong>in</strong>creased low-<strong>in</strong>come breakfast<br />
participation by 20 percent or more. Brentwood (Long Island), NY, Chicago, IL, Clark County (Las Vegas), NV,<br />
Little Rock, AR, and Orange County (Orlando), FL had exceptional growth of more than 25 percent. These<br />
districts all were implement<strong>in</strong>g breakfast <strong>in</strong> the classroom programs dur<strong>in</strong>g the 2011-2012 school year, result<strong>in</strong>g<br />
<strong>in</strong> many more children participat<strong>in</strong>g <strong>in</strong> the program each day. (See below for more <strong>in</strong>formation on breakfast <strong>in</strong><br />
the classroom.)<br />
Top Ten <strong>Districts</strong>: Increase <strong>in</strong> Average Daily Participation (ADP)<br />
from <strong>School</strong> Year 2010-11 to <strong>School</strong> Year 2011-12<br />
District<br />
Low-Income<br />
<strong>Breakfast</strong><br />
ADP<br />
SY 2010-11<br />
Low-Income<br />
<strong>Breakfast</strong><br />
ADP<br />
SY 2011-12<br />
Percent<br />
Increase <strong>in</strong><br />
<strong>Breakfast</strong> ADP<br />
Brentwood, NY 1,982 3,268 64.9%<br />
Clark County, NV 38,108 55,643 46.0%<br />
Little Rock, AR 5,501 7,646 39.0%<br />
Orange County, FL 31,689 40,527 27.9%<br />
Chicago, IL 115,989 145,902 25.8%<br />
Elg<strong>in</strong>, IL 4,685 5,804 23.9%<br />
Fort Worth, TX 18,718 22,866 22.2%<br />
Denver, CO 13,772 16,813 22.1%<br />
Wake County, NC 16,101 19,490 21.0%<br />
Pr<strong>in</strong>ce Georges County, MD 23,809 28,583 20.0%<br />
<strong>Food</strong> <strong>Research</strong> and Action Center | <strong>School</strong> <strong>Breakfast</strong>: <strong>Mak<strong>in</strong>g</strong> <strong>It</strong> <strong>Work</strong> <strong>in</strong> <strong>Large</strong> <strong>School</strong> <strong>Districts</strong> 4
Effectiveness <strong>in</strong> Reach<strong>in</strong>g Low-Income Students with <strong>School</strong> <strong>Breakfast</strong><br />
FRAC uses free and reduced-price student participation <strong>in</strong> the National <strong>School</strong> Lunch Program as a benchmark<br />
aga<strong>in</strong>st which to measure low-<strong>in</strong>come student participation <strong>in</strong> the <strong>School</strong> <strong>Breakfast</strong> Program. Because there is<br />
broad participation <strong>in</strong> the lunch program by low-<strong>in</strong>come students <strong>in</strong> districts around the country, it is a fair<br />
measurement of how many students could and should be benefit<strong>in</strong>g from school breakfast each day. Nationally,<br />
for every 100 low-<strong>in</strong>come children who ate free or reduced-price lunch, 50.4 low-<strong>in</strong>come children ate free or<br />
reduced-price breakfast on an average day <strong>in</strong> the 2011-2012 school year 1 . In the six best perform<strong>in</strong>g states —the<br />
District of Columbia, Kentucky, New Mexico, South Carol<strong>in</strong>a, Vermont, and West Virg<strong>in</strong>ia – the ratio was 60:100<br />
or higher.<br />
A challeng<strong>in</strong>g, yet achievable, goal is to serve breakfast to at least 70 out of 100 low-<strong>in</strong>come students who eat<br />
school lunch. A number of states are now near<strong>in</strong>g this level of breakfast participation state-wide, and large<br />
districts can often do better: they have many low-<strong>in</strong>come students, more geographic concentration, and<br />
economies of scale coupled with <strong>in</strong>creased federal reimbursements for meals served. Most importantly,<br />
disproportionate numbers of poor children <strong>in</strong> many urban districts underscore the imperative to ensure that<br />
children have access to adequate nutrition.<br />
Table 4 ranks the districts <strong>in</strong> the report based on the ratio of low-<strong>in</strong>come students eat<strong>in</strong>g school breakfast<br />
compared to lunch <strong>in</strong> the 2011-2012 school year. Seven districts — Boise, ID, Charleston, SC, Detroit, MI,<br />
Houston, TX, Newark, NJ, San Antonio, TX, and Wash<strong>in</strong>gton, DC — met or exceeded the goal of 70 to 100 low<strong>in</strong>come<br />
student breakfast to lunch participation <strong>in</strong> the 2011-2012 school year. Twelve additional districts<br />
exceeded a breakfast to lunch ratio of 60:100 low-<strong>in</strong>come students. Altogether, 31 of the 57 districts <strong>in</strong> this study<br />
served breakfast to more than half of their low-<strong>in</strong>come students who received lunch each day, while 26 districts<br />
were below the national average of 50.4:100.<br />
Low-Income Students Participat<strong>in</strong>g <strong>in</strong> the <strong>School</strong> <strong>Breakfast</strong> Program (SBP) per 100<br />
<strong>in</strong> the National <strong>School</strong> Lunch Program (NSLP)<br />
Top 10 <strong>Districts</strong> Ratio Bottom 10 <strong>Districts</strong> Ratio<br />
Newark, NJ 92.8 Des Mo<strong>in</strong>es, IA 40.2<br />
Boise, ID 85.4 Knox County (Knoxville), TN 39.7<br />
Houston, TX 82.2 Toledo, OH 39.3<br />
Detroit, MI 79.5 Jefferson County, CO 39.0<br />
Charleston, SC 75.7 Oakland, CA 37.4<br />
Wash<strong>in</strong>gton, DC 72.2 Miami-Dade County, FL 37.1<br />
San Antonio, TX 70.5 Elg<strong>in</strong>, IL 35.4<br />
Boston, MA 69.2 New York City, NY 35.3<br />
Albuquerque, NM 69.0 Brentwood (Long Island), NY 33.5<br />
Atlanta, GA 68.7 Guilford County (Greensboro), NC 27.7<br />
For a full list of districts see Table 3<br />
1 See FRAC <strong>School</strong> <strong>Breakfast</strong> Scorecard, <strong>School</strong> Year 2011-2012; http://frac.org/reports-and-resources/publications-archives/#breakfast<br />
<strong>Food</strong> <strong>Research</strong> and Action Center | <strong>School</strong> <strong>Breakfast</strong>: <strong>Mak<strong>in</strong>g</strong> <strong>It</strong> <strong>Work</strong> <strong>in</strong> <strong>Large</strong> <strong>School</strong> <strong>Districts</strong> 5
Reach<strong>in</strong>g All Children Who Need <strong>School</strong> <strong>Breakfast</strong>:<br />
The Nutritional and Fiscal Benefits<br />
When children eat breakfast at school, it reduces hunger, absenteeism, tard<strong>in</strong>ess and nurse visits, and improves<br />
nutrition, learn<strong>in</strong>g and test scores. There is compell<strong>in</strong>g evidence that school breakfast improves children’s health,<br />
and may help prevent obesity. <strong>Research</strong> confirms that students <strong>in</strong> schools that offer school breakfast free to all<br />
children are more likely to eat a nutritionally substantive breakfast compared to students <strong>in</strong> schools with a<br />
traditional means-tested school breakfast program. These f<strong>in</strong>d<strong>in</strong>gs underscore the need to <strong>in</strong>crease school<br />
breakfast participation for districts that are committed to reduc<strong>in</strong>g obesity and improv<strong>in</strong>g student health and<br />
achievement. See FRAC’s <strong>Breakfast</strong> for Health for more <strong>in</strong>formation on the l<strong>in</strong>ks between school breakfast and<br />
favorable health outcomes.<br />
Missed school breakfast meals also add up to tens of millions of dollars <strong>in</strong> federal child nutrition fund<strong>in</strong>g go<strong>in</strong>g<br />
unclaimed by districts every year. Each school day <strong>in</strong> the 2011–2012 school year, schools lost at least $1.51 <strong>in</strong><br />
federal nutrition fund<strong>in</strong>g for every child who would have received a free breakfast and $1.21 for every child who<br />
would have received a reduced-price breakfast, but was not served. An additional 29 cents <strong>in</strong> federal funds per<br />
child per meal were forfeited if those low-<strong>in</strong>come children attended a “severe need” school—one of the thousands<br />
of schools <strong>in</strong> which at least 40 percent of lunches served the prior year were free or reduced-price.<br />
If each district <strong>in</strong> this survey had provided at least 70 low-<strong>in</strong>come children with breakfast (through the <strong>School</strong><br />
<strong>Breakfast</strong> Program) for every 100 low-<strong>in</strong>come children that received lunch (through the National <strong>School</strong> Lunch<br />
Program) <strong>in</strong> the 2011–2012 school year, an additional 667,486 students would have eaten a healthy school<br />
breakfast every day and the 57 districts would have received a comb<strong>in</strong>ed $175 million <strong>in</strong> additional child nutrition<br />
fund<strong>in</strong>g. Table 5 provides these data for each district <strong>in</strong> the report, arranged from the highest to lowest amount<br />
of dollars lost. Most of the lost revenue and unserved low-<strong>in</strong>come students are clustered <strong>in</strong> the largest districts,<br />
with over a quarter <strong>in</strong> New York City alone. The New York City Department of Education would have collected<br />
$50.3 million <strong>in</strong> additional federal funds, and served an additional 185,383 low-<strong>in</strong>come students, if it met the<br />
70:100 ratio. But 35 districts failed to collect at least $1 million, and <strong>in</strong> all districts fall<strong>in</strong>g short of the 70:100 ratio<br />
the unnecessary loss of federal breakfast dollars hurts schools and their budgets at the same time that the<br />
missed breakfast hurts children.<br />
Top Five <strong>Districts</strong> <strong>in</strong> Lost Federal Funds (Amounts Foregone<br />
Because District Failed to Reach 70 Free and Reduced-Price<br />
Students <strong>in</strong> the <strong>School</strong> <strong>Breakfast</strong> Program per 100 Such<br />
Students <strong>in</strong> the <strong>School</strong> Lunch Program)<br />
District<br />
Additional<br />
Students<br />
Dollars Lost<br />
New York City, NY 185,383 $50,341,750<br />
Miami-Dade County, FL 57,037 $14,368,573<br />
Los Angeles, CA 51,169 $13,464,107<br />
Clark County (Las Vegas), NV 33,426 $8,698,798<br />
Broward County, FL 28,396 $7,591,966<br />
For a full list of states see Table 4<br />
<strong>Food</strong> <strong>Research</strong> and Action Center | <strong>School</strong> <strong>Breakfast</strong>: <strong>Mak<strong>in</strong>g</strong> <strong>It</strong> <strong>Work</strong> <strong>in</strong> <strong>Large</strong> <strong>School</strong> <strong>Districts</strong> 6
Offer<strong>in</strong>g <strong>Breakfast</strong> Free to All Children<br />
and <strong>Breakfast</strong> <strong>in</strong> the Classroom<br />
All of the districts <strong>in</strong> this report have schools with significant concentrations of poverty. In such schools, federal<br />
program rules offer important options to help districts reach many more children with breakfast, <strong>in</strong>clud<strong>in</strong>g<br />
offer<strong>in</strong>g breakfast free to all children and mak<strong>in</strong>g breakfast part of the school day. The pace at which districts are<br />
able to implement these options depends on a range of factors: adm<strong>in</strong>istrative support, resources for start-up<br />
expenses, and buy-<strong>in</strong> from the school community (parents, pr<strong>in</strong>cipals, teachers, janitors, and other school<br />
support personnel). This section provides <strong>in</strong>formation about and exam<strong>in</strong>es the effectiveness of the school<br />
districts’ efforts to <strong>in</strong>crease breakfast participation through the implementation of such programs. Table 6<br />
summarizes the status of choices by district.<br />
Programs that offer meals at no charge to all students, regardless of <strong>in</strong>come (sometimes called “universal”), help<br />
reach more children. The traditional means-tested school breakfast served <strong>in</strong> the cafeteria before school (<strong>in</strong> which<br />
the higher-<strong>in</strong>come children pay) creates a sense among the children that the program is just “for poor kids.” (This<br />
is less true for lunch, at least through middle school, because typically all children go <strong>in</strong>to the cafeteria for lunch.)<br />
Serv<strong>in</strong>g breakfast free to everyone can be done <strong>in</strong> the cafeteria, but it also helps schools implement programs<br />
such as breakfast <strong>in</strong> the classroom or offer<strong>in</strong>g breakfast from “grab and go” carts <strong>in</strong> the hallways at the start of<br />
the school day. Of the school districts surveyed <strong>in</strong> this report, only three—Aust<strong>in</strong>, TX, Cypress-Fairbanks, TX, and<br />
Salt Lake City, UT —do not offer breakfast free to all students, regardless of <strong>in</strong>come, at some or all of their<br />
schools.<br />
The three most prevalent models for offer<strong>in</strong>g breakfast at no charge to all children <strong>in</strong> schools are “non-pric<strong>in</strong>g”,<br />
Community Eligibility and Provision 2. These models are expla<strong>in</strong>ed below.<br />
Non-Pric<strong>in</strong>g<br />
<strong>School</strong> districts can provide free breakfast to all students <strong>in</strong> one or all of their schools us<strong>in</strong>g the traditional<br />
approach of track<strong>in</strong>g which children eat and claim<strong>in</strong>g meals for federal reimbursement by fee category: free,<br />
reduced-price, and paid. The only difference <strong>in</strong> this model is that schools do not collect fees from families for<br />
reduced-price and paid meals. <strong>School</strong>s still must certify each child by fee category, track each child’s meals and<br />
fee status, and claim the meals served accord<strong>in</strong>gly. The federal options discussed below allow schools to reduce<br />
adm<strong>in</strong>istrative work and simplify the meal claim<strong>in</strong>g process, mak<strong>in</strong>g it more cost effective for them to offer<br />
breakfast at no charge.<br />
Community Eligibility<br />
Community Eligibility is the newest option for offer<strong>in</strong>g both breakfast and lunch at no charge to students <strong>in</strong><br />
schools with high percentages of low-<strong>in</strong>come students. Community Eligibility promises to significantly expand<br />
participation <strong>in</strong> the <strong>School</strong> <strong>Breakfast</strong> Program by elim<strong>in</strong>at<strong>in</strong>g application barriers for families and adm<strong>in</strong>istrative<br />
obstacles for school nutrition staff. <strong>It</strong> will be available to any school that chooses to participate and that has 40<br />
percent or more of its students certified for free meals without submitt<strong>in</strong>g a school meal application, which<br />
<strong>in</strong>cludes children who are directly certified (through data match<strong>in</strong>g) for free meals because they live <strong>in</strong><br />
households that participate <strong>in</strong> the Supplemental Nutrition Assistance Program (SNAP), Temporary Assistance for<br />
Needy Families (TANF), or the <strong>Food</strong> Distribution Program on Indian Reservations (FDPIR), as well as children who<br />
are automatically eligible for free school meals because of their status as be<strong>in</strong>g <strong>in</strong> foster care, Head Start,<br />
homeless, or migrant. Reimbursements are determ<strong>in</strong>ed by multiply<strong>in</strong>g the percentage of children qualified for free<br />
meals without submitt<strong>in</strong>g an application by 1.6 to determ<strong>in</strong>e the percent of meals eaten that will be reimbursed<br />
at the free rate. For example, a school with 50 percent of children qualified for free meals without an application<br />
would be reimbursed for 80 percent of the meals eaten at the free reimbursement rate and 20 percent at the<br />
paid rate.<br />
<strong>Food</strong> <strong>Research</strong> and Action Center | <strong>School</strong> <strong>Breakfast</strong>: <strong>Mak<strong>in</strong>g</strong> <strong>It</strong> <strong>Work</strong> <strong>in</strong> <strong>Large</strong> <strong>School</strong> <strong>Districts</strong> 7
Community Eligibility is be<strong>in</strong>g phased <strong>in</strong>. Ill<strong>in</strong>ois, Kentucky and Michigan implemented the new option <strong>in</strong> the 2011-<br />
2012 school year, and breakfast participation <strong>in</strong>creased among low-<strong>in</strong>come children <strong>in</strong> all three states at a higher<br />
rate than the 7.5 percent rate of the nation as a whole—up 15.9 percent <strong>in</strong> Ill<strong>in</strong>ois, 8.4 percent <strong>in</strong> Kentucky, and<br />
13.1 percent <strong>in</strong> Michigan 2 . The District of Columbia, New York, Ohio, and West Virg<strong>in</strong>ia were added <strong>in</strong> the 2012-<br />
2013 school year, and another four states will be added <strong>in</strong> the 2013-2014 school year. Community eligibility will<br />
be available nationwide beg<strong>in</strong>n<strong>in</strong>g <strong>in</strong> the 2014-2015 school year.<br />
Detroit Public <strong>School</strong>s is the only district <strong>in</strong> this report that implemented Community Eligibility <strong>in</strong> the 2011-12<br />
school year, and the impact there demonstrates the power of this option to <strong>in</strong>crease participation <strong>in</strong> both<br />
breakfast and lunch. Implemented district-wide, an additional 5,526 students participated <strong>in</strong> breakfast each day,<br />
a 17.8 percent <strong>in</strong>crease, with an even larger <strong>in</strong>crease <strong>in</strong> the number of additional students eat<strong>in</strong>g lunch each day–<br />
10,229 students or 28.6 percent. The breakfast <strong>in</strong>crease is smaller because the district had implemented a<br />
district-wide breakfast <strong>in</strong> the classroom program <strong>in</strong> the 2009-2010 school year, so that a high percentage of<br />
students already were participat<strong>in</strong>g <strong>in</strong> breakfast.<br />
Provision 2<br />
Of the 54 districts <strong>in</strong> this study that offer breakfast free to all children <strong>in</strong> all or many of their schools, 25 use<br />
“Provision 2” of the National <strong>School</strong> Lunch Act as a fund<strong>in</strong>g structure. Provision 2 enables schools to offer meals<br />
(breakfast and/or lunch) at no charge to all of their students, while reduc<strong>in</strong>g paperwork and adm<strong>in</strong>istrative costs.<br />
Under Provision 2, all students, regardless of <strong>in</strong>come, are offered free meals. <strong>School</strong>s collect applications for free<br />
and reduced-price meals only once every four years. The reimbursement rate for meals <strong>in</strong> all four years is based<br />
on the percentage of meals <strong>in</strong> the school that are served <strong>in</strong> each category (free, reduced-price, and paid) dur<strong>in</strong>g<br />
the “base year.” Provision 2 schools are responsible for the difference between the cost of serv<strong>in</strong>g meals at no<br />
charge to all students and the federal reimbursement for the meals. The <strong>in</strong>creased participation, result<strong>in</strong>g <strong>in</strong><br />
<strong>in</strong>creased federal reimbursement, and the significant adm<strong>in</strong>istrative sav<strong>in</strong>gs (e.g., fewer applications to process)<br />
associated with Provision 2 help offset all or much of the cost differential.<br />
Alternative Service Methods<br />
<strong>Breakfast</strong> <strong>in</strong> the Classroom: <strong>Food</strong> service staff packs breakfasts <strong>in</strong>to coolers or <strong>in</strong>sulated bags to be delivered to<br />
each classroom by school staff or designated students. Alternatively, schools can use a “grab and go” service model,<br />
described below, where students pick up breakfast meals and br<strong>in</strong>g them to their classroom. Students eat dur<strong>in</strong>g the<br />
first 10-15 m<strong>in</strong>utes of class dur<strong>in</strong>g morn<strong>in</strong>g announcements or while the teacher takes attendance or reviews lessons.<br />
Students clear trash and wipe down desks, and breakfast trash is placed <strong>in</strong> the hallway to be collected by custodial<br />
staff. Deliver<strong>in</strong>g breakfast to the classroom is ideal for lower grade levels where children start the day <strong>in</strong> the same<br />
classroom with the same teacher each day, mak<strong>in</strong>g delivery and meal count<strong>in</strong>g smoother for teachers and food service<br />
staff.<br />
“Grab and Go”: <strong>Food</strong> service staff packs breakfast meals <strong>in</strong> bags for student pick-up, or students select items and put<br />
them <strong>in</strong> bags themselves <strong>in</strong> the cafeteria or at kiosks <strong>in</strong> the hallway. Students select breakfast meals as they arrive at<br />
school and eat on the way to class or at their desks after the bell dur<strong>in</strong>g the first 10-15 m<strong>in</strong>utes of class. If eat<strong>in</strong>g <strong>in</strong> the<br />
classroom, students clear trash and wipe down desks, and breakfast trash is placed <strong>in</strong> the hallway to be collected by<br />
custodial staff. “Grab and Go” works well for schools that do not have the capacity to deliver food to each classroom or<br />
have <strong>in</strong>frastructure obstacles (e.g., multiple stories) that make delivery impracticable.<br />
<strong>Breakfast</strong> after First Period or “Second Chance <strong>Breakfast</strong>”: Students eat breakfast after first period dur<strong>in</strong>g a<br />
morn<strong>in</strong>g nutrition break. Depend<strong>in</strong>g on the model used, students can eat <strong>in</strong> the cafeteria (similar to traditional<br />
breakfast) or take a bagged meal from the cafeteria or kiosks <strong>in</strong> the hallway to be eaten <strong>in</strong> between classes or dur<strong>in</strong>g<br />
the next period. In the cafeteria, clean-up is similar to traditional before-school breakfast service. Second chance<br />
breakfast works particularly well for secondary schools because older students often are not hungry early <strong>in</strong> the<br />
morn<strong>in</strong>g and tend to arrive at school closer to the start of the school day.<br />
2 FRAC <strong>School</strong> <strong>Breakfast</strong> Scorecard, <strong>School</strong> Year 2011-2012; http://frac.org/reports-and-resources/publications-archives/#breakfast<br />
<strong>Food</strong> <strong>Research</strong> and Action Center | <strong>School</strong> <strong>Breakfast</strong>: <strong>Mak<strong>in</strong>g</strong> <strong>It</strong> <strong>Work</strong> <strong>in</strong> <strong>Large</strong> <strong>School</strong> <strong>Districts</strong> 8
<strong>Breakfast</strong> <strong>in</strong> the Classroom<br />
Forty-seven of the 57 districts <strong>in</strong> this study had some type of alternative breakfast service method—where<br />
breakfast is served after the school day beg<strong>in</strong>s—<strong>in</strong> at least some of their schools dur<strong>in</strong>g the 2011–2012 school<br />
year. <strong>Districts</strong> used a variety of methods, <strong>in</strong>clud<strong>in</strong>g breakfast <strong>in</strong> the classroom, “grab and go,” and breakfast after<br />
first period for middle and high school students. <strong>Breakfast</strong> <strong>in</strong> the classroom is especially prevalent <strong>in</strong> elementary<br />
schools. Whether delivered to the classroom or served from carts <strong>in</strong> the hallway, allow<strong>in</strong>g students to eat<br />
breakfast <strong>in</strong> the classroom dramatically <strong>in</strong>creases participation by mak<strong>in</strong>g it convenient and accessible to all. <strong>It</strong><br />
helps families whose early morn<strong>in</strong>g schedules make it difficult to fit <strong>in</strong> breakfast—either at home or <strong>in</strong> the<br />
cafeteria before school starts—due to long commutes and nontraditional work hours. Also, it elim<strong>in</strong>ates the<br />
problem caused by tight school bus schedules or school security l<strong>in</strong>es when students do not always arrive at<br />
school <strong>in</strong> time for breakfast before the first bell r<strong>in</strong>gs. Notably, districts with the widest implementation of<br />
breakfast <strong>in</strong> the classroom have the highest participation rates. And, the top ten districts have breakfast <strong>in</strong> the<br />
classroom programs <strong>in</strong> at least one-third of their schools. The practice of district-wide <strong>in</strong>-classroom breakfast<br />
programs has now spread beyond well-established programs <strong>in</strong> Detroit, MI, Houston, TX, Newark, NJ, and<br />
Wash<strong>in</strong>gton, DC, to Chicago, IL, Los Angeles, CA and most recently Dallas, TX.<br />
Partners for <strong>Breakfast</strong> <strong>in</strong> the Classroom Expands<br />
After a very successful <strong>in</strong>itial year work<strong>in</strong>g with five large districts, the Partners for <strong>Breakfast</strong> <strong>in</strong> the<br />
Classroom, funded by the Walmart Foundation, are work<strong>in</strong>g <strong>in</strong> ten additional districts. The Partners for<br />
<strong>Breakfast</strong> <strong>in</strong> the Classroom are the <strong>Food</strong> <strong>Research</strong> and Action Center, National Education Association Health<br />
Information Network, National Association of Elementary <strong>School</strong> Pr<strong>in</strong>cipals Foundation, and <strong>School</strong> Nutrition<br />
Foundation. The project provides school districts with fund<strong>in</strong>g for startup and equipment costs. Through a<br />
comprehensive tra<strong>in</strong><strong>in</strong>g, outreach, and promotional campaign, the Partners build support for breakfast <strong>in</strong> the<br />
classroom among teachers, pr<strong>in</strong>cipals, and other important community stakeholders.<br />
In the 2010-2011 school year, the Partners implemented the program <strong>in</strong> five large school districts: Dallas<br />
Independent <strong>School</strong> District (TX), Little Rock <strong>School</strong> District (AR), Memphis City <strong>School</strong>s (TN), Orange County<br />
Public <strong>School</strong>s (Orlando, FL), and Pr<strong>in</strong>ce George’s County Public <strong>School</strong>s (MD). All districts cont<strong>in</strong>ued to<br />
expand the program dur<strong>in</strong>g the 2011-2012 school year and saw significant growth.<br />
In the 2012-2013 school year, the Partners are work<strong>in</strong>g to implement breakfast <strong>in</strong> the classroom <strong>in</strong> ten new<br />
school districts <strong>in</strong>clud<strong>in</strong>g: Charleston County <strong>School</strong> District, SC, Denver Public <strong>School</strong>s, CO, Des Mo<strong>in</strong>es Public<br />
<strong>School</strong>s, IA, Elg<strong>in</strong> <strong>School</strong> District U-46, IL, Guilford County <strong>School</strong>s, NC, Jefferson County Public <strong>School</strong>s, KY,<br />
Kansas City Kansas Public <strong>School</strong>s, KS, and Knox County <strong>School</strong>s, TN. Two additional districts are yet to be<br />
f<strong>in</strong>alized.<br />
For more <strong>in</strong>formation see www.breakfast<strong>in</strong>theclassroom.org<br />
<strong>Food</strong> <strong>Research</strong> and Action Center | <strong>School</strong> <strong>Breakfast</strong>: <strong>Mak<strong>in</strong>g</strong> <strong>It</strong> <strong>Work</strong> <strong>in</strong> <strong>Large</strong> <strong>School</strong> <strong>Districts</strong> 9
<strong>Breakfast</strong> <strong>in</strong> the Classroom Successes<br />
Boise, Idaho<br />
Boise has achieved impressive results <strong>in</strong> its breakfast program through implementation of <strong>in</strong>novative service models<br />
<strong>in</strong> 41 of the 45 schools served by Boise schools’ <strong>Food</strong> and Nutrition Services. Twelve elementary schools offer<br />
breakfast <strong>in</strong> the classroom at no charge to all students, utiliz<strong>in</strong>g Provision 2. Peggy Bodnar, <strong>Food</strong> and Nutrition<br />
Services Supervisor, credits the convenience and tim<strong>in</strong>g of breakfast <strong>in</strong> the classroom with the significant <strong>in</strong>crease <strong>in</strong><br />
participation. She states, “Students and families are not dependent upon buses, when the school opens for students<br />
to come <strong>in</strong> and eat, or other variables that impact miss<strong>in</strong>g breakfast at school.” The district also offers several<br />
breakfast models <strong>in</strong> its secondary schools. Both junior high and senior high schools have breakfast before school<br />
starts <strong>in</strong> the cafeteria and then offer a “second chance breakfast” to students <strong>in</strong> the cafeteria dur<strong>in</strong>g a morn<strong>in</strong>g<br />
break, around 9:30 a.m. Two-thirds of the breakfasts are eaten dur<strong>in</strong>g the 10 to 15 m<strong>in</strong>ute break, so each school<br />
has multiple serv<strong>in</strong>g l<strong>in</strong>es to get students through quickly. <strong>Breakfast</strong>s are offered <strong>in</strong> a convenient “grab and go” style<br />
at the high schools. Bodnar concludes that “offer<strong>in</strong>g a range of serv<strong>in</strong>g times is a big part of our success.”<br />
Brentwood (Long Island), New York<br />
Brentwood Union Free <strong>School</strong> District <strong>in</strong> Suffolk County, Long Island <strong>in</strong>creased average daily participation <strong>in</strong><br />
breakfast among low-<strong>in</strong>come children by 65 percent <strong>in</strong> the 2011-2012 school year through implementation of<br />
breakfast <strong>in</strong> the classroom <strong>in</strong> elementary schools, and “grab and go” <strong>in</strong> middle and high schools. The<br />
implementation of alternative serv<strong>in</strong>g methods was supported by a grant from the Walmart Foundation through<br />
the American Association of <strong>School</strong> Adm<strong>in</strong>istrators, with additional support from New York Action for Healthy<br />
Kids, Children’s Defense Fund-New York, and Hunger Solutions New York. Call<strong>in</strong>g the <strong>in</strong>itiative “Br<strong>in</strong>g on<br />
<strong>Breakfast</strong> <strong>in</strong> Brentwood,” Super<strong>in</strong>tendent Joseph Bond and <strong>Food</strong> Service Director Nancy Padrone worked together<br />
to ensure that all key stakeholders—<strong>in</strong>clud<strong>in</strong>g pr<strong>in</strong>cipals, teachers, cafeteria workers, and custodians—understood<br />
at the beg<strong>in</strong>n<strong>in</strong>g of the <strong>in</strong>itiative the purpose of the changes <strong>in</strong> how breakfast was served and how those changes<br />
would positively affect the students. At the start of the 2011-2012 school year, the district had an average daily<br />
participation <strong>in</strong> breakfast of 13 percent of enrollment, but by the end of the year it was serv<strong>in</strong>g 39 percent of all<br />
students. Ten out of the district’s 17 schools serve alternative breakfast, with the other seven slated to start <strong>in</strong><br />
the 2012-2013 school year.<br />
Clark County (Las Vegas), Nevada<br />
<strong>Breakfast</strong> participation <strong>in</strong>creased a dramatic 46 percent <strong>in</strong> the Clark County <strong>School</strong> District with the implementation<br />
of a “breakfast after the bell” program <strong>in</strong> 78 high-poverty, Title I schools <strong>in</strong> the 2011-2012 school year. With<br />
leadership from new Super<strong>in</strong>tendent Dwight Jones and <strong>Food</strong> Services Director Charles Anderson, the district<br />
developed a program that ensures all children have the opportunity to eat a healthy breakfast at no charge as they<br />
start their school day. The district utilizes Provision 2 to ease adm<strong>in</strong>istrative burden and maximize efficiency <strong>in</strong> the<br />
program. In most of the schools, all students go to the cafeteria at the beg<strong>in</strong>n<strong>in</strong>g of the school day where they can<br />
eat breakfast before return<strong>in</strong>g to class; however, the district has adapted the program to fit the needs of different<br />
schools. For example, some schools allow students to take their meal back to the classroom. As a result, 17,535<br />
additional low-<strong>in</strong>come children received breakfast at school each day compared to the previous year.<br />
Little Rock, Arkansas<br />
Little Rock <strong>School</strong> District <strong>in</strong>creased average daily participation <strong>in</strong> breakfast by low-<strong>in</strong>come children by 39 percent <strong>in</strong><br />
the 2011-2012 school year through implementation of a breakfast <strong>in</strong> the classroom program supported by a grant<br />
from Walmart through the Partners for <strong>Breakfast</strong> <strong>in</strong> the Classroom Project (the Partners are the <strong>Food</strong> <strong>Research</strong> and<br />
Action Center, the National Association of Elementary <strong>School</strong> Pr<strong>in</strong>cipals Foundation, the National Education<br />
Association Health Information Network, and the <strong>School</strong> Nutrition Foundation). In Little Rock <strong>School</strong> District, the<br />
Partners worked <strong>in</strong> collaboration with <strong>Food</strong> Service Director Lilly Bouie and the Little Rock Classroom Teachers<br />
Association to implement breakfast <strong>in</strong> the classroom <strong>in</strong> 15 elementary schools. The Arkansas Association of<br />
Elementary Adm<strong>in</strong>istrators and the Arkansas Hunger Relief Alliance provided support for the effort. At the end of the<br />
2011-2012 school year, breakfast participation <strong>in</strong> the 15 schools had <strong>in</strong>creased dramatically to 77.5 percent of<br />
average daily attendance from 17 percent at the start of the 2010-2011 school year. The district plans to cont<strong>in</strong>ue<br />
expand<strong>in</strong>g the program to an additional eight schools <strong>in</strong> the 2012-2013 school year.<br />
<strong>Food</strong> <strong>Research</strong> and Action Center | <strong>School</strong> <strong>Breakfast</strong>: <strong>Mak<strong>in</strong>g</strong> <strong>It</strong> <strong>Work</strong> <strong>in</strong> <strong>Large</strong> <strong>School</strong> <strong>Districts</strong> 10
Conclusion<br />
<strong>School</strong> breakfast participation is grow<strong>in</strong>g, especially <strong>in</strong> school districts that offer breakfast <strong>in</strong> the classroom free to<br />
all students. With the spread of Community Eligibility, many more schools serv<strong>in</strong>g high concentrations of low<strong>in</strong>come<br />
students can offer school meals at no charge, mak<strong>in</strong>g it easier to move breakfast out of the cafeteria.<br />
Further, schools nationwide are work<strong>in</strong>g to <strong>in</strong>crease participation levels and efficiencies <strong>in</strong> their breakfast<br />
programs as they prepare to implement new federal meal standards for breakfast <strong>in</strong> the 2013-2014 and 2014-<br />
2015 school years. In addition to mak<strong>in</strong>g fiscal sense, higher participation levels benefit children and schools with<br />
positive outcomes—higher attendance, lower absenteeism, better health, reduced behavior problems, fewer visits<br />
to the school nurse, reduced obesity, and higher student achievement.<br />
<strong>Food</strong> <strong>Research</strong> and Action Center | <strong>School</strong> <strong>Breakfast</strong>: <strong>Mak<strong>in</strong>g</strong> <strong>It</strong> <strong>Work</strong> <strong>in</strong> <strong>Large</strong> <strong>School</strong> <strong>Districts</strong> 11
Table 1: Total Enrollment, Free and Reduced-Price <strong>School</strong> Meal Enrollment, and Percent of<br />
Students Determ<strong>in</strong>ed to be Eligible for Free and Reduced-Price Meals <strong>in</strong> SY 2011-12<br />
District<br />
Total<br />
Enrollment<br />
Free &<br />
Reduced-<br />
Price<br />
Enrollment*<br />
Percent<br />
Free &<br />
Reduced-<br />
Price<br />
Albuquerque Public <strong>School</strong>s (NM) 88,244 52,483 59.5%<br />
Atlanta Public <strong>School</strong>s (GA) 50,009 37,389 74.8%<br />
Aust<strong>in</strong> Independent <strong>School</strong> District (TX) 87,005 56,988 65.5%<br />
Baltimore City Public <strong>School</strong>s (MD) 85,484 71,297 83.4%<br />
Boise <strong>School</strong> District (ID) 23,128 10,272 44.4%<br />
Boston Public <strong>School</strong>s (MA) 51,980 44,764 86.1%<br />
Brentwood Union Free <strong>School</strong> District (NY) 17,010 13,744 80.8%<br />
Broward County <strong>School</strong>s (FL) 227,098 137,444 60.5%<br />
Charleston County <strong>School</strong> District (SC) 43,345 22,719 52.4%<br />
Chicago Public <strong>School</strong>s (IL) 376,424 318,216 84.5%<br />
C<strong>in</strong>c<strong>in</strong>nati Public <strong>School</strong>s (OH) 34,439 26,641 77.4%<br />
Clark County <strong>School</strong> District (NV) 314,839 180,274 57.3%<br />
Columbus City <strong>School</strong>s (OH) 50,483 40,621 80.5%<br />
Cypress-Fairbanks Independent <strong>School</strong> District (TX) 108,290 53,062 49.0%<br />
Dallas Independent <strong>School</strong> District (TX) 155,221 138,915 89.5%<br />
DeKalb County Public <strong>School</strong>s (GA) 97,121 69,774 71.8%<br />
Denver Public <strong>School</strong>s (CO) 77,066 53,893 69.9%<br />
Des Mo<strong>in</strong>es Public <strong>School</strong>s (IA) 30,763 20,561 66.8%<br />
Detroit Public <strong>School</strong>s (MI) 73,358 73,358** 100.0%**<br />
District of Columbia Public <strong>School</strong>s (DC) 44,679 30,783 68.8%<br />
Duval Public <strong>School</strong>s (FL) 155,389 85,962 55.3%<br />
Elg<strong>in</strong> <strong>School</strong> District (IL) 40,661 22,327 54.9%<br />
Fort Worth Independent <strong>School</strong> District (TX) 83,922 68,900 82.1%<br />
Fulton County <strong>School</strong>s (GA) 88,601 39,742 44.9%<br />
Guilford County <strong>School</strong>s (NC) 72,434 43,512 60.1%<br />
Hillsborough County <strong>School</strong>s (FL) 206,074 113,143 54.9%<br />
Houston Independent <strong>School</strong> District (TX) 194,837 158,958 81.6%<br />
Indianapolis Public <strong>School</strong>s (IN) 31,682 27,350 86.3%<br />
Irv<strong>in</strong>g Independent <strong>School</strong> District (TX) 36,483 29,369 80.5%<br />
Jeffco Public <strong>School</strong>s (CO) 81,273 27,079 33.3%<br />
Jefferson County Public <strong>School</strong>s (KY) 99,361 64,186 64.6%<br />
Kansas City Kansas <strong>School</strong>s (KS) 19,095 18,121 94.9%<br />
Knox County <strong>School</strong>s (TN) 58,512 33,345 57.0%<br />
Lee County <strong>School</strong>s (FL) 71,388 50,126 70.2%<br />
Little Rock <strong>School</strong> District (AR) 25,537 18,143 71.0%<br />
Long Beach Unified <strong>School</strong> District (CA) 83,779 59,640 71.2%<br />
Los Angeles Unified <strong>School</strong> District (CA) 609,259 480,665 78.9%<br />
Memphis City <strong>School</strong>s (TN) 107,450 92,551 86.1%<br />
<strong>Food</strong> <strong>Research</strong> and Action Center | <strong>School</strong> <strong>Breakfast</strong>: <strong>Mak<strong>in</strong>g</strong> <strong>It</strong> <strong>Work</strong> <strong>in</strong> <strong>Large</strong> <strong>School</strong> <strong>Districts</strong> 12
District<br />
Total<br />
Enrollment<br />
Free &<br />
Reduced-<br />
Price<br />
Enrollment*<br />
Percent<br />
Free &<br />
Reduced-<br />
Price<br />
Miami-Dade Public <strong>School</strong>s (FL) 315,816 230,237 72.9%<br />
Mesa Public <strong>School</strong>s (AZ) 65,192 37,827 58.0%<br />
Montgomery County <strong>School</strong>s (MD) 145,689 47,024 32.3%<br />
New York City Dept. of Education (NY) 1,113,000 741,000 66.6%<br />
Newark Public <strong>School</strong>s (NJ) 36,953 31,097 84.2%<br />
Oakland Unified <strong>School</strong> District (CA) 37,831 26,731 70.7%<br />
Omaha Public <strong>School</strong>s (NE) 47,940 36,097 75.3%<br />
Orange County <strong>School</strong>s (FL) 199,135 116,838 58.7%<br />
Philadelphia <strong>School</strong> District (PA) 154,875 120,647 77.9%<br />
P<strong>in</strong>ellas County <strong>School</strong>s (FL) 104,511 54,658 52.3%<br />
Portland Public <strong>School</strong>s (OR) 42,415 19,699 46.4%<br />
Pr<strong>in</strong>ce Georges County Public <strong>School</strong>s (MD) 124,820 71,506 57.3%<br />
Richmond City Public <strong>School</strong>s (VA) 22,369 17,138 76.6%<br />
Salt Lake City <strong>School</strong> District (UT) 26,502 15,981 60.3%<br />
San Antonio Independent <strong>School</strong> District (TX) 54,215 49,607 91.5%<br />
San Diego Unified <strong>School</strong> District (CA) 112,262 81,444 72.5%<br />
Syracuse City <strong>School</strong> District (NY) 19,370 17,242 89.0%<br />
Toledo Public <strong>School</strong>s (OH) 21,997 17,233 78.3%<br />
Wake County Public <strong>School</strong>s (NC) 146,478 52,726 36.0%<br />
*Students determ<strong>in</strong>ed to be eligible for free and reduced-price meals through direct certification or paper applications.<br />
** Detroit Public <strong>School</strong>s utilize the Community Eligibility Option, which allows them to claim all meals <strong>in</strong> the Free category.<br />
<strong>Food</strong> <strong>Research</strong> and Action Center | <strong>School</strong> <strong>Breakfast</strong>: <strong>Mak<strong>in</strong>g</strong> <strong>It</strong> <strong>Work</strong> <strong>in</strong> <strong>Large</strong> <strong>School</strong> <strong>Districts</strong> 13
Table 2: Average Daily Participation (ADP) for Low-Income Students <strong>in</strong><br />
Lunch and <strong>Breakfast</strong> and Ratio of Low-Income Students <strong>in</strong> <strong>School</strong> <strong>Breakfast</strong> (SBP)<br />
per 100 <strong>in</strong> <strong>School</strong> Lunch (NSLP) for SY 2011-2012<br />
District<br />
Free &<br />
Reduced-<br />
Price<br />
<strong>Breakfast</strong><br />
ADP<br />
Free &<br />
Reduced-<br />
Price<br />
Lunch<br />
ADP<br />
Ratio F & RP<br />
Students <strong>in</strong><br />
SBP per 100<br />
<strong>in</strong> NSLP<br />
Albuquerque Public <strong>School</strong>s (NM) 23,154 33,543 69.0 9<br />
Atlanta Public <strong>School</strong>s (GA) 19,528 28,429 68.7 10<br />
Aust<strong>in</strong> Independent <strong>School</strong> District (TX) 19,640 44,096 44.5 40<br />
Baltimore City Public <strong>School</strong>s (MD) 21,879 47,016 46.5 37<br />
Boise <strong>School</strong> District (ID) 6,373 7,461 85.4 2<br />
Boston Public <strong>School</strong>s (MA) 22,777 32,894 69.2 8<br />
Brentwood Union Free <strong>School</strong> District (NY) 3,268 9,769 33.5 56<br />
Broward County <strong>School</strong>s (FL) 42,598 101,419 42.0 45<br />
Charleston County <strong>School</strong> District (SC) 13,792 18,211 75.7 5<br />
Chicago Public <strong>School</strong>s (IL) 145,902 240,532 60.7 18<br />
C<strong>in</strong>c<strong>in</strong>nati Public <strong>School</strong>s (OH) 11,477 17,487 65.6 12<br />
Clark County <strong>School</strong> District (NV) 55,643 127,241 43.7 41<br />
Columbus City <strong>School</strong>s (OH) 20,878 31,470 66.3 11<br />
Cypress- Fairbanks Independent <strong>School</strong> District (TX) 22,606 41,684 54.2 28<br />
Dallas Independent <strong>School</strong> District (TX) 48,057 106,625 45.1 39<br />
DeKalb County Public <strong>School</strong>s (GA) 26,226 61,739 42.5 44<br />
Denver Public <strong>School</strong>s (CO) 16,813 39,570 42.5 43<br />
Des Mo<strong>in</strong>es Public <strong>School</strong>s (IA) 6,169 15,343 40.2 48<br />
Detroit Public <strong>School</strong>s (MI) 36,551 45,957 79.5 4<br />
District of Columbia Public <strong>School</strong>s (DC) 11,865 16,435 72.2 6<br />
Duval Public <strong>School</strong>s (FL) 26,815 45,607 58.8 22<br />
Elg<strong>in</strong> <strong>School</strong> District (IL) 5,804 16,414 35.4 54<br />
Fort Worth Independent <strong>School</strong> District (TX) 22,866 53,161 43.0 42<br />
Fulton County <strong>School</strong>s (GA) 17,323 31,307 55.3 27<br />
Guilford County <strong>School</strong>s (NC) 9,687 34,982 27.7 57<br />
Hillsborough County <strong>School</strong>s (FL) 50,829 87,937 57.8 25<br />
Houston Independent <strong>School</strong> District (TX) 96,709 117,696 82.2 3<br />
Indianapolis Public <strong>School</strong>s (IN) 13,800 22,969 60.1 19<br />
Irv<strong>in</strong>g Independent <strong>School</strong> District (TX) 14,822 23,329 63.5 15<br />
Jeffco Public <strong>School</strong>s (CO) 6,487 16,647 39.0 51<br />
Jefferson County Public <strong>School</strong>s (KY) 28,865 49,618 58.2 24<br />
Kansas City Kansas <strong>School</strong>s (KS) 6,649 13,402 49.6 32<br />
Knox County <strong>School</strong>s (TN) 8,449 21,261 39.7 49<br />
Lee County <strong>School</strong>s (FL) 23,317 39,744 58.7 23<br />
Little Rock <strong>School</strong> District (AR) 7,646 12,867 59.4 21<br />
Long Beach Unified <strong>School</strong> District (CA) 18,336 39,792 46.1 38<br />
Los Angeles Unified <strong>School</strong> District (CA) 152,328 290,711 52.4 31<br />
Memphis City <strong>School</strong>s (TN) 41,577 65,291 63.7 14<br />
Rank<br />
Among<br />
<strong>Districts</strong><br />
<strong>in</strong> Study<br />
<strong>Food</strong> <strong>Research</strong> and Action Center | <strong>School</strong> <strong>Breakfast</strong>: <strong>Mak<strong>in</strong>g</strong> <strong>It</strong> <strong>Work</strong> <strong>in</strong> <strong>Large</strong> <strong>School</strong> <strong>Districts</strong> 14
District<br />
Free &<br />
Reduced-<br />
Price<br />
<strong>Breakfast</strong><br />
ADP<br />
Free &<br />
Reduced-<br />
Price<br />
Lunch<br />
ADP<br />
Ratio F & RP<br />
Students <strong>in</strong><br />
SBP per 100<br />
<strong>in</strong> NSLP<br />
Mesa Public <strong>School</strong>s (AZ) 15,550 33,236 46.8 36<br />
Miami-Dade Public <strong>School</strong>s (FL) 64,212 173,212 37.1 53<br />
Montgomery County <strong>School</strong>s (MD) 17,363 35,219 49.3 33<br />
New York City Dept. of Education (NY) 188,525 534,153 35.3 55<br />
Newark Public <strong>School</strong>s (NJ) 23,947 25,801 92.8 1<br />
Oakland Unified <strong>School</strong> District (CA) 7,030 18,797 37.4 52<br />
Omaha Public <strong>School</strong>s (NE) 14,049 26,340 53.3 29<br />
Orange County <strong>School</strong>s (FL) 40,527 84,327 48.1 35<br />
Philadelphia <strong>School</strong> District (PA) 51,044 85,729 59.5 20<br />
P<strong>in</strong>ellas County <strong>School</strong>s (FL) 16,144 38,745 41.7 46<br />
Portland Public <strong>School</strong>s (OR) 8,097 14,260 56.8 26<br />
Pr<strong>in</strong>ce Georges County Public <strong>School</strong>s (MD) 28,583 54,266 52.7 30<br />
Richmond City Public <strong>School</strong>s (VA) 6,578 10,680 61.6 17<br />
Salt Lake City <strong>School</strong> District (UT) 5,183 12,742 40.7 47<br />
San Antonio Independent <strong>School</strong> District (TX) 30,217 42,835 70.5 7<br />
San Diego Unified <strong>School</strong> District (CA) 38,677 60,137 64.3 13<br />
Syracuse City <strong>School</strong> District (NY) 7,667 12,092 63.4 16<br />
Toledo Public <strong>School</strong>s (OH) 5,039 12,834 39.3 50<br />
Wake County Public <strong>School</strong>s (NC) 19,490 39,989 48.7 34<br />
Rank<br />
Among<br />
<strong>Districts</strong><br />
<strong>in</strong> Study<br />
<strong>Food</strong> <strong>Research</strong> and Action Center | <strong>School</strong> <strong>Breakfast</strong>: <strong>Mak<strong>in</strong>g</strong> <strong>It</strong> <strong>Work</strong> <strong>in</strong> <strong>Large</strong> <strong>School</strong> <strong>Districts</strong> 15
Table 3: Average Daily Participation (ADP) for Low-Income Students <strong>in</strong><br />
<strong>Breakfast</strong> for SY 2010-2011 and SY 2011-2012, and Percent Change<br />
District<br />
Free &<br />
Reduced-<br />
Price<br />
<strong>Breakfast</strong><br />
ADP SY<br />
2010-11<br />
Free &<br />
Reduced-<br />
Price<br />
<strong>Breakfast</strong><br />
ADP SY<br />
2011-12<br />
Albuquerque Public <strong>School</strong>s (NM) 22,633 23,154 2.3%<br />
Atlanta Public <strong>School</strong>s (GA) 18,266 19,528 6.9%<br />
Aust<strong>in</strong> Independent <strong>School</strong> District (TX) 19,885 19,640 -1.2%<br />
Baltimore City Public <strong>School</strong>s (MD) 20,868 21,879 4.8%<br />
Boise <strong>School</strong> District (ID) N/A 6,373 N/A<br />
Boston Public <strong>School</strong>s (MA) 20,544 22,777 10.9%<br />
Brentwood Union Free <strong>School</strong> District (NY) 1,982 3,268 64.9%<br />
Broward County <strong>School</strong>s (FL) N/A 42,598 N/A<br />
Charleston County <strong>School</strong> District (SC) N/A 13,792 N/A<br />
Chicago Public <strong>School</strong>s (IL) 115,989 145,902 25.8%<br />
C<strong>in</strong>c<strong>in</strong>nati Public <strong>School</strong>s (OH) 10,894 11,477 5.4%<br />
Clark County <strong>School</strong> District (NV) 38,108 55,643 46.0%<br />
Columbus City <strong>School</strong>s (OH) 19,771 20,878 5.6%<br />
Cypress- Fairbanks Independent <strong>School</strong> District (TX) 21,265 22,606 6.3%<br />
Dallas Independent <strong>School</strong> District (TX) 40,558 48,057 18.5%<br />
DeKalb County Public <strong>School</strong>s (GA) 24,896 26,226 5.3%<br />
Denver Public <strong>School</strong>s (CO) 13,772 16,813 22.1%<br />
Des Mo<strong>in</strong>es Public <strong>School</strong>s (IA) 6,002 6,169 2.8%<br />
Detroit Public <strong>School</strong>s (MI) 31,025 36,551 17.8%<br />
District of Columbia Public <strong>School</strong>s (DC) 12,093 11,865 -1.9%<br />
Duval Public <strong>School</strong>s (FL) N/A 26,815 N/A<br />
Elg<strong>in</strong> <strong>School</strong> District (IL) 4,685 5,804 23.9%<br />
Fort Worth Independent <strong>School</strong> District (TX) 18,718 22,866 22.2%<br />
Fulton County <strong>School</strong>s (GA) 16,489 17,323 5.1%<br />
Guilford County <strong>School</strong>s (NC) N/A 9,687 N/A<br />
Hillsborough County <strong>School</strong>s (FL) N/A 50,829 N/A<br />
Houston Independent <strong>School</strong> District (TX) 96,202 96,709 0.5%<br />
Indianapolis Public <strong>School</strong>s (IN) 13,304 13,800 3.7%<br />
Irv<strong>in</strong>g Independent <strong>School</strong> District (TX) 14,026 14,822 5.7%<br />
Jeffco Public <strong>School</strong>s (CO) N/A 6,487 N/A<br />
Jefferson County Public <strong>School</strong>s (KY) 27,122 28,865 6.4%<br />
Kansas City Kansas <strong>School</strong>s (KS) 6,212 6,649 7.0%<br />
Knox County <strong>School</strong>s (TN) N/A 8,449 N/A<br />
Lee County <strong>School</strong>s (FL) 23,011 23,317 1.3%<br />
Little Rock <strong>School</strong> District (AR) 5,501 7,646 39.0%<br />
Long Beach Unified <strong>School</strong> District (CA) N/A 18,336 N/A<br />
Los Angeles Unified <strong>School</strong> District (CA) 168,780 152,328 -9.7%<br />
Memphis City <strong>School</strong>s (TN) 38,983 41,577 6.7%<br />
Mesa Public <strong>School</strong>s (AZ) N/A 15,550 N/A<br />
Percent<br />
Change <strong>in</strong><br />
F & RP SBP<br />
ADP<br />
<strong>Food</strong> <strong>Research</strong> and Action Center | <strong>School</strong> <strong>Breakfast</strong>: <strong>Mak<strong>in</strong>g</strong> <strong>It</strong> <strong>Work</strong> <strong>in</strong> <strong>Large</strong> <strong>School</strong> <strong>Districts</strong> 16
District<br />
Free &<br />
Reduced-<br />
Price<br />
<strong>Breakfast</strong><br />
ADP SY<br />
2010-11<br />
Free &<br />
Reduced-<br />
Price<br />
<strong>Breakfast</strong><br />
ADP SY<br />
2011-12<br />
Miami-Dade Public <strong>School</strong>s (FL) 62,487 64,212 2.8%<br />
Montgomery County <strong>School</strong>s (MD) 14,892 17,363 16.6%<br />
New York City Dept. of Education (NY) 182,320 188,525 3.4%<br />
Newark Public <strong>School</strong>s (NJ) 20,894 23,947 14.6%<br />
Oakland Unified <strong>School</strong> District (CA) 6,308 7,030 11.4%<br />
Omaha Public <strong>School</strong>s (NE) 13,545 14,049 3.7%<br />
Orange County <strong>School</strong>s (FL) 31,689 40,527 27.9%<br />
Philadelphia <strong>School</strong> District (PA) 52,990 51,044 -3.7%<br />
P<strong>in</strong>ellas County <strong>School</strong>s (FL) N/A 16,144 N/A<br />
Portland Public <strong>School</strong>s (OR) 7,753 8,097 4.4%<br />
Pr<strong>in</strong>ce Georges County Public <strong>School</strong>s (MD) 23,809 28,583 20.0%<br />
Richmond City Public <strong>School</strong>s (VA) N/A 6,578 N/A<br />
Salt Lake City <strong>School</strong> District (UT) 5,220 5,183 -0.7%<br />
San Antonio Independent <strong>School</strong> District (TX) 31,124 30,217 -2.9%<br />
San Diego Unified <strong>School</strong> District (CA) 41,720 38,677 -7.3%<br />
Syracuse City <strong>School</strong> District (NY) N/A 7,667 N/A<br />
Toledo Public <strong>School</strong>s (OH) N/A 5,039 N/A<br />
Wake County Public <strong>School</strong>s (NC) 16,101 19,490 21.0%<br />
Percent<br />
Change <strong>in</strong><br />
F & RP SBP<br />
ADP<br />
<strong>Food</strong> <strong>Research</strong> and Action Center | <strong>School</strong> <strong>Breakfast</strong>: <strong>Mak<strong>in</strong>g</strong> <strong>It</strong> <strong>Work</strong> <strong>in</strong> <strong>Large</strong> <strong>School</strong> <strong>Districts</strong> 17
Table 4: District Effectiveness <strong>in</strong> Reach<strong>in</strong>g Low-Income Students with <strong>School</strong> <strong>Breakfast</strong><br />
(SBP) as Ratio to <strong>School</strong> Lunch (NSLP) Participation <strong>in</strong> <strong>School</strong> Year 2011-2012<br />
RATIO<br />
F & RP Rank<br />
District<br />
Students <strong>in</strong> Among<br />
SBP per 100 <strong>in</strong> <strong>Districts</strong> <strong>in</strong><br />
NSLP<br />
Study<br />
Newark Public <strong>School</strong>s (NJ) 92.8 1<br />
Boise <strong>School</strong> District (ID) 85.4 2<br />
Houston Independent <strong>School</strong> District (TX) 82.2 3<br />
Detroit Public <strong>School</strong>s (MI) 79.5 4<br />
Charleston County <strong>School</strong> District (SC) 75.7 5<br />
District of Columbia Public <strong>School</strong>s (DC) 72.2 6<br />
San Antonio Independent <strong>School</strong> District (TX) 70.5 7<br />
Boston Public <strong>School</strong>s (MA) 69.2 8<br />
Albuquerque Public <strong>School</strong>s (NM) 69.0 9<br />
Atlanta Public <strong>School</strong>s (GA) 68.7 10<br />
Columbus City <strong>School</strong>s (OH) 66.3 11<br />
C<strong>in</strong>c<strong>in</strong>nati Public <strong>School</strong>s (OH) 65.6 12<br />
San Diego Unified <strong>School</strong> District (CA) 64.3 13<br />
Memphis City <strong>School</strong>s (TN) 63.7 14<br />
Irv<strong>in</strong>g Independent <strong>School</strong> District (TX) 63.5 15<br />
Syracuse City <strong>School</strong> District (NY) 63.4 16<br />
Richmond City Public <strong>School</strong>s (VA) 61.6 17<br />
Chicago Public <strong>School</strong>s (IL) 60.7 18<br />
Indianapolis Public <strong>School</strong>s (IN) 60.1 19<br />
Philadelphia <strong>School</strong> District (PA) 59.5 20<br />
Little Rock <strong>School</strong> District (AR) 59.4 21<br />
Duval Public <strong>School</strong>s (FL) 58.8 22<br />
Lee County <strong>School</strong>s (FL) 58.7 23<br />
Jefferson County Public <strong>School</strong>s (KY) 58.2 24<br />
Hillsborough County <strong>School</strong>s (FL) 57.8 25<br />
Portland Public <strong>School</strong>s (OR) 56.8 26<br />
Fulton County <strong>School</strong>s (GA) 55.3 27<br />
Cypress- Fairbanks Independent <strong>School</strong> District (TX) 54.2 28<br />
Omaha Public <strong>School</strong>s (NE) 53.3 29<br />
Pr<strong>in</strong>ce Georges County Public <strong>School</strong>s (MD) 52.6 30<br />
Los Angeles Unified <strong>School</strong> District (CA) 52.4 31<br />
Kansas City Kansas <strong>School</strong>s (KS) 49.6 32<br />
Montgomery County <strong>School</strong>s (MD) 49.3 33<br />
Wake County Public <strong>School</strong>s (NC) 48.7 34<br />
Orange County <strong>School</strong>s (FL) 48.1 35<br />
Mesa Public <strong>School</strong>s (AZ) 46.8 36<br />
Baltimore City Public <strong>School</strong>s (MD) 46.5 37<br />
Long Beach Unified <strong>School</strong> District (CA) 46.1 38<br />
Dallas Independent <strong>School</strong> District (TX) 45.1 39<br />
<strong>Food</strong> <strong>Research</strong> and Action Center | <strong>School</strong> <strong>Breakfast</strong>: <strong>Mak<strong>in</strong>g</strong> <strong>It</strong> <strong>Work</strong> <strong>in</strong> <strong>Large</strong> <strong>School</strong> <strong>Districts</strong> 18
RATIO<br />
F & RP Rank<br />
District<br />
Students <strong>in</strong> Among<br />
SBP per 100 <strong>in</strong> <strong>Districts</strong> <strong>in</strong><br />
NSLP<br />
Study<br />
Aust<strong>in</strong> Independent <strong>School</strong> District (TX) 44.5 40<br />
Clark County <strong>School</strong> District (NV) 43.7 41<br />
Fort Worth Independent <strong>School</strong> District (TX) 43.0 42<br />
Denver Public <strong>School</strong>s (CO) 42.5 43<br />
DeKalb County Public <strong>School</strong>s (GA) 42.5 44<br />
Broward County <strong>School</strong>s (FL) 42.0 45<br />
P<strong>in</strong>ellas County <strong>School</strong>s (FL) 41.7 46<br />
Salt Lake City <strong>School</strong> District (UT) 40.7 47<br />
Des Mo<strong>in</strong>es Public <strong>School</strong>s (IA) 40.2 48<br />
Knox County <strong>School</strong>s (TN) 39.7 49<br />
Toledo Public <strong>School</strong>s (OH) 39.3 50<br />
Jeffco Public <strong>School</strong>s (CO) 39.0 51<br />
Oakland Unified <strong>School</strong> District (CA) 37.4 52<br />
Miami-Dade Public <strong>School</strong>s (FL) 37.1 53<br />
Elg<strong>in</strong> <strong>School</strong> District (IL) 35.4 54<br />
New York City Dept. of Education (NY) 35.3 55<br />
Brentwood Union Free <strong>School</strong> District (NY) 33.5 56<br />
Guilford County <strong>School</strong>s (NC) 27.7 57<br />
<strong>Food</strong> <strong>Research</strong> and Action Center | <strong>School</strong> <strong>Breakfast</strong>: <strong>Mak<strong>in</strong>g</strong> <strong>It</strong> <strong>Work</strong> <strong>in</strong> <strong>Large</strong> <strong>School</strong> <strong>Districts</strong> 19
Table 5: <strong>School</strong> <strong>Districts</strong>’ Additional Fund<strong>in</strong>g and Participation if 70 Low-Income Students<br />
Were Served <strong>School</strong> <strong>Breakfast</strong> Per 100 Served <strong>School</strong> Lunch<br />
District<br />
Additional Low-<br />
Income<br />
Students <strong>in</strong><br />
<strong>Breakfast</strong> if 70<br />
per 100 <strong>in</strong> Lunch<br />
Additional Federal<br />
Fund<strong>in</strong>g if 70 Low-<br />
Income <strong>Breakfast</strong><br />
Students per 100<br />
Receiv<strong>in</strong>g Lunch<br />
Albuquerque Public <strong>School</strong>s (NM) 326 $85,003.56<br />
Atlanta Public <strong>School</strong>s (GA) 372 $102,274.87<br />
Aust<strong>in</strong> Independent <strong>School</strong> District (TX) 11,227 $2,819,506.63<br />
Baltimore City Public <strong>School</strong>s (MD) 11,032 $2,765,551.72<br />
Boise <strong>School</strong> District (ID) * *<br />
Boston Public <strong>School</strong>s (MA) 249 $66,884.07<br />
Brentwood Union Free <strong>School</strong> District (NY) 3,570 $915,913.85<br />
Broward County <strong>School</strong>s (FL) 28,396 $7,591,966.26<br />
Charleston County <strong>School</strong> District (SC) * *<br />
Chicago Public <strong>School</strong>s (IL) 22,470 $5,708,958.65<br />
C<strong>in</strong>c<strong>in</strong>nati Public <strong>School</strong>s (OH) 763 $208,334.01<br />
Clark County <strong>School</strong> District (NV) 33,426 $8,698,798.15<br />
Columbus City <strong>School</strong>s (OH) 1,151 $300,539.84<br />
Cypress- Fairbanks Independent <strong>School</strong> District (TX) 6,573 $1,661,883.76<br />
Dallas Independent <strong>School</strong> District (TX) 57,037 $14,368,572.83<br />
DeKalb County Public <strong>School</strong>s (GA) 26,580 $6,976,482.29<br />
Denver Public <strong>School</strong>s (CO) 16,992 $4,570,509.74<br />
Des Mo<strong>in</strong>es Public <strong>School</strong>s (IA) 10,886 $2,766,519.33<br />
Detroit Public <strong>School</strong>s (MI) 4,571 $1,223,679.40<br />
District of Columbia Public <strong>School</strong>s (DC) * *<br />
Duval Public <strong>School</strong>s (FL) * *<br />
Elg<strong>in</strong> <strong>School</strong> District (IL) 5,110 $1,287,778.85<br />
Fort Worth Independent <strong>School</strong> District (TX) 5,686 $1,464,972.83<br />
Fulton County <strong>School</strong>s (GA) 14,347 $3,557,992.74<br />
Guilford County <strong>School</strong>s (NC) 4,592 $1,209,457.81<br />
Hillsborough County <strong>School</strong>s (FL) 14,800 $3,960,651.44<br />
Houston Independent <strong>School</strong> District (TX) 10,727 $2,691,778.24<br />
Indianapolis Public <strong>School</strong>s (IN) * *<br />
Irv<strong>in</strong>g Independent <strong>School</strong> District (TX) 2,278 $610,724.42<br />
Jeffco Public <strong>School</strong>s (CO) 1,508 $380,023.87<br />
Jefferson County Public <strong>School</strong>s (KY) 5,166 $1,331,746.17<br />
Kansas City Kansas <strong>School</strong>s (KS) 5,868 $1,531,696.75<br />
Knox County <strong>School</strong>s (TN) 2,732 $767,732.44<br />
Lee County <strong>School</strong>s (FL) 6,433 $1,629,081.71<br />
Little Rock <strong>School</strong> District (AR) 4,504 $1,224,091.77<br />
Long Beach Unified <strong>School</strong> District (CA) 1,360 $358,280.89<br />
Los Angeles Unified <strong>School</strong> District (CA) 9,518 $2,513,123.58<br />
<strong>Food</strong> <strong>Research</strong> and Action Center | <strong>School</strong> <strong>Breakfast</strong>: <strong>Mak<strong>in</strong>g</strong> <strong>It</strong> <strong>Work</strong> <strong>in</strong> <strong>Large</strong> <strong>School</strong> <strong>Districts</strong> 20
District<br />
Additional Low-<br />
Income<br />
Students <strong>in</strong><br />
<strong>Breakfast</strong> if 70<br />
per 100 <strong>in</strong> Lunch<br />
Additional Federal<br />
Fund<strong>in</strong>g if 70 Low-<br />
Income <strong>Breakfast</strong><br />
Students per 100<br />
Receiv<strong>in</strong>g Lunch<br />
Memphis City <strong>School</strong>s (TN) 51,169 $13,464,106.63<br />
Mesa Public <strong>School</strong>s (AZ) 4,127 $1,112,088.14<br />
Miami-Dade Public <strong>School</strong>s (FL) 7,715 $2,060,371.80<br />
Montgomery County <strong>School</strong>s (MD) 7,291 $1,956,079.73<br />
New York City Dept. of Education (NY) 185,383 $50,341,750.00<br />
Newark Public <strong>School</strong>s (NJ) * *<br />
Oakland Unified <strong>School</strong> District (CA) 6,128 $1,643,647.15<br />
Omaha Public <strong>School</strong>s (NE) 4,389 $1,013,193.71<br />
Orange County <strong>School</strong>s (FL) 18,502 $4,950,244.08<br />
Philadelphia <strong>School</strong> District (PA) 8,966 $2,405,332.55<br />
P<strong>in</strong>ellas County <strong>School</strong>s (FL) 10,978 $2,780,125.76<br />
Portland Public <strong>School</strong>s (OR) 1,885 $479,887.38<br />
Pr<strong>in</strong>ce Georges County Public <strong>School</strong>s (MD) 9,403 $2,516,189.30<br />
Richmond City Public <strong>School</strong>s (VA) 898 $237,994.60<br />
Salt Lake City <strong>School</strong> District (UT) 3,736 $975,801.47<br />
San Antonio Independent <strong>School</strong> District (TX) * *<br />
San Diego Unified <strong>School</strong> District (CA) 3,419 $877,111.71<br />
Syracuse City <strong>School</strong> District (NY) 797 $212,669.19<br />
Toledo Public <strong>School</strong>s (OH) 3,945 $1,043,567.50<br />
Wake County Public <strong>School</strong>s (NC) 8,503 $2,264,775.48<br />
TOTAL 667,486 $175,685,448.65<br />
* Already exceeds 70 free and reduced-price school breakfasts per 100 free and reduced-price school lunches<br />
<strong>Food</strong> <strong>Research</strong> and Action Center | <strong>School</strong> <strong>Breakfast</strong>: <strong>Mak<strong>in</strong>g</strong> <strong>It</strong> <strong>Work</strong> <strong>in</strong> <strong>Large</strong> <strong>School</strong> <strong>Districts</strong> 21
Table 6: <strong>School</strong>s <strong>in</strong> <strong>Districts</strong> Adopt<strong>in</strong>g Key <strong>Breakfast</strong> Options*<br />
District<br />
<strong>Breakfast</strong><br />
Offered<br />
Free to<br />
All<br />
Provision<br />
2^<br />
Albuquerque Public <strong>School</strong>s (NM) Some Yes Yes<br />
Atlanta Public <strong>School</strong>s (GA) Some No Yes<br />
Aust<strong>in</strong> Independent <strong>School</strong> District (TX) No No No<br />
Baltimore City Public <strong>School</strong>s (MD) All Yes Yes<br />
Boise <strong>School</strong> District (ID) Some Yes Yes<br />
Boston Public <strong>School</strong>s (MA) All Yes Yes<br />
Brentwood Union Free <strong>School</strong> District (NY) Some No Yes<br />
Broward County <strong>School</strong>s (FL) Some No No<br />
Charleston County <strong>School</strong> District (SC) All No Yes<br />
Chicago Public <strong>School</strong>s (IL) Some No Yes<br />
C<strong>in</strong>c<strong>in</strong>nati Public <strong>School</strong>s (OH) All Yes No<br />
Clark County <strong>School</strong> District (NV) Some Yes Yes<br />
Columbus City <strong>School</strong>s (OH) All No Yes<br />
Cypress- Fairbanks Independent <strong>School</strong> District (TX) No No No<br />
Dallas Independent <strong>School</strong> District (TX) Some No Yes<br />
DeKalb County Public <strong>School</strong>s (GA) Some Yes No<br />
Denver Public <strong>School</strong>s (CO) All No Yes<br />
Des Mo<strong>in</strong>es Public <strong>School</strong>s (IA) Some Yes Yes<br />
Detroit Public <strong>School</strong>s (MI) All No Yes<br />
District of Columbia Public <strong>School</strong>s (DC) All Yes Yes<br />
Duval Public <strong>School</strong>s (FL) Some No Yes<br />
Elg<strong>in</strong> <strong>School</strong> District (IL) Some No Yes<br />
Fort Worth Independent <strong>School</strong> District (TX) Some No Yes<br />
Fulton County <strong>School</strong>s (GA) Some No Yes<br />
Guilford County <strong>School</strong>s (NC) Some No Yes<br />
Hillsborough County <strong>School</strong>s (FL) All No Yes<br />
Houston Independent <strong>School</strong> District (TX) All No Yes<br />
Indianapolis Public <strong>School</strong>s (IN) Some Yes Yes<br />
Irv<strong>in</strong>g Independent <strong>School</strong> District (TX) All Yes Yes<br />
Jeffco Public <strong>School</strong>s (CO) Some No Yes<br />
Jefferson County Public <strong>School</strong>s (KY) Some Yes Yes<br />
Kansas City Kansas <strong>School</strong>s (KS) Some No Yes<br />
Knox County <strong>School</strong>s (TN) Some Yes Yes<br />
Lee County <strong>School</strong>s (FL) All No Yes<br />
Little Rock <strong>School</strong> District (AR) Some Yes Yes<br />
Long Beach Unified <strong>School</strong> District (CA) Some Yes Yes<br />
Los Angeles Unified <strong>School</strong> District (CA) Some Yes Yes<br />
Memphis City <strong>School</strong>s (TN) All No Yes<br />
Mesa Public <strong>School</strong>s (AZ) Some Yes Yes<br />
Miami-Dade Public <strong>School</strong>s (FL) All No No<br />
Montgomery County <strong>School</strong>s (MD) Some No Yes<br />
New York City Dept. of Education (NY) All Yes Yes<br />
<strong>Breakfast</strong><br />
In the<br />
Classroom*<br />
<strong>Food</strong> <strong>Research</strong> and Action Center | <strong>School</strong> <strong>Breakfast</strong>: <strong>Mak<strong>in</strong>g</strong> <strong>It</strong> <strong>Work</strong> <strong>in</strong> <strong>Large</strong> <strong>School</strong> <strong>Districts</strong> 22
District<br />
<strong>Breakfast</strong><br />
Offered<br />
Free to<br />
All<br />
Provision<br />
2^<br />
Newark Public <strong>School</strong>s (NJ) All No Yes<br />
Oakland Unified <strong>School</strong> District (CA) All Yes Yes<br />
Omaha Public <strong>School</strong>s (NE) All Yes Yes<br />
Orange County <strong>School</strong>s (FL) Some Yes Yes<br />
Philadelphia <strong>School</strong> District (PA) All No Yes<br />
P<strong>in</strong>ellas County <strong>School</strong>s (FL) Some No No<br />
Portland Public <strong>School</strong>s (OR) Some Yes Yes<br />
Pr<strong>in</strong>ce Georges County Public <strong>School</strong>s (MD) Some No Yes<br />
Richmond City Public <strong>School</strong>s (VA) Some Yes No<br />
Salt Lake City <strong>School</strong> District (UT) No No No<br />
San Antonio Independent <strong>School</strong> District (TX) All No Yes<br />
San Diego Unified <strong>School</strong> District (CA) Some Yes Yes<br />
Syracuse City <strong>School</strong> District (NY) All Yes Yes<br />
Toledo Public <strong>School</strong>s (OH) Some No No<br />
Wake County Public <strong>School</strong>s (NC) Some No Yes<br />
<strong>Breakfast</strong><br />
In the<br />
Classroom*<br />
^“Provision 2” of the National <strong>School</strong> Lunch Act enables schools to offer lunch and/or breakfast at no charge to all of their students, while<br />
reduc<strong>in</strong>g paperwork and adm<strong>in</strong>istrative costs.<br />
* In this chart “breakfast <strong>in</strong> the classroom” also <strong>in</strong>cludes “grab and go” and breakfast after first period<br />
<strong>Food</strong> <strong>Research</strong> and Action Center | <strong>School</strong> <strong>Breakfast</strong>: <strong>Mak<strong>in</strong>g</strong> <strong>It</strong> <strong>Work</strong> <strong>in</strong> <strong>Large</strong> <strong>School</strong> <strong>Districts</strong> 23
Appendix<br />
The Survey<br />
In the summer of 2012, FRAC sent a survey regard<strong>in</strong>g school year 2011-2012 school breakfast participation and<br />
practices to 79 large urban and suburban school districts. FRAC selected the districts based on size and<br />
geographic representation, seek<strong>in</strong>g to look not just at the nation’s largest districts but at large school districts <strong>in</strong> a<br />
substantial number of states. <strong>School</strong> food service staff <strong>in</strong> 48 districts responded between August and December<br />
2012.<br />
The major goals of the survey were to:<br />
• determ<strong>in</strong>e the extent to which these districts reach low-<strong>in</strong>come children with the <strong>School</strong> <strong>Breakfast</strong> Program<br />
and assess trends;<br />
• consider the additional number of low-<strong>in</strong>come students who would be served if the districts achieved higher<br />
participation rates and determ<strong>in</strong>e the federal dollars lost to the districts as a result of not provid<strong>in</strong>g these<br />
meals;<br />
• monitor progress and exam<strong>in</strong>e the effectiveness of school districts’ efforts to <strong>in</strong>crease school breakfast<br />
participation through the provision of “universal” breakfast (breakfast offered at no charge to all students) and<br />
the implementation of programs where breakfast is eaten <strong>in</strong> the classroom at the beg<strong>in</strong>n<strong>in</strong>g of the school day;<br />
and<br />
• collect <strong>in</strong>formation on promis<strong>in</strong>g practices <strong>in</strong> the districts that might serve as national models for <strong>in</strong>creas<strong>in</strong>g<br />
school breakfast participation by low-<strong>in</strong>come students.<br />
Methodology<br />
The data <strong>in</strong> this report were collected directly from the school districts’ food and nutrition department personnel<br />
through an email survey and follow-up phone <strong>in</strong>terviews. Additional data were collected from three state antihunger<br />
organizations – Florida Impact, Maryland Hunger Solutions, and Texas Hunger Initiative.<br />
Student Participation<br />
Student participation data are based on the total number of breakfasts and lunches served dur<strong>in</strong>g the school<br />
year, with average daily participation determ<strong>in</strong>ed by divid<strong>in</strong>g the data by the number of serv<strong>in</strong>g days provided by<br />
each district.<br />
The Cost of Low Participation Rates<br />
The cost estimate is based on a calculation of the average daily number of children receiv<strong>in</strong>g free or reducedprice<br />
breakfasts for every 100 children receiv<strong>in</strong>g free or reduced-price lunches dur<strong>in</strong>g the same school year. FRAC<br />
then calculated the number of additional children who would be reached if each district reached a ratio of 70 <strong>in</strong><br />
breakfast to 100 <strong>in</strong> lunch. FRAC then multiplied this unserved population by the reimbursement rate for 168<br />
school days of breakfast. (While some districts served breakfast for more or fewer days dur<strong>in</strong>g the 2011–2012<br />
school year, 169 was the national average.) FRAC assumed each district’s mix of free and reduced-price students<br />
would apply to any new participants, and conservatively assumed that no additional student’s meal would be<br />
reimbursed at the higher rate that “severe need” schools receive.<br />
<strong>Food</strong> <strong>Research</strong> and Action Center | <strong>School</strong> <strong>Breakfast</strong>: <strong>Mak<strong>in</strong>g</strong> <strong>It</strong> <strong>Work</strong> <strong>in</strong> <strong>Large</strong> <strong>School</strong> <strong>Districts</strong> 24
<strong>School</strong> District Contacts<br />
District State Contact Title Phone Email<br />
Albuquerque Public NM Mary Swift Director 505-345-5661 swift@aps.edu<br />
<strong>School</strong>s<br />
x37041<br />
Atlanta Public <strong>School</strong>s GA Marilyn Hughes Director of<br />
Nutrition<br />
Adm<strong>in</strong>istration<br />
404-802-1599 mhhughes@atlanta.k12.ga.us<br />
Aust<strong>in</strong> Independent <strong>School</strong><br />
District<br />
TX Chris Carrillo-Spano Director 512-414-0228 chriscar@aust<strong>in</strong>isd.org<br />
Baltimore City Public<br />
<strong>School</strong>s<br />
MD Elizabeth Marchetta Office of the CFO 410-396-8768 eamarchetta@bcps.k12.md.us<br />
Boise Public <strong>School</strong>s ID Peggy Bodnar Supervisor 208-854-4104 peggy.moorebodnar@boiseschools.org<br />
Boston Public <strong>School</strong>s MA Michael Peck Director 617.635.9144 mpeck@boston.k12.ma.us<br />
Brentwood Union Free NY Nancy Padrone Director of 631-434-2316 npadrone@bufsd.org<br />
<strong>School</strong> District<br />
Operations<br />
Broward County Public<br />
<strong>School</strong>s<br />
FL Mary Mulder Director 754-321-0215 mary.mulder@browardschools.com<br />
Charleston Co. <strong>School</strong><br />
District<br />
SC Walter Campbell Director 843-566-8180 walter_campbell@charleston.k12.sc.us<br />
Chicago Public <strong>School</strong>s IL Leslie Fowler Director 773-553-2833 Lafowler@cps.edu<br />
C<strong>in</strong>c<strong>in</strong>nati Public <strong>School</strong>s OH Jessica Shelly Director 513-363-0818 Shellyj@cps-K12.org<br />
Clark County <strong>School</strong><br />
District (Las Vegas)<br />
NV Virg<strong>in</strong>ia Beck Coord<strong>in</strong>ator 702-799-8123 vkbeck@<strong>in</strong>teract.ccsd.net<br />
Columbus City <strong>School</strong>s OH Joe Brown <strong>Food</strong> Service<br />
Director<br />
614-365-5671 jbrown@columbus.k12.oh.us<br />
Cypress-Fairbanks<br />
Independent <strong>School</strong> Dist.<br />
TX Darr<strong>in</strong> Crawford Director 281-897-4541 jeffery.crawford@cfisd.net<br />
Dallas Independent <strong>School</strong><br />
District<br />
TX Dora Rivas Executive Director 214-932-5503 drivas@dallasisd.org<br />
DeKalb County <strong>School</strong><br />
District<br />
GA Joyce Wimberly Director 678.676.0156 joyce_r_wimberly@fc.dekalb.k12.ga.us<br />
Denver Public <strong>School</strong>s CO Theresa Hafner Director 720-423-5611 theresa_hafner@dpsk12.org<br />
Des Mo<strong>in</strong>es Public <strong>School</strong>s IA Sandy Huisman Director 515-242-7712 sandy.huisman@dmschools.org<br />
Detroit Public <strong>School</strong>s MI Betti Wigg<strong>in</strong>s Director 313-578-7220 betti.wigg<strong>in</strong>s@detroitk12.org<br />
District of Columbia Public<br />
<strong>School</strong>s<br />
DC Jeffrey Mills Director 202-384-2490 jeffrey.mills@dc.gov<br />
Duval County Public<br />
<strong>School</strong>s<br />
FL Wayne Atwood Supervisor 904-858-6310 atwoodw@duvalschools.org<br />
Elg<strong>in</strong> <strong>School</strong> District IL Claudie Phillips Director 847-888-5000<br />
x5036<br />
ClaudiePhillips@u-46.org<br />
Fort Worth Independent<br />
<strong>School</strong> District<br />
TX Glenn Headlee Director 817-814-3500 roy.headlee@fwisd.org<br />
Fulton County <strong>School</strong>s GA Alyssia Wright Executive Director 404-669-8960 WrightAL@fulton.k12.ga.us<br />
Guilford County <strong>School</strong>s<br />
(Greensboro)<br />
NC James Faggione Director 336-370-3266 faggioj@gcsnc.com<br />
Hillsborough County Public<br />
<strong>School</strong>s (Tampa)<br />
FL Mary Kate Harrison Director 813-840-7092 marykate.harrison@sdhc.k12.fl.us<br />
Houston Independent TX Julie Spreckelmeyer Director of 713-491-5835 jsprecke@houstonisd.org<br />
<strong>School</strong> District<br />
Communications,<br />
<strong>Food</strong> Service<br />
Indianapolis Public <strong>School</strong>s IN Jane Cookson Director 317-226-4772 cooksonj@ips.k12.<strong>in</strong>.us<br />
Irv<strong>in</strong>g Independent <strong>School</strong> TX Michael<br />
Director 972-600-6900 mr@irv<strong>in</strong>gisd.net<br />
District<br />
Rosenberger<br />
JeffCo Public <strong>School</strong>s CO L<strong>in</strong>da Stoll Executive Director 303-982-6746 lstoll@jeffco.k12.co.us<br />
Jefferson County Public<br />
<strong>School</strong>s (Louisville)<br />
KY Julie Bauscher Director 502-485-3186 Julia.Bauscher@jefferson.kyschools.us<br />
<strong>Food</strong> <strong>Research</strong> and Action Center | <strong>School</strong> <strong>Breakfast</strong>: <strong>Mak<strong>in</strong>g</strong> <strong>It</strong> <strong>Work</strong> <strong>in</strong> <strong>Large</strong> <strong>School</strong> <strong>Districts</strong> 25
District State Contact Title Phone Email<br />
Kansas City Kansas Public<br />
<strong>School</strong>s<br />
KS Karla Rob<strong>in</strong>son Director 913-627-3914 karob<strong>in</strong>@kckps.org<br />
Knox County <strong>School</strong>s<br />
(Knoxville)<br />
TN Jon Dickl Director 865-594-3614 jon.dickl@knoxschools.org<br />
Lee County Public <strong>School</strong>s<br />
(Fort Myers)<br />
FL Sonny Stelmacki Director 239-461-8432 SonnyAS@leeschools.net<br />
Little Rock <strong>School</strong> District AR Lilly Bouie Director of<br />
Nutrition<br />
501-447-2452 Lilly.bouie@lrsd.org<br />
Long Beach Unified <strong>School</strong> CA Cecelia Slater Director 562-427-7923 cslater@lbschools.net<br />
District<br />
x.249<br />
Los Angeles Unified <strong>School</strong> CA Laura Benavidez Asst. Director, <strong>Food</strong> 213-241-2993 laura.benavidez@lausd.net<br />
District<br />
Services Division<br />
Memphis City <strong>School</strong>s TN Anthony Geraci <strong>Food</strong> Service<br />
Director<br />
901-416-5556 GERACIA@mcsk12.net<br />
Mesa Public <strong>School</strong>s AZ Loretta Zullo Director 480-472-0909 lzullo@mpsaz.org<br />
Miami-Dade County Public FL Susan Rothste<strong>in</strong> Coord<strong>in</strong>ator, 786-275-0438 srothste<strong>in</strong>@dadeschools.net<br />
<strong>School</strong>s<br />
Nutritional<br />
Wellness<br />
Montgomery County Public<br />
<strong>School</strong>s<br />
MD Marla R. Caplon Director 301-840-8170 Marla_R_Caplon@mcpsmd.org<br />
New York City Dept. of NY Robert Deschak Strategic Initiatives, 718-707-4334 rdeschak@schools.nyc.gov<br />
Education<br />
<strong>School</strong> <strong>Food</strong><br />
Newark Public <strong>School</strong>s NJ Tonya Rigg<strong>in</strong>s Director 973-733-7172 trigg<strong>in</strong>s@nps.k12.nj.us<br />
Oakland Unified <strong>School</strong><br />
District<br />
CA Jennifer LeBarre Director 510-879-8345 Jennifer.lebarre@ousd.k12.ca.us<br />
Omaha Public <strong>School</strong>s NE Tammy Yarmon Director 402-557-2230 Tammy.Yarmon@ops.org<br />
Orange County Public<br />
<strong>School</strong>s (Orlando)<br />
FL Lora Gilbert Director 407-317-3963 Lora.gilbert@ocps.net<br />
Philadelphia <strong>School</strong> District PA Wayne Grasela Director 215-400-5531 wgrasela@philasd.org<br />
P<strong>in</strong>ellas County Public<br />
<strong>School</strong>s (Clearwater)<br />
FL Art Dunham Director 727-547-7155 dunhama@p<strong>in</strong>ellas.k12.fl.us<br />
Portland Public <strong>School</strong>s OR Gitta Grether-<br />
Sweeney<br />
Director 503-916-3397 gsweeney@pps.net<br />
Pr<strong>in</strong>ce George's County<br />
Public <strong>School</strong>s<br />
MD Joan Shorter Director 301-952-6580 jshorter@pgcps.org<br />
Richmond Public <strong>School</strong>s VA Susan Roberson Director 804-780-8240 sroberso@richmond.k12.va.us<br />
Salt Lake City <strong>School</strong><br />
District<br />
UT Kelly Orton Director 801-578-8599 kelly.orton@slcschools.org<br />
San Antonio Independent TX Sally Cody Director 210-227-3522 scody1@saisd.net<br />
<strong>School</strong> District<br />
ext. 122<br />
San Diego Unified <strong>School</strong><br />
District<br />
CA Gary Petill Director 858-627-7301 gpetill@sandi.net<br />
Syracuse City <strong>School</strong> NY C<strong>in</strong>dy Bonura Director 315-435-4207 Cbonura@scsd.us<br />
District<br />
Sturgeon<br />
Toledo Public <strong>School</strong>s OH Reynald Debroas Executive Director 419-244-8893 rdebroas@tps.org<br />
Wake County Public<br />
<strong>School</strong>s<br />
NC Marla Moody Senior Director 919-856-2918 mbmoody@wcpss.net<br />
<strong>Food</strong> <strong>Research</strong> and Action Center | <strong>School</strong> <strong>Breakfast</strong>: <strong>Mak<strong>in</strong>g</strong> <strong>It</strong> <strong>Work</strong> <strong>in</strong> <strong>Large</strong> <strong>School</strong> <strong>Districts</strong> 26