Hunger Doesn't Take A Vacation: - Food Research and Action Center
Hunger Doesn't Take A Vacation: - Food Research and Action Center
Hunger Doesn't Take A Vacation: - Food Research and Action Center

You also want an ePaper? Increase the reach of your titles
YUMPU automatically turns print PDFs into web optimized ePapers that Google loves.
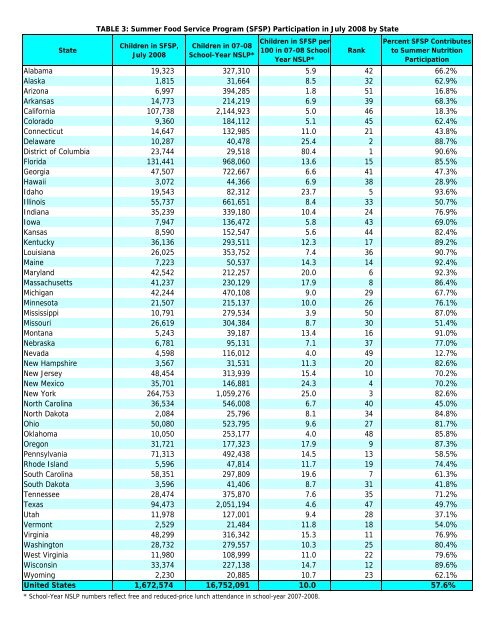
State<br />
TABLE 3: Summer <strong>Food</strong> Service Program (SFSP) Participation in July 2008 by State<br />
Children in SFSP,<br />
July 2008<br />
Children in 07-08<br />
School-Year NSLP*<br />
Children in SFSP per<br />
100 in 07-08 School-<br />
Year NSLP*<br />
Rank<br />
Percent SFSP Contributes<br />
to Summer Nutrition<br />
Participation<br />
Alabama 19,323 327,310 5.9 42 66.2%<br />
Alaska 1,815 31,664 8.5 32 62.9%<br />
Arizona 6,997 394,285 1.8 51 16.8%<br />
Arkansas 14,773 214,219 6.9 39 68.3%<br />
California 107,738 2,144,923 5.0 46 18.3%<br />
Colorado 9,360 184,112 5.1 45 62.4%<br />
Connecticut 14,647 132,985 11.0 21 43.8%<br />
Delaware 10,287 40,478 25.4 2 88.7%<br />
District of Columbia 23,744 29,518 80.4 1 90.6%<br />
Florida 131,441 968,060 13.6 15 85.5%<br />
Georgia 47,507 722,667 6.6 41 47.3%<br />
Hawaii 3,072 44,366 6.9 38 28.9%<br />
Idaho 19,543 82,312 23.7 5 93.6%<br />
Illinois 55,737 661,651 8.4 33 50.7%<br />
Indiana 35,239 339,180 10.4 24 76.9%<br />
Iowa 7,947 136,472 5.8 43 69.0%<br />
Kansas 8,590 152,547 5.6 44 82.4%<br />
Kentucky 36,136 293,511 12.3 17 89.2%<br />
Louisiana 26,025 353,752 7.4 36 90.7%<br />
Maine 7,223 50,537 14.3 14 92.4%<br />
Maryl<strong>and</strong> 42,542 212,257 20.0 6 92.3%<br />
Massachusetts 41,237 230,129 17.9 8 86.4%<br />
Michigan 42,244 470,108 9.0 29 67.7%<br />
Minnesota 21,507 215,137 10.0 26 76.1%<br />
Mississippi 10,791 279,534 3.9 50 87.0%<br />
Missouri 26,619 304,384 8.7 30 51.4%<br />
Montana 5,243 39,187 13.4 16 91.0%<br />
Nebraska 6,781 95,131 7.1 37 77.0%<br />
Nevada 4,598 116,012 4.0 49 12.7%<br />
New Hampshire 3,567 31,531 11.3 20 82.6%<br />
New Jersey 48,454 313,939 15.4 10 70.2%<br />
New Mexico 35,701 146,881 24.3 4 70.2%<br />
New York 264,753 1,059,276 25.0 3 82.6%<br />
North Carolina 36,534 546,008 6.7 40 45.0%<br />
North Dakota 2,084 25,796 8.1 34 84.8%<br />
Ohio 50,080 523,795 9.6 27 81.7%<br />
Oklahoma 10,050 253,177 4.0 48 85.8%<br />
Oregon 31,721 177,323 17.9 9 87.3%<br />
Pennsylvania 71,313 492,438 14.5 13 58.5%<br />
Rhode Isl<strong>and</strong> 5,596 47,814 11.7 19 74.4%<br />
South Carolina 58,351 297,809 19.6 7 61.3%<br />
South Dakota 3,596 41,406 8.7 31 41.8%<br />
Tennessee 28,474 375,870 7.6 35 71.2%<br />
Texas 94,473 2,051,194 4.6 47 49.7%<br />
Utah 11,978 127,001 9.4 28 37.1%<br />
Vermont 2,529 21,484 11.8 18 54.0%<br />
Virginia 48,299 316,342 15.3 11 76.9%<br />
Washington 28,732 279,557 10.3 25 80.4%<br />
West Virginia 11,980 108,999 11.0 22 79.6%<br />
Wisconsin 33,374 227,138 14.7 12 89.6%<br />
Wyoming 2,230 20,885 10.7 23 62.1%<br />
United States 1,672,574 16,752,091 10.0 57.6%<br />
* School-Year NSLP numbers reflect free <strong>and</strong> reduced-price lunch attendance in school-year 2007-2008.