Sri Lanka Economic Performance Assessment (2009)
Sri Lanka Economic Performance Assessment (2009)
Sri Lanka Economic Performance Assessment (2009)

You also want an ePaper? Increase the reach of your titles
YUMPU automatically turns print PDFs into web optimized ePapers that Google loves.
O VERVIEW OF THE E CONOMY 11<br />
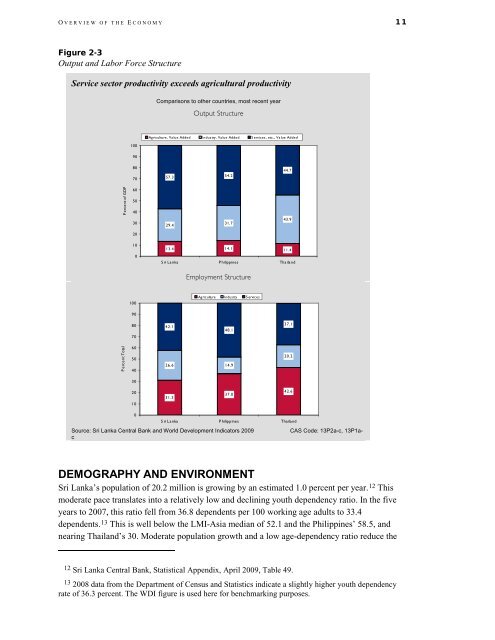
Figure 2-3<br />
Output and Labor Force Structure<br />
Service sector productivity exceeds agricultural productivity<br />
Percent of GDP<br />
P e rce nt Tota l<br />
100<br />
90<br />
80<br />
70<br />
60<br />
50<br />
40<br />
30<br />
20<br />
10<br />
0<br />
100<br />
90<br />
80<br />
70<br />
60<br />
50<br />
40<br />
30<br />
20<br />
10<br />
0<br />
Comparisons to other countries, most recent year<br />
57.3<br />
29.4<br />
Output Structure<br />
Agriculture, Value Added Industry, Value Added Services, etc., Value Added<br />
54.2<br />
31.7<br />
44.7<br />
43.9<br />
13.4 14.1 11.4<br />
S ri La nka P hilippines Thailand<br />
42.1<br />
31.3<br />
Employment Structure<br />
Agriculture Industry S ervices<br />
48.1<br />
26.6 14.9<br />
37.0<br />
37.1<br />
20.2<br />
42.6<br />
S ri L a nka P hilippines Thailand<br />
Source: <strong>Sri</strong> <strong>Lanka</strong> Central Bank and World Development Indicators <strong>2009</strong> CAS Code: 13P2a-c, 13P1ac<br />
DEMOGRAPHY AND ENVIRONMENT<br />
<strong>Sri</strong> <strong>Lanka</strong>’s population of 20.2 million is growing by an estimated 1.0 percent per year. 12 This<br />
moderate pace translates into a relatively low and declining youth dependency ratio. In the five<br />
years to 2007, this ratio fell from 36.8 dependents per 100 working age adults to 33.4<br />
dependents. 13 This is well below the LMI-Asia median of 52.1 and the Philippines’ 58.5, and<br />
nearing Thailand’s 30. Moderate population growth and a low age-dependency ratio reduce the<br />
12 <strong>Sri</strong> <strong>Lanka</strong> Central Bank, Statistical Appendix, April <strong>2009</strong>, Table 49.<br />
13 2008 data from the Department of Census and Statistics indicate a slightly higher youth dependency<br />
rate of 36.3 percent. The WDI figure is used here for benchmarking purposes.