Sri Lanka Economic Performance Assessment (2009)
Sri Lanka Economic Performance Assessment (2009)
Sri Lanka Economic Performance Assessment (2009)
You also want an ePaper? Increase the reach of your titles
YUMPU automatically turns print PDFs into web optimized ePapers that Google loves.
A - 2 A PPENDIX A<br />
accruing to the poorest 20 percent of households can be used to gauge income inequality. We use<br />
the income share because it is simpler and more sensitive to changes.<br />
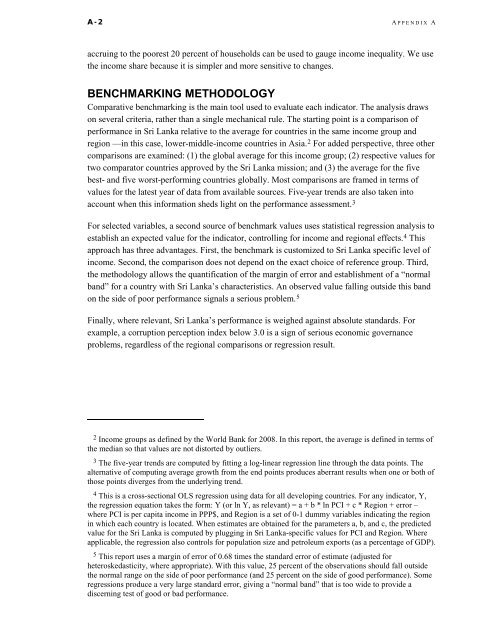
BENCHMARKING METHODOLOGY<br />
Comparative benchmarking is the main tool used to evaluate each indicator. The analysis draws<br />
on several criteria, rather than a single mechanical rule. The starting point is a comparison of<br />
performance in <strong>Sri</strong> <strong>Lanka</strong> relative to the average for countries in the same income group and<br />
region —in this case, lower-middle-income countries in Asia. 2 For added perspective, three other<br />
comparisons are examined: (1) the global average for this income group; (2) respective values for<br />
two comparator countries approved by the <strong>Sri</strong> <strong>Lanka</strong> mission; and (3) the average for the five<br />
best- and five worst-performing countries globally. Most comparisons are framed in terms of<br />
values for the latest year of data from available sources. Five-year trends are also taken into<br />
account when this information sheds light on the performance assessment. 3<br />
For selected variables, a second source of benchmark values uses statistical regression analysis to<br />
establish an expected value for the indicator, controlling for income and regional effects. 4 This<br />
approach has three advantages. First, the benchmark is customized to <strong>Sri</strong> <strong>Lanka</strong> specific level of<br />
income. Second, the comparison does not depend on the exact choice of reference group. Third,<br />
the methodology allows the quantification of the margin of error and establishment of a “normal<br />
band” for a country with <strong>Sri</strong> <strong>Lanka</strong>’s characteristics. An observed value falling outside this band<br />
on the side of poor performance signals a serious problem. 5<br />
Finally, where relevant, <strong>Sri</strong> <strong>Lanka</strong>’s performance is weighed against absolute standards. For<br />
example, a corruption perception index below 3.0 is a sign of serious economic governance<br />
problems, regardless of the regional comparisons or regression result.<br />
2 Income groups as defined by the World Bank for 2008. In this report, the average is defined in terms of<br />
the median so that values are not distorted by outliers.<br />
3 The five-year trends are computed by fitting a log-linear regression line through the data points. The<br />
alternative of computing average growth from the end points produces aberrant results when one or both of<br />
those points diverges from the underlying trend.<br />
4 This is a cross-sectional OLS regression using data for all developing countries. For any indicator, Y,<br />
the regression equation takes the form: Y (or ln Y, as relevant) = a + b * ln PCI + c * Region + error –<br />
where PCI is per capita income in PPP$, and Region is a set of 0-1 dummy variables indicating the region<br />
in which each country is located. When estimates are obtained for the parameters a, b, and c, the predicted<br />
value for the <strong>Sri</strong> <strong>Lanka</strong> is computed by plugging in <strong>Sri</strong> <strong>Lanka</strong>-specific values for PCI and Region. Where<br />
applicable, the regression also controls for population size and petroleum exports (as a percentage of GDP).<br />
5 This report uses a margin of error of 0.68 times the standard error of estimate (adjusted for<br />
heteroskedasticity, where appropriate). With this value, 25 percent of the observations should fall outside<br />
the normal range on the side of poor performance (and 25 percent on the side of good performance). Some<br />
regressions produce a very large standard error, giving a “normal band” that is too wide to provide a<br />
discerning test of good or bad performance.


