Sri Lanka Economic Performance Assessment (2009)
Sri Lanka Economic Performance Assessment (2009)
Sri Lanka Economic Performance Assessment (2009)

Create successful ePaper yourself
Turn your PDF publications into a flip-book with our unique Google optimized e-Paper software.
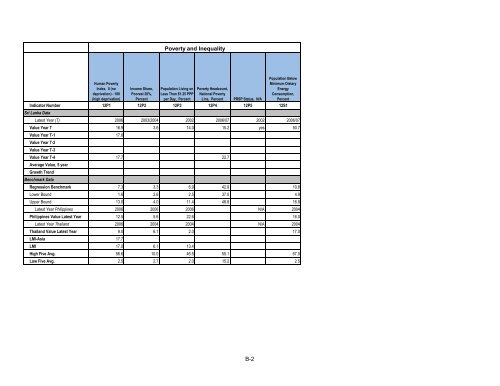
Indicator Number<br />
<strong>Sri</strong> <strong>Lanka</strong> Data<br />
Latest Year (T)<br />
Value Year T<br />
Value Year T-1<br />
Value Year T-2<br />
Value Year T-3<br />
Value Year T-4<br />
Average Value, 5 year<br />
Growth Trend<br />
Benchmark Data<br />
Regression Benchmark<br />
Lower Bound<br />
Upper Bound<br />
Latest Year Philippines<br />
Philippines Value Latest Year<br />
Latest Year Thailand<br />
Thailand Value Latest Year<br />
LMI-Asia<br />
LMI<br />
High Five Avg.<br />
Low Five Avg.<br />
Human Poverty<br />
Index, 0 (no<br />
deprivation) - 100<br />
(high deprivation)<br />
Income Share,<br />
Poorest 20%,<br />
Percent<br />
Poverty and Inequality<br />
Population Living on<br />
Less Than $1.25 PPP<br />
per Day, Percent<br />
Poverty Headcount,<br />
National Poverty<br />
Line, Percent PRSP Status, N/A<br />
B-2<br />
Population Below<br />
Minimum Dietary<br />
Energy<br />
Consumption,<br />
Percent<br />
12P1 12P2 12P3 12P4 12P5 12S1<br />
2006 2003/2004 2002 2006/07 2002 2006/07<br />
16.9<br />
17.8<br />
3.6 14.0 15.2 yes 50.7<br />
17.7 22.7<br />
7.3 3.3 6.9 42.9 10.8<br />
1.6 2.6 2.5 37.0 4.9<br />
13.0 4.0 11.4 48.8 16.8<br />
2006 2006 2006 N/A 2004<br />
12.5 5.6 22.6 16.0<br />
2006 2004 2004 N/A 2004<br />
9.0 6.1 2.0 17.0<br />
17.7<br />
17.0 6.1 13.4<br />
56.6 10.0 46.5 55.1 67.0<br />
2.5 2.7 2.0 15.2 2.5