Feed Efficiency - Penn State University
Feed Efficiency - Penn State University
Feed Efficiency - Penn State University

You also want an ePaper? Increase the reach of your titles
YUMPU automatically turns print PDFs into web optimized ePapers that Google loves.
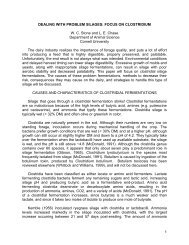
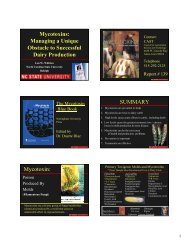
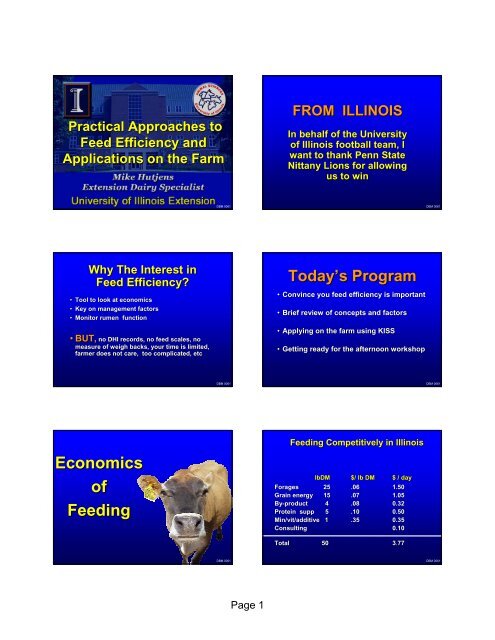
Practical Approaches to<br />
<strong>Feed</strong> <strong>Efficiency</strong> and<br />
Applications on the Farm<br />
Why The Interest in<br />
<strong>Feed</strong> <strong>Efficiency</strong>?<br />
• Tool to look at economics<br />
• Key on management factors<br />
• Monitor rumen function<br />
• BUT,<br />
BUT, no DHI records, no feed scales, no<br />
measure of weigh backs, your time is limited,<br />
farmer does not care, too complicated, etc<br />
Economics<br />
of<br />
<strong>Feed</strong>ing<br />
DBM 0061<br />
DBM 0061<br />
DBM 0061<br />
Page 1<br />
FROM ILLINOIS<br />
In behalf of the <strong>University</strong><br />
of Illinois football team, I<br />
want to thank <strong>Penn</strong> <strong>State</strong><br />
Nittany Lions for allowing<br />
us to win<br />
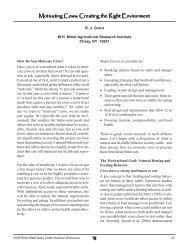
Today’s Today s Program<br />
• Convince you feed efficiency is important<br />
• Brief review of concepts and factors<br />
• Applying on the farm using KISS<br />
• Getting ready for the afternoon workshop<br />
<strong>Feed</strong>ing Competitively in Illinois<br />
lbDM $/ lb DM $ / day<br />
Forages 25 .06 1.50<br />
Grain energy 15 .07 1.05<br />
By-product<br />
By product 4 .08 0.32<br />
Protein supp 5 .10 0.50<br />
Min/vit Min/ vit/additive /additive 1 .35 0.35<br />
Consulting 0.10<br />
Total 50 3.77 77<br />
DBM 0061<br />
DBM 0061<br />
DBM 0061
<strong>Feed</strong>ing Economics<br />
Value Goal<br />
• <strong>Feed</strong> costs per cow per day $3.77 $4.00<br />
• <strong>Feed</strong> cost per lb DM $0.075 $0.08<br />
• <strong>Feed</strong> cost per cwt (65 lb) $5.39 $5.50<br />
• Income over feed costs ($18) $12.61 $12.50<br />
• <strong>Feed</strong> efficiency (lb milk/lb DM) 1.41 >1.50<br />
Component Corrected<br />
Milk Formulas<br />
3.5% FCM (lb) = (0.432 x lb of milk) +<br />
(16.22 x pounds of milk fat)<br />
ECM (lb) = (0.323 x lb of milk) +<br />
(12.82 x lb of milk fat) +<br />
(7.13 x lb of true protein)<br />
DBM 0061<br />
DBM 0061<br />
DBM 0061<br />
Page 2<br />
DMI<br />
Basics on<br />
<strong>Feed</strong><br />
<strong>Efficiency</strong><br />
Dairy <strong>Efficiency</strong><br />
Dairy <strong>Efficiency</strong>: Pounds of fat corrected<br />
milk divided by pounds of DM consumed<br />
High group, mature cows > 1.7<br />
High group, 1 st lactation > 1.6<br />
One group TMR herds > 1.5<br />
Fresh cows (< 21 days) < 1.3<br />
Concern (one group TMR) < 1.3<br />
Example: 75 lb milk / 50 lb DMI = 1.5<br />
DBM 0061<br />
3.5% FCM = (0.4324 x lb of milk) +<br />
(16.216 x pounds of milk fat) DBM 0061<br />
75.0<br />
70.0<br />
65.0<br />
60.0<br />
55.0<br />
50.0<br />
45.0<br />
40.0<br />
35.0<br />
$.82<br />
<strong>Feed</strong> <strong>Efficiency</strong><br />
70 Lbs. Of Milk and $.07/ lb <strong>Feed</strong> Cost<br />
30.0<br />
1.00 1.10 1.20 1.30 1.40 1.50 1.60 1.70 1.80 1.90 2.00<br />
Source: AgriKing<br />
$.58<br />
$.44<br />
FE Ratio<br />
$.34<br />
$.27<br />
DBM 0061
Published<br />
Research<br />
on <strong>Feed</strong><br />
<strong>Efficiency</strong><br />
Impact of Protein Form and Level<br />
DBM 0061<br />
LCP(14.8) MCP (16.8) HCP (18.7)<br />
SBM APB SBM APB SBM APB<br />
<strong>Feed</strong> Eff 1.59 1.64 1.58 1.65 1.61 1.69<br />
High Cows 1.68 1.81 1.69 1.67 1.69 1.76<br />
Low Cows 1.55 1.61 1.57 1.61 1.53 1.65<br />
MUN 9.0 8.2 11.1 11.0 14.7 13.6<br />
DBM 0061<br />
Yeast Culture and Dairy <strong>Efficiency</strong><br />
(South Dakota data, 2004)<br />
• 38 Holstein cows<br />
• Heat stress months, 120 days in milk<br />
Control Y.C. Group<br />
EC Milk (lb/day) 73.5 75.2<br />
Dry Matter Intake (lb) 50.8 48.6<br />
Dairy efficiency 1.49 1.59 (6.7%)<br />
IOFC ($/cow/day) 3.79 4.08 (7.7%)<br />
DBM 0061<br />
Page 3<br />
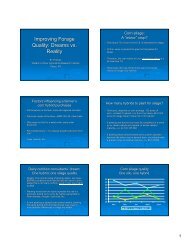
<strong>Feed</strong> <strong>Efficiency</strong> and dry matter<br />
digestibility (DMD)<br />
<strong>Feed</strong> <strong>Efficiency</strong><br />
2.00<br />
1.80<br />
1.60<br />
1.40<br />
Source: Agri-King Agri King<br />
1.20<br />
60 65 70 75 80 85<br />
DMD, %<br />
Monensin and <strong>Feed</strong> <strong>Efficiency</strong><br />
Monensin level 0 11g/t 15 g/t 22g/t<br />
Dry matter intake (lb) 43.9 43.4 42.8 42.3<br />
Milk yield (lb) 65.0 66.7 66.8 67.5<br />
Milk fat (%) 3.65 3.53 3.49 3.38<br />
Protein (%) 3.15 3.13 3.13 3.10<br />
3.5% FCM (lb) 66.1 66.8 66.7 66.0<br />
<strong>Feed</strong> eff (lb / lb) 1.50 1.54 1.56 1.56<br />
Improvement (%) ---- 2.0 2.5 4.0<br />
DBM 0061<br />
DBM 0061<br />
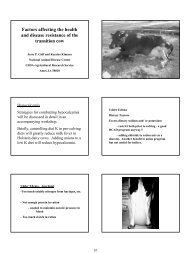
Effect Of Heat Stress On DM Intake And<br />
Energy Balance (60 lb milk)<br />
Temp Maint DMI DMI Milk DE<br />
(ºF) F) energy Need Expect (lb)<br />
68 100 40 40 60 1.5<br />
86 111 42 37 51 1.4<br />
95 120 43 36 40 1.1<br />
Mike Hutjens, 2003. World Dairy Expo<br />
DBM 0061
<strong>Feed</strong> <strong>Efficiency</strong> And Days In Milk<br />
Jim Linn and Bennet Crochet, Hubbard Dairy Services<br />
Applying <strong>Feed</strong><br />
<strong>Efficiency</strong> on<br />
the Farm<br />
Options for the Dairy Manager<br />
• Option 1 Computer software program<br />
• Option 2 On-farm On farm actual measurements<br />
• Option 3 KISS; estimating/adjusting FE<br />
–Milk Milk yield: DHI or bulk tank averages<br />
–<strong>Feed</strong> <strong>Feed</strong> intake: Ration sheet<br />
–Weigh Weigh backs: Not be measured<br />
DBM 0061<br />
DBM 0061<br />
DBM 0061<br />
Page 4<br />
Atwell Hoard’s Hoard s Field Data<br />
(30 herds, 11500 cow, MN and WI)<br />
• Sand vs. sawdust/mattress +0.03<br />
• Long day vs. short day (winter) +0.03<br />
• Bottom <strong>Penn</strong> <strong>State</strong> box (< 56%) +0.03<br />
• Monensin +0.03<br />
But, How Do<br />
You / We<br />
Measure It?<br />
#1 ZINPRO FED<br />
• Spread sheet program<br />
• Zinpro Corp (with OH <strong>State</strong> support)<br />
• Ability to compare across herds<br />
• “Corrected Corrected” feed efficiency values for:<br />
– Age of cows / parity<br />
– Milk components<br />
– Change in body condition score<br />
– Walking distances<br />
– Heat and cold stress<br />
– Stage of lactation<br />
– Other variables<br />
DBM 0061<br />
DBM 0061<br />
DBM 0061
#2: Herd Daily Data<br />
Pen Age Cow DMI Milk DIM FE<br />
(#) (group) (no) (lb) (lb) (days) (lb/lb)<br />
1 Cow 390 57.7 121 56 2.10<br />
2 Cow 399 61.3 115 148 1.87<br />
3 Cow 393 51.4 67 357 1.30<br />
4 Cow 402 59.2 100 228 1.69<br />
5 Heifer 390 51.6 88 218 1.70<br />
6 Heifer 428 52.7 76 359 1.44<br />
7 Heifer 386 46.7 83 100 1.78<br />
8 Hosp 56 38.5 45 62 1.17<br />
9 Mast 32 45.0 45 162 1.00 DBM 0061<br />
Factor 2: Days in Milk Factor<br />
(MN Data)<br />
Add 0.15 unit unit for for each each 50<br />
days in milk over 150 days<br />
Factor 4: Change in Body<br />
Condition Score<br />
(Cornell Data)<br />
Add or subtract 1.4 of milk for change<br />
of one half BCS score change over<br />
the lactation<br />
DBM 0061<br />
DBM 0061<br />
Page 5<br />
# 3: KISS (Hutjens ( Hutjens)<br />
Factor 1: Weigh back<br />
• <strong>Feed</strong> bunk score 1<br />
No feed remaining<br />
• <strong>Feed</strong> bunk score 2<br />
2 to 4% remaining<br />
• <strong>Feed</strong> bunk score 3<br />
Over 4% remaining<br />
DBM 0061<br />
Factor 3: Somatic cell count<br />
(WI Data)<br />
For each linear score change,<br />
add or subtract 2.5 lb of milk<br />
Factor 5: Walking/Pasture<br />
(NRC 2001)<br />
Add or subtract 0.2 pounds of<br />
milk for every 100 feet<br />
traveled on a flat surface<br />
DBM 0061<br />
DBM 0061
Factor 6: Rumen Acidosis<br />
(Hutjens Hutjens)<br />
• Reduce FE by 0.1 unit for evidence of<br />
SARA<br />
• SARA indicators could include:<br />
–Milk Milk protein: milk fat ratio > 0.9<br />
–Loose Loose manure (scores < 2.75)<br />
–Lameness Lameness scores > 1.6<br />
–DMI DMI varies > 2 lb per cow per day<br />
from base line TMR values<br />
Factor 8: <strong>Feed</strong> Additives<br />
(SD and JDS Data)<br />
• Review additives for shifts in FE<br />
based on published research<br />
results<br />
• Monensin: Add 0.06<br />
• Yeast culture: Add 0.10<br />
Factor 10: Heat Stress<br />
(NRC Data)<br />
• 68 degrees F to 86 degrees F<br />
–Reduce Reduce FE by 0.1 unit<br />
• 86 degrees F to 95 degrees F<br />
–Reduce Reduce FE by 0.3 unit<br />
DBM 0061<br />
DBM 0061<br />
DBM 0061<br />
Page 6<br />
Factor 7: Protein Level and Form<br />
(Illinois Data)<br />
• Higher protein crude protein<br />
–16.8 16.8 to 18.7%<br />
–Decrease Decrease FE by 0.03 unit<br />
• Favorable RUP amino acid profile<br />
–Increase Increase FE by 0.07 unit<br />
• MUN<br />
–Values Values > 16<br />
–Reduce Reduce FE by 0.03 unit DBM 0061<br />
Factor 9: Forage Quality<br />
and NDFD<br />
(Michigan Data)<br />
• Each increase in forage NDFD<br />
• 0.59 lb of 3.5%FCM<br />
• 0.37 lb of DMI<br />
Other Factors<br />
(Hoards-- (Hoards--Atwell<br />
Atwell Data)<br />
• Sand vs. sawdust/mattress +0.03<br />
• Long day vs. short day (winter) +0.03<br />
• Bottom <strong>Penn</strong> <strong>State</strong> box (< 56%) +0.03<br />
• Monensin +0.03<br />
DBM 0061<br />
DBM 0061
Case Study: Mike Milker<br />
• Averaging 70 lb of milk<br />
• 3.5% milk fat with 3.0% true protein<br />
• 50 lb of dry matter on the ration sheet<br />
• That’s That s all Mike has for you<br />
Impact on FE —Mike Mike Milker<br />
• <strong>Feed</strong> bunk rating is 2<br />
– 2 lb less dry matter consumed from base<br />
• Days in milk is averaging 200 days<br />
– Add 0.15 FE unit to base<br />
• SCC increased from 2 to 3<br />
– Add of 2.5 lb of milk from base<br />
• BCS dropped from 3.00 to 2.75<br />
– Drop 0.7 lb of milk<br />
• <strong>Feed</strong>ing 18% CP ration vs. 16%<br />
– Add 0.03 FE unit<br />
Zinpro FED Results<br />
Observed Calculated<br />
FE (lb ECM / lb DMI) 1.46 1.50<br />
IOFC ($/cwt) 13.72 14.11<br />
Income per day ($) 358 378<br />
DBM 0061<br />
DBM 0061<br />
DBM 0061<br />
Page 7<br />
Case Study—Mike<br />
Study Mike Milker<br />
• <strong>Feed</strong> bunk rating is 2<br />
– Less feed was consumed<br />
• Days in milk is averaging 200 days<br />
– Less milk due to later lactation cows<br />
• SCC increased from 2 to 3 (linear score)<br />
– Less milk due to higher SCS<br />
• BCS dropped from 3.00 to 2.75<br />
– Less milk as cows gain weight<br />
• <strong>Feed</strong>ing 18% CP ration/MUN over 16<br />
– Lower FE due to excess N<br />
Correcting Mike Milker’s Milker FE<br />
• Current FE : 70 lb of 3.5%FCM, 50 lb of dry<br />
matter, and 1.4 FE<br />
– <strong>Feed</strong> adjustment: - 2 lb DM<br />
– FE adjustment: + 0.15 (DIM) +0.03 (CP)<br />
– Milk adjustment: + 2.5 lb (SCC) and - 0.7 lb<br />
(BCS)<br />
• Potential FE: 71.8 lb / 48 lb DM = 1.50 add<br />
0.18 unit = 1.68 FE<br />
Take Home Message<br />
DBM 0061<br />
DBM 0061<br />
• <strong>Feed</strong> efficiency is a bench mark for economics<br />
• <strong>Feed</strong> efficiency is another way to reflect<br />
management and feeding weak links<br />
• Three approaches to FE; use all three<br />
–Software Software (Zinpro ( Zinpro FED)<br />
–Actual Actual farm measurements<br />
–KISS KISS system to illustrate potential<br />
DBM 0061
http://www.livestocktrail.uiuc.edu<br />
http:// www.livestocktrail.uiuc.edu<br />
http://www.livestocktrail.uiuc.edu/dairynet<br />
http:// www.livestocktrail.uiuc.edu/dairynet/<br />
DBM 0061<br />
Page 8<br />
Questions<br />
?<br />
DBM 0061