Lee Jackson - Final Thesis - Economics - Stanford University
Lee Jackson - Final Thesis - Economics - Stanford University
Lee Jackson - Final Thesis - Economics - Stanford University

You also want an ePaper? Increase the reach of your titles
YUMPU automatically turns print PDFs into web optimized ePapers that Google loves.
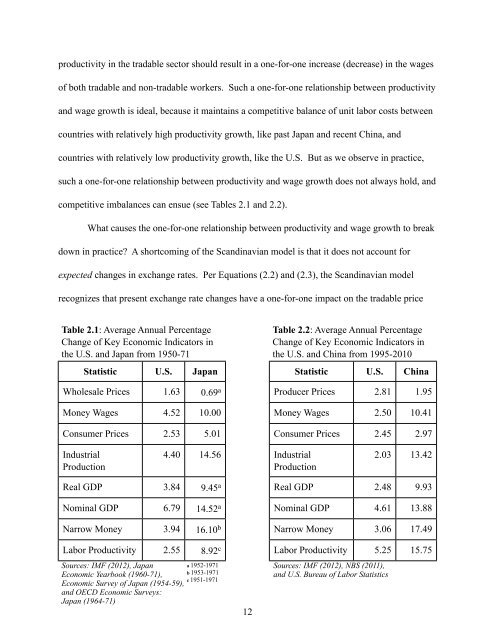
productivity in the tradable sector should result in a one-for-one increase (decrease) in the wages<br />
of both tradable and non-tradable workers. Such a one-for-one relationship between productivity<br />
and wage growth is ideal, because it maintains a competitive balance of unit labor costs between<br />
countries with relatively high productivity growth, like past Japan and recent China, and<br />
countries with relatively low productivity growth, like the U.S. But as we observe in practice,<br />
such a one-for-one relationship between productivity and wage growth does not always hold, and<br />
competitive imbalances can ensue (see Tables 2.1 and 2.2).<br />
What causes the one-for-one relationship between productivity and wage growth to break<br />
down in practice? A shortcoming of the Scandinavian model is that it does not account for<br />
expected changes in exchange rates. Per Equations (2.2) and (2.3), the Scandinavian model<br />
recognizes that present exchange rate changes have a one-for-one impact on the tradable price<br />
Table 2.1: Average Annual Percentage<br />
Change of Key Economic Indicators in<br />
the U.S. and Japan from 1950-71<br />
Statistic U.S. Japan<br />
Wholesale Prices 1.63 0.69 a<br />
Money Wages 4.52 10.00<br />
Consumer Prices 2.53 5.01<br />
Industrial<br />
Production<br />
4.40 14.56<br />
Real GDP 3.84 9.45 a<br />
Nominal GDP 6.79 14.52 a<br />
Narrow Money 3.94 16.10 b<br />
Labor Productivity 2.55 8.92 c<br />
Sources: IMF (2012), Japan<br />
a 1952-1971<br />
Economic Yearbook (1960-71),<br />
b 1953-1971<br />
c 1951-1971<br />
Economic Survey of Japan (1954-59),<br />
and OECD Economic Surveys:<br />
Japan (1964-71)<br />
12<br />
Table 2.2: Average Annual Percentage<br />
Change of Key Economic Indicators in<br />
the U.S. and China from 1995-2010<br />
Statistic U.S. China<br />
Producer Prices 2.81 1.95<br />
Money Wages 2.50 10.41<br />
Consumer Prices 2.45 2.97<br />
Industrial<br />
Production<br />
2.03 13.42<br />
Real GDP 2.48 9.93<br />
Nominal GDP 4.61 13.88<br />
Narrow Money 3.06 17.49<br />
Labor Productivity 5.25 15.75<br />
Sources: IMF (2012), NBS (2011),<br />
and U.S. Bureau of Labor Statistics