Fatigue behaviour of BS 2L65 aluminium alloy pin - aerade
Fatigue behaviour of BS 2L65 aluminium alloy pin - aerade
Fatigue behaviour of BS 2L65 aluminium alloy pin - aerade

You also want an ePaper? Increase the reach of your titles
YUMPU automatically turns print PDFs into web optimized ePapers that Google loves.
tg3<br />
ee3<br />
OO<br />
ee3<br />
6<br />
Z<br />
PROCUREMENT EXECUTIVE, MINISTRY<br />
Aeronautical Research Council<br />
Reports and Memoranda<br />
FATIGUE BEHAVIOUR OF <strong>BS</strong> <strong>2L65</strong><br />
R & M No.3835<br />
OF DEFENCE<br />
ALUMINIUM ALLOY PIN-LOADED LUGS<br />
WITH INTERFERENCE-FIT BUSHES<br />
by ...... ~<br />
J.E. Moon<br />
; 1 !~>,<br />
Structures Department, RAE Farnborough, Hants<br />
London" Her Majesty's Stationery<br />
£7 NET<br />
Office
UDC 620.178.3 : 669.715 : 621.886.1 : 621.886.4 : 621.822<br />
FATIGUE BEHAVIOUR OF <strong>BS</strong> <strong>2L65</strong> ALUMINIUM ALLOY PIN-LOADED LUGS<br />
WITH INTERFERENCE-FIT BUSHES<br />
By J. E. Moon<br />
Structures Department, RAE Farnborough, Hants<br />
REPORTS AND MEMORANDA No.3835"<br />
November 1977<br />
SUMMARY<br />
Cumulative fatigue damage has been studied in lugs with and without<br />
interference-fit bushes. <strong>Fatigue</strong> tests'have been carried out under constant and<br />
variable amplitude loading conditions and local stress measurements have been<br />
made using the Companion Specimen Method.<br />
Local stress measurements did not explain the large increase in life under<br />
constant amplitude loading associated with fitting an interference-fit bush in a<br />
<strong>pin</strong>-jointed lug, nor did they explain the reduction in life following a prestress<br />
on such a specimen. However, the stress measurements in sequences representing<br />
narrow band random loading were broadly consistent with actual fatigue test<br />
results, and enabled more accurate life estimations to be made at the lower mean<br />
stress tested, but at a high mean stress the measurements produced unsafe life<br />
estimates.<br />
* Replaces RAE Technical Report 77177 - ARC 37872
2<br />
4<br />
5<br />
LIST OF CONTENTS<br />
INTR0 DUCTION 3<br />
FATIGUE TESTS 4<br />
2.1 Material and specimens 4<br />
2°2 <strong>Fatigue</strong> tests and results 5<br />
2.3 Life estimations and comparison with achieved performances 7<br />
LOCAL STRESS HISTORY MEASURI~ENTS 7<br />
3. I Method <strong>of</strong> measurement 8<br />
3.2 Material and specimens 8<br />
3.3 Summary <strong>of</strong> tests carried out 8<br />
3.4 Results 9<br />
DISCUSSION I 0<br />
4. I Effect <strong>of</strong> passivating bushes 10<br />
4.2 The effect <strong>of</strong> an interference-fit bush on the life <strong>of</strong> a lug 10<br />
under constant amplitude loading<br />
4.3 The effect <strong>of</strong> a prestress on bushed and unbushed lugs under 12<br />
constant amplitude loading<br />
4.4 The performance <strong>of</strong> bushed lugs under narrow band random 14<br />
loading<br />
CONCLUSIONS<br />
Appendix A Local stresses in a bushed lug<br />
Appendix B <strong>Fatigue</strong> testing facility and load spectra<br />
Appendix C Cumulative damage calculations made using Miner's Rule<br />
Appendix D Method <strong>of</strong> life estimation allowing for residual stresses<br />
Table I Chemical composition and tensile properties <strong>of</strong> <strong>BS</strong> <strong>2L65</strong><br />
<strong>aluminium</strong> <strong>alloy</strong><br />
Table 2 <strong>Fatigue</strong> test results<br />
Table 3 <strong>Fatigue</strong> test results<br />
Table 4 <strong>Fatigue</strong> test results<br />
Table 5 <strong>Fatigue</strong> test results<br />
Table 6 <strong>Fatigue</strong> test results<br />
Table 7 <strong>Fatigue</strong> test results<br />
Table 8 <strong>Fatigue</strong> test results<br />
Table 9 <strong>Fatigue</strong> test results<br />
Re feren~e s<br />
Illustrations<br />
Detachable abstract cards<br />
17<br />
19<br />
2O<br />
21<br />
22<br />
23<br />
24<br />
25<br />
26<br />
27<br />
27<br />
28<br />
28<br />
29<br />
3O<br />
Figures 1-43
I INTRODUCTION<br />
A lug loaded by a clearance fit <strong>pin</strong> is a structural feature which has a<br />
comparatively poor fatigue performance because fretting damage caused by relative<br />
movement between the <strong>pin</strong> and lug bore occurs at a position <strong>of</strong> high stress<br />
concentration and therefore leads to early crack initiation.<br />
It has been found that the use <strong>of</strong> an interference-fit <strong>pin</strong> or bush can<br />
greatly improve this performance, at least under constant amplitude conditions1°<br />
For ease <strong>of</strong> assembly and maintenance it is usual practice to employ an inter-<br />
ference-fit bush with a clearance fit <strong>pin</strong> rather than just a force fit <strong>pin</strong> as the<br />
bush can be inserted into a sub-assembly whereas the <strong>pin</strong> has to be pressed into<br />
a final assembly. The interference creates a compressive radial stress and a<br />
tensile hoop stress in the lug in a similar manner to a cylinder under internal<br />
pressure and it is generally believed that there are two main reasons why an<br />
interference fit can improve the fatigue life <strong>of</strong> lugs 2. First, the frictional<br />
force created by the radial stress decreases the amount <strong>of</strong> slip between the hole<br />
bore and <strong>pin</strong> (or bush), and should therefore reduce the fretting damage. Second,<br />
there is a reduction in the tangential stress amplitude at the point <strong>of</strong> crack<br />
initiation. However, the interference does cause an increase in the local mean<br />
stress which can be damaging in fatigue, but this is generally assumed to be <strong>of</strong><br />
only minor importance when compared with the reduction in amplitude. A fuller<br />
explanation <strong>of</strong> the effect <strong>of</strong> the bush on local stresses can be found in<br />
Appendix A.<br />
The majority <strong>of</strong> research carried out investigating interference fits has<br />
used constant amplitude loading, as in Refs I, 3 and 4, whereas components in<br />
service usually experience load spectra which are <strong>of</strong> variable amplitude and<br />
frequently random. It is well known that the use <strong>of</strong> constant amplitude loading<br />
in fatigue evaluation can give misleading results. For example, whereas there<br />
is a marked effect <strong>of</strong> fretting pad length on the life <strong>of</strong> a simple plain specimen<br />
under constant amplitude loading~ the difference is greatly reduced under loading<br />
which simulates service conditions 5. In addition Smith 6 found that whereas a<br />
single tensile prestress applied to an unbushed lug before a constant amplitude<br />
fatigue test increased the life, the reverse was true for the case <strong>of</strong> a lug<br />
fitted with an interference fit bush. This implies that large load peaks in a<br />
random spectrum may have a much different effect on a bushed lug than one with<br />
just a clearance fit <strong>pin</strong>. It was therefore decided that in this programme, in<br />
addition to constant amplitude fatigue tests <strong>of</strong> bushed and unbushed lugs, both<br />
3
4<br />
would be tested under narrow band random loading to simulate service conditions<br />
in a simple way. This work is reported in section 2 which includes life predic-<br />
tions for the random loading cases using Miner's Rule.<br />
It has been shown that in many cases more accurate life estimations can be<br />
made by considering the actual state <strong>of</strong> stress at the point <strong>of</strong> crack initiation,<br />
rather than net section stresses. Section 3 presents local stress history<br />
measurements in bushed and unbushed lugs using the Companion Specimen Method 7<br />
which were made in order to try to explain some <strong>of</strong> the observed fatigue <strong>behaviour</strong><br />
and if possible to improve the life estimations made.<br />
2 FATIGUE TESTS<br />
All the results quoted for the unbushed lugs have been reported previously 8,<br />
having been carried out as part <strong>of</strong> an earlier investigation. However, for<br />
completeness, a full description is given <strong>of</strong> the specimens and tests for both<br />
the unbushed and the bushed lug tests.<br />
2.1 Material and specimens<br />
All lugs, bushed and unbushed, were manufactured from bars <strong>of</strong> <strong>BS</strong> <strong>2L65</strong><br />
<strong>aluminium</strong> <strong>alloy</strong> material obtained from one melt. The chemical analysis provided<br />
by the manufacturers and tensile properties obtained from test pieces cut from<br />
the same batch <strong>of</strong> material, are given in Table I.<br />
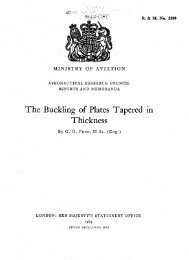
Fig I shows the unbushed lug specimen which was <strong>pin</strong>-loaded at each end.<br />
The same specimen was adapted to a bushed lug as shown in Fig 2 by enlarging one<br />
<strong>of</strong> the holes and fitting a bush to accept the same size <strong>of</strong> <strong>pin</strong>; in this form<br />
only the bushed hole was <strong>pin</strong>-loaded, the other end being clamped by wedge grips.<br />
As the bushed and unbushed lugs had the same gross cross-section and <strong>pin</strong> size<br />
they can be regarded as interchangeable components for the purpose <strong>of</strong> comparing<br />
fatigue performance.<br />
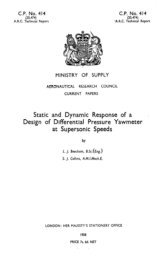
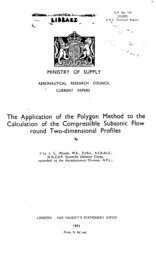
The bush, shown in Fig 3, was made <strong>of</strong> $80 stainless steel and cadmium<br />
plated on its outer surface to prevent corrosion where the steel is in contact<br />
with the <strong>aluminium</strong> lug. For purposes <strong>of</strong> comparison, some bushes underwent a<br />
passivating process following plating, and some were untreated. The passivation<br />
process is normal practice following cadmium plating and gives greater resistance<br />
to corrosion. The bush had a nominal 0°27% interference in the lug, and in order<br />
to facilitate insertion, was placed on a mandrel and cooled in liquid nitrogen.<br />
The lug, preheated to 115°C was aligned in a jig below the bush and thus the<br />
possibility <strong>of</strong> scoring the hole bore was minimised.
Loading <strong>pin</strong>s were manufactured from S94 steel, and in the case <strong>of</strong> the<br />
unbushed lugs had a diametral clearance <strong>of</strong> between 0.03% and 0.21% <strong>of</strong> diameter<br />
in the lug, while in the case <strong>of</strong> the bushed lugs the clearance in the bush was<br />
between 0.63% and 0.74% <strong>of</strong> diameter, the larger clearance being necessary to<br />
prevent seizure between the steel <strong>pin</strong> and bush.<br />
2.2 <strong>Fatigue</strong> ' tests and results<br />
All the fatigue tests were carried out on a modified Schenck resonant<br />
machine which was capable <strong>of</strong> applying either constant amplitude or narrow band<br />
random loading. Further details <strong>of</strong> the machine and waveforms applied are to be<br />
found in Appendix B. Loads were monitored throughout tests by measuring the<br />
root mean square value and displaying this on a pen recorder.<br />
In this report stresses are quoted primarily in terms <strong>of</strong><br />
~ Load<br />
Pin bearing stress = nominal <strong>pin</strong> diameter x lug thickness<br />
so that a direct comparison can be made between equivalent bushed and unbushed<br />
components carrying the same load. The use <strong>of</strong> net area stress is less satisfac-<br />
tory because the two types <strong>of</strong> lug have different net areas due to the presence<br />
<strong>of</strong> the bush and thus would sustain a different load for the same net stress; in<br />
addition, the designer is <strong>of</strong>ten concerned with <strong>pin</strong> loads in a joint design.<br />
However, to aid understanding and interpretation~ values <strong>of</strong> net stress, based on<br />
the unbushed lug net area, are given in brackets following the <strong>pin</strong> bearing stress.<br />
<strong>Fatigue</strong> tests on lugs fitted with interference fit bushes were carried<br />
out under the following loading conditions:<br />
(a) Constant amplitude loading over a range <strong>of</strong> stress amplitudes at two levels<br />
(b)<br />
(c)<br />
<strong>of</strong> tensile mean stress.<br />
Constant amplitude loading following two values <strong>of</strong> prestress. A prestress<br />
is defined as a single large tensile stress applied at the beginning <strong>of</strong><br />
the test and then reduced to the mean stress <strong>of</strong> the subsequent fatigue<br />
test.<br />
Narrow Band Random (NBR) loading at two levels <strong>of</strong> tensile mean stress.<br />
In the above tests the steel bushes were not passivated following cadmium<br />
plating, whereas it is normal practice in the aircraft industry to passivate<br />
bushes. In order to investigate the effect <strong>of</strong> this process further tests were<br />
carried out using lugs fitted with passivated bushes under:
6<br />
(d) Constant amplitude loading over a range <strong>of</strong> stress amplitudes at one tensile<br />
mean stress°<br />
(e) Narrow Band Random loading at two rms levels <strong>of</strong> alternating stress and one<br />
tensile mean stress.<br />
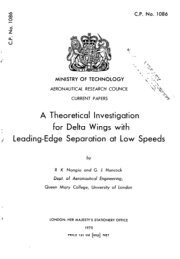
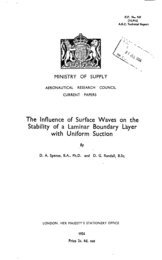
Specimens were tested to failure or 10 7 cycles, whichever occurred first.<br />
Cracks were initiated by fretting between the bush and lug hole and led to<br />
failure through the net section. A typical failure is shown in Fig 4.<br />
The following table details the locations <strong>of</strong> the tabulated results and<br />
associated S-N curves for each condition.<br />
Form <strong>of</strong> Loading<br />
Constant amplitude<br />
~R<br />
tt<br />
It<br />
t! !I<br />
T! It<br />
It<br />
Mean<br />
stress<br />
MN/m 2<br />
153 (95)<br />
153 (95)<br />
225 (14o)<br />
153 (95)<br />
153 (95)<br />
153 (95)<br />
153 (95)<br />
225 (14o)<br />
Prestress<br />
gN/m 2<br />
0<br />
0<br />
0<br />
4o2 (25o)<br />
474 (294)<br />
0<br />
0<br />
0<br />
Bushes<br />
passivated<br />
No<br />
Yes<br />
No<br />
No<br />
No<br />
No<br />
Yes<br />
No<br />
Table<br />
No.<br />
2<br />
3<br />
4<br />
5<br />
6<br />
7<br />
8<br />
9<br />
Fig No.<br />
5<br />
6<br />
7<br />
i<br />
Fig No. <strong>of</strong><br />
comparison<br />
I0<br />
i ii i,<br />
8 ~13<br />
The S-N curves are based on a faired line passing as close as possible to<br />
the log mean endurances at each stress level. All failed specimens are indicated<br />
on these figures by a circle and dot, whilst a circle with an arrow indicates an<br />
unbroken specimen.<br />
In Figs 10-13 where comparisons are made <strong>of</strong> results under different condi-<br />
tions, individual test points are omitted for clarity.<br />
The unbushed lug data plotted in the comparison graphs, Figs 11-13, were<br />
obtained in an earlier investigation 8 and only the faired S-N curves are<br />
presented in this report.
2.3 Life. ' estimations and comparison with achieved performance<br />
Miner's Rule is the most common method <strong>of</strong> predicting the life <strong>of</strong> components<br />
under service loading using data obtained in the laboratory under more simple<br />
loading, usually constant amplitude. Briefly, it sums linearly the damage<br />
accumulated by the various levels <strong>of</strong> alternating stress contained in the service<br />
spectrum. Miner's Rule was used to predict the lives <strong>of</strong> lugs under random<br />
loading using constant amplitude data, as described in Appendix C for the<br />
following cases:<br />
(a) NBR loading at 153 (95) MN/m 2 mean stress using constant amplitude<br />
data at that mean stress. The results for the passivated bushes<br />
data is plotted in Fig 14, along with the achieved performance curve.<br />
(b) As (a) but for the ease <strong>of</strong> unpassivated bushes. As only one rms<br />
stress level was used at this mean stress the result is not plotted<br />
on an S-N diagram, but is included in Fig 16, which compares the<br />
accuracy <strong>of</strong> Miner's Rule for various conditions and will be explained<br />
later.<br />
(c) NBR loading at 225 (140) MN/m 2 mean stress using constant amplitude<br />
data obtained at the same mean stress. The results for unpassivated<br />
bushes are compared with the achieved performance in 9~ig 15.<br />
The accuracy <strong>of</strong> Miner's Rule is usually judged by the ratio:<br />
~ achieved life<br />
predicted life<br />
Thus values <strong>of</strong> D > 1 indicate a conservative or safe prediction, whereas<br />
values < I indicate an optimistic or unsafe prediction. The results <strong>of</strong> the<br />
e~%lculations for the conditions (a), (b) and (c) were used to obtain values <strong>of</strong><br />
~, which are all plotted in Pig 16.<br />
For comparison, values <strong>of</strong> Z ~ n for unbushed lugs under NBR loading are<br />
plotted in Fig 17.<br />
3 LOCAL STRESS HISTORY MFASURmENTS<br />
The interference modifies the initial stress state in the lug and it is<br />
widely believed that it also reduces the local stress amplitude at the point <strong>of</strong><br />
crack initiation. It was therefore decided to study the local stress history in<br />
a bushed lug in order to aid understanding <strong>of</strong> the ways in which a bush can affect<br />
7
8<br />
the fatigue life <strong>of</strong> a lug. Theoretical analysis <strong>of</strong> the interference fit case is<br />
difficult, so it was decided to make direct measurements on the lug using the<br />
Companion Specimen Method 7.<br />
3. I Method <strong>of</strong> measurement<br />
Briefly, the Companion Specimen Method consists <strong>of</strong> reproducing on a plain<br />
specimen the stress and strain history at a position <strong>of</strong> stress concentration on<br />
another specimen. A strain gauge is attached at the point <strong>of</strong> interest in the<br />
latter specimen, generally where the fatigue crack is likely to start, and the<br />
strain history is recorded whilst the specimen is subjected to the desired load<br />
sequence. The recorded strain sequence is then applied to a plain specimen,<br />
made <strong>of</strong> the same material as the component, and by measuring the loads applied,<br />
the corresponding stress history in the component is determined.<br />
3.2 Material aud s~ecimens<br />
All lug and plain specimens were cut from 2 bars <strong>of</strong> <strong>BS</strong> <strong>2L65</strong> <strong>aluminium</strong><br />
<strong>alloy</strong> from the same melt as those used in the fatigue test programme. The lug<br />
specimen is shown in Fig 18 and the bush <strong>of</strong> $80 steel material in Fig 19. At<br />
one end <strong>of</strong> the lug the hole was enlarged to accept a bush having a 0.27%<br />
(0.076 ram) diametral interference, to be loaded by a 25.4 mm diameter <strong>pin</strong>. The<br />
other end was machined to take the <strong>pin</strong> alone without the bush to enable a direct<br />
comparison to be made between a bushed hole and an equivalent unbushed hole.<br />
Thus the specimen represented exactly the bushed and unbushed lugs used in the<br />
fatigue test programme. The strain gauges in both holes were placed as shown<br />
in Fig 18, mid-way through the thickness <strong>of</strong> the lug. In order to clear the<br />
gauge the bush had a hole drilled in its centre and was split, half being<br />
inserted from each side, see Fig 19. The gauge was attached to the lug before<br />
inserting the bush, in this way the strain due to the bush alone could be<br />
measured. The loading <strong>pin</strong>s had a slot milled along their length to accommodate<br />
the gauge leads in the bushed hole, and both the gauge and its leads in the<br />
unbushed hole. The plain specimen is shown in Fig 20.<br />
3.3 Summarry <strong>of</strong> t_ ests carried_~out.<br />
The load sequences employed, shown in Fig 21, were designed to represent,<br />
in a simple way, the essential features <strong>of</strong> the fatigue tests reported in<br />
section 2, as it was hoped that the Companion Specimen data could be used to aid<br />
interpretation <strong>of</strong> the fatigue test results.
Sequence (a) was designed to investigate the effect <strong>of</strong> prestress on local<br />
stress during subsequent constant amplitude loading. It represented tests at an<br />
rms alternating stress <strong>of</strong> 64 (40) MN/m 2 and a mean <strong>of</strong> 153 (95) MN/m 2 with three<br />
nominal values <strong>of</strong> prestress:<br />
(1) 0<br />
(2) 402 (250) MN/m 2<br />
(3) 474 (294) MN/m 2<br />
Previous experience using the Companion Specimen Method on a similar<br />
material indicated that applying the two prestresses in sequence would not have<br />
produced a different result to applying them separately on virgin specimens.<br />
Sequence (b) was designed to represent narrow band random loading at<br />
153 (95) MN/m 2 mean stress. Section 2 presented results <strong>of</strong> fatigue tests at two<br />
levels <strong>of</strong> rms alternating stress under these conditions and this sequence<br />
enabled the local stress <strong>behaviour</strong> to be compared before and after a load<br />
representing the highest peak in each spectrum.<br />
Sequence (c) was similar in principle to sequence (b) except that it was<br />
designed to help interpret random fatigue tests carried out at a mean stress <strong>of</strong><br />
225 (14o) MN/m 2.<br />
3.4 Results<br />
Fig 22 is a typical example <strong>of</strong> a graph for a bushed hole <strong>of</strong> local strain<br />
vs <strong>pin</strong> bearing stress, this particular plot being for a specimen loaded through<br />
sequence (a), simulating the prestressed constant amplitude tests. The corres-<br />
ponding local stress vs local strain diagram obtained from a plain specimen is<br />
shown in Fig 23. For comparison Fig 24 shows a <strong>pin</strong> bearing stress vs local strain<br />
diagram obtained from an unbushed hole under the same conditions, and Fig 25 is<br />
the corresponding local stress vs local strain diagram. These graphs, along with<br />
similar ones for the other sequences were analysed in order to obtain the local<br />
stress range and local mean stress during each load cycle. These results were<br />
then used to construct the following graphs:<br />
Figs 26 and 27 - Comparison <strong>of</strong> local stress histories in a bushed and an<br />
unbushed lug under constant amplitude loading, at 2 mean stresses.<br />
Fig 28 - The effect <strong>of</strong> a prestress on local stress histories in a bushed<br />
and an unbushed l~under constant amplitude loading.<br />
Figs 29-33 - The effect <strong>of</strong> peak stress in a random spectrum on local stress<br />
histories during subsequent smaller net stress cycles, at 2 mean stresses<br />
and several rms alternating stresses.
10<br />
4 DISCUSSION<br />
4.1 ~ s i v a t i n g bushes<br />
It is normal practice, when using a steel bush in an <strong>aluminium</strong> <strong>alloy</strong> lug,<br />
to cadmium plate the bush. Plating is usually followed by a passivation process,<br />
which consists <strong>of</strong> dip<strong>pin</strong>g the bush in a solution that deposits a fine chromate<br />
layer on the cadmium plating, in order to give a greater resistance to corrosion.<br />
Most <strong>of</strong> the bushes used in this programme were cadmium plated but not passivated;<br />
however a limited number were treated in order to assess the effect <strong>of</strong><br />
passivation.<br />
Fig 10 shows only a small effect <strong>of</strong> passivation on life under constant<br />
amplitude loading over most <strong>of</strong> the alternating stress range. The most signifi-<br />
cant effect was at the longer endurances, where the fatigue strength was reduced<br />
by about 45% in the passivated case° This effect was probably due to an increase<br />
in fretting damage brought about by the hard chromate particles deposited in the<br />
passivation process.<br />
Only a limited number <strong>of</strong> specimens were available to assess the effect <strong>of</strong><br />
passivation under NBR loading. The results, presented in Fig 8, did not show<br />
any significant effect. However, an insufficient number <strong>of</strong> specimens were tested<br />
to draw any definite conclusion. The possibility that passivation affects the<br />
fretting damage would be less under random loading, as large load peaks in the<br />
spectrum are likely to cause earlier crack initiation than under constant<br />
amplitude loading.<br />
4.2 The effect <strong>of</strong> an interference-fit bush on the life <strong>of</strong> a lu~ under constant<br />
amplitude loadin~<br />
When comparing the <strong>behaviour</strong> <strong>of</strong> bushed and unbushed lugs, it should be<br />
remembered, as stated in section 2.1 that the unbushed lugs were double ended,<br />
whereas the bushed lugs were <strong>pin</strong>-loaded at one end only. Thus, in the unbushed<br />
case, failure occurred at the weaker <strong>of</strong> two holes° This caused a slight lowering<br />
<strong>of</strong> the log mean life, but it is considered that this was <strong>of</strong> only small magnitude,<br />
because <strong>of</strong> the small scatter exhibited by <strong>pin</strong>-loaded lugs.<br />
Fig 11 shows log mean endurance curves for lugs with and without bushes.<br />
Comparing the bushed and unbushed performance first at the lower mean stresses,<br />
which were similar in the two cases, it will be noted that the effect <strong>of</strong> the<br />
interference was to increase fatigue life considerably, which is in accordance<br />
with the findings <strong>of</strong> other workers 1'2'3'4. It should be pointed out that the
curve presented for the bushed lugs is for the case <strong>of</strong> passivated bushes. The<br />
effect <strong>of</strong> increasing the mean stress was to reduce performance <strong>of</strong> both the bushed<br />
and unbushed lugs, the effect being much more damaging in the bushed case even<br />
though the change in mean stress was less. Furthermore, whereas the S-N curves<br />
for the unbushed lugs at the two mean stresses tended to converge at long<br />
endurances, this was not so for the bushed lugs and the increased mean stress<br />
caused a reduction <strong>of</strong> about 64% in fatigue strength at around 4 x 10⁶ cycles.<br />
The reduction was so great that the S-N curve for the bushed lugs crossed over<br />
both unbushed curves. This result was checked by testing 4 unbushed lugs at<br />
225 (140) MN/m 2 mean stress and an rms alternating stress <strong>of</strong> 8 (5) MN/m 2. None<br />
<strong>of</strong> the unbushed specimens failed after 107 cycles, whereas 4 bushed specimens<br />
had all failed with a log mean endurance <strong>of</strong> 5 x 10⁶ cycles at the same stress<br />
level, confirming that bushed lugs had an inferior performance to the unbushed<br />
lugs at 225 (140) MN/m 2 mean stress and low alternating stress. It was found<br />
that the main effect <strong>of</strong> passivating bushes under constant amplitude loading at<br />
the low mean stress was to reduce the fatigue strength at long lives. As the<br />
increased mean stress reduced this strength to a very low value it seems probable<br />
that passivating bushes would have little if any effect at the high mean stress.<br />
Reference can now be made to the local stress measurements to see if they<br />
explain the observed fatigue <strong>behaviour</strong>. From the changes in local stress during<br />
the first occurrence <strong>of</strong> each magnitude <strong>of</strong> stress cycle in sequence (b) and (c)<br />
<strong>of</strong> Fig 21~ the local mean stress and stress range can be calculated for bushed<br />
and unbushed lugs over a range <strong>of</strong> alternating stresses at the two mean stresses.<br />
This information can be found in Figs 26 and 27. This shows that in general,<br />
during any net stress cycle, the local stress history in the bushed lug displayed<br />
a higher mean stress and a lower alternating stress than the unbushed lug, which<br />
agrees with the ideas put forward in the introduction.<br />
The next step was to quantify these findings in terms <strong>of</strong> effect on life.<br />
In order to construct a local mean-local alternating stress diagram for unbushed<br />
lugs over a range <strong>of</strong> fatigue lives, an S-N curve had to be constructed for<br />
unbushed lugs at 225 (140) MN/m 2 mean stress. This was done by using the results<br />
<strong>of</strong> constant amplitude tests at three mean stresses 8 to draw Fig 34 which is a<br />
net alternating-net mean stress diagram for unbushed lugs. The constructed S-N<br />
curve derived from this is shown in Fig 37 as the dotted line. The local stress<br />
diagrams for constant amplitude loading in Figs 26 and 27 can then be used with<br />
the unbushed S-N curves to construct the local mean-local alternating stress<br />
11
12<br />
diagram <strong>of</strong> Fig 35. The local stress diagrams <strong>of</strong> Figs 26 and 27 were then used<br />
with this mean-alternating stress diagram to estimate the lives <strong>of</strong> the bushed<br />
lugs over the range <strong>of</strong> net stresses applied. These estimates are plotted along<br />
with the achieved bushed and unbushed performances in Figs 36 and 37.<br />
Considering first Fig 36, which compares the estimated and achieved<br />
performances at mean stress = 153 (95) NN/m2 it can be seen that the local<br />
stress measurements predicted that fitting a bush would produce a small improve-<br />
ment in endurance over an unbushed lug, typically increasing endurance by a<br />
factor <strong>of</strong> 1.5-2. However, the actual achieved performance <strong>of</strong> a bushed lug was<br />
approximately 6-7 times greater than an unbushed lug over most <strong>of</strong> the alternating<br />
stress range. The predicted and achieved performance curves only converged at<br />
low alternating stresses° Thus, although the local stress measurements predicted<br />
that an interference fit bush should give rise to some improvement in life, the<br />
actual achieved performance was much greater. A possible explanation is that the<br />
interference did reduce fretting damage significantly, and this is the main<br />
reason for the large increase in endurance observed in fatigue tests.<br />
Turning next to Fig 37, which is similar to Fig 36 just described, except<br />
that the mean stress was 225 (140) NN/m 2, it will be noted that the local stress<br />
measurements predicted that the bush would increase endurance <strong>of</strong> the unbushed<br />
lug by a small amount over all the stress range. Again the predictions were in<br />
poor agreement with the observed fatigue <strong>behaviour</strong>. At higher alternating stresses<br />
the bushed lug demonstrated a large increase in performance, which was possibly<br />
due to the reduced fretting damage. However, at low alternating stresses the<br />
performance <strong>of</strong> the bushed lugs was inferior to that <strong>of</strong> the unbushed lugs despite<br />
the fact that local stress measurements indicated that the reverse should have<br />
occurred. This is difficult to understand and does not support the earlier<br />
supposition about the reduced effect <strong>of</strong> fretting.<br />
4.3 The effect <strong>of</strong> aLprestress on bushed an d unbushed lugs under constant<br />
~.~litude loading<br />
As stated earlier, it has already been established by several workers that<br />
t~e ~.~se <strong>of</strong> an i~terference fit bush can improve the f~tigue life <strong>of</strong> lugs under<br />
constant amplitude loading. The main purpose <strong>of</strong> this programme was to investi-<br />
gate the effects <strong>of</strong> bushing under variable amplitude loading. Smith 6 has<br />
reported that whereas a single tensile prestress applied at the beginning <strong>of</strong> a<br />
fatigue test could improve the life <strong>of</strong> an unbushed lug, the reverse was true for<br />
the case <strong>of</strong> a bushed lug. This result implies that large load peaks in a
variable amplitude spectrum may have a much different effect on a bushed lug<br />
from that on one with just a clearance fit <strong>pin</strong>. It was decided to check Smith's<br />
results on the particular lug used in this investigation. Two levels <strong>of</strong> prestress<br />
were applied to bushed lugs at one level <strong>of</strong> rms alternating stress. Results were<br />
available from an earlier investigation 8 for unbushed lugs with similar levels <strong>of</strong><br />
prestress. Fig 12 compares the <strong>behaviour</strong> <strong>of</strong> the bushed and unbushed lugs<br />
subject to a prestress. The constant amplitude curves for no prestress have been<br />
drawn for both bushed and unbushed lugs, and are compared with log mean endurances<br />
at one level <strong>of</strong> rms alternating stress for the prestressed results. It can be<br />
seen that a prestress had opposite effects on bushed and unbushed lugs, repeating<br />
Smith's findings. In the case <strong>of</strong> the unbushed lug, a prestress increased fatigue<br />
life, the larger the prestress, the larger the increase. However, the effect <strong>of</strong><br />
a prestress on a bushed lug was to reduce life, the larger the prestress, the<br />
greater the reduction. It should be noted that the prestresses applied were<br />
fairly large, being approximately in the range 0.5-0.6 <strong>of</strong> the ultimate tensile<br />
strength.<br />
Seguence (a) used in the local stress measurements, shown in Fig 21, was<br />
designed to investigate the effect <strong>of</strong> two levels <strong>of</strong> prestress on local stress<br />
during subseguent constant amplitude loading, and the results are plotted in<br />
Fig 28 which shows the effect <strong>of</strong> the prestresses on local stress range and local<br />
mean stress. Considering first the effect <strong>of</strong> prestress on an unbushed lug it<br />
can be seen that the local stress range was virtually unaffected by both values<br />
<strong>of</strong> prestress. However, the mean stress was reduced by 57% and 93% respectively<br />
by the two values <strong>of</strong> prestress. This <strong>behaviour</strong> is attributed to the creation <strong>of</strong><br />
compressive residual stresses following local tensile yielding which led to the<br />
observed increase in fatigue life. This is a well known phenomenon and there are<br />
design codes, such as the ESDU rule 9 which can be used to take account <strong>of</strong> it in<br />
life prediction. Turning next to the case <strong>of</strong> the bushed lug the two values <strong>of</strong><br />
prestress increased the local stress range by 7% and 11% respectively. Reference<br />
should again be made to Appendix A for an explanation <strong>of</strong> this effect. The local<br />
mean stress was reduced slightly more than in the case <strong>of</strong> the unbushed lug. The<br />
beneficial effect <strong>of</strong> reduced mean stress would be expected to oppose the detri-<br />
mental effect <strong>of</strong> the increased stress range. Taking the case <strong>of</strong> the higher<br />
prestress and using fatigue test data presented in this report, the observed 11%<br />
increase in stress amplitude would be expected to reduce the life by about 40%.<br />
However, the reduction in mean stress in the case <strong>of</strong> the unbushed lug caused an<br />
13
14<br />
increase in endurance <strong>of</strong> 160%. As there was a greater reduction in mean stress<br />
for the case <strong>of</strong> the bushed lug, an equal, if not greater effect on life would be<br />
anticipated which would more than <strong>of</strong>fset the effect <strong>of</strong> the increase in stress<br />
range. As the fatigue tests showed a reduction in life following a prestress,<br />
this cannot be attributed to the change in local stress conditions described<br />
above. Other possible explanations include:<br />
(i) An increase in fretting damage caused by a relief in radial stress.<br />
(ii) The presence <strong>of</strong> very high stress gradients such that the strain gauge was<br />
not responding to the true local stress situation.<br />
Both these points are currently being investigated using the Moir~ Fringe<br />
Method. This will give the in-plane surface strains on the lug following bush<br />
insertion and will study the effect <strong>of</strong> several values <strong>of</strong> preload.<br />
4.4 ~erformance <strong>of</strong> bushed l~ under narrow band random loading "<br />
The performance <strong>of</strong> bushed and unbushed lugs was also compared under NBR<br />
loading at different mean stresses. It should be noted that the use <strong>of</strong> a<br />
resonant machine for this evaluation is not entirely satisfactory because for a<br />
given level <strong>of</strong> alternating stress, the amplitude distribution tends to vary with<br />
mean stress and specimen type. This is due to the large change in stiffness <strong>of</strong><br />
the double <strong>pin</strong>ned lug as the load passes through zero during large negative-going<br />
amplitudes, resulting in truncation <strong>of</strong> the largest amplitudes, and it follows<br />
that truncation <strong>of</strong> the high alternating stresses will be more pronounced for low<br />
values <strong>of</strong> mean stress.<br />
Fig 13 indicates that whereas there is only a very small effect <strong>of</strong> mean<br />
stress on unbushed lugs, there is a pronounced effect on bushed lugs; this is<br />
similar to the results under constant amplitude loadingo However, the question<br />
<strong>of</strong> relative sensitivity <strong>of</strong> constant amplitude and NBR performance to mean stress<br />
level is more accurately examined by studying life predictions based on load<br />
spectra which were actually achieved, and using the appropriate constant amplitude<br />
data.<br />
As outlined in section 2.3, Miner's Rule was used to estimate the endurances<br />
<strong>of</strong> the lugs. The predictions for the bushed lugs are plotted along with the<br />
achieved performances in ~j~ 1~and 15. These results were used to plot Fig 16,<br />
! achieved life l<br />
which presents values <strong>of</strong> L = predicted life'~ uncer all conditions. It<br />
will be noted that under most conditions Miner's Rule using nominal stresses was
conservative, the exception being for the case <strong>of</strong> the unpassivated bushes at the<br />
lower mesA% stress<br />
where~ ~. was just less than one. Similar results are plotted<br />
in Fig 17 for unbushed lugs, which shows ~.~ varying from 1.5-4.75 for the<br />
cases considered. Thus Miner's Rule was generally conservative for both bushed<br />
and unbushed lugs under NBR loading.<br />
Refe~ng to the earlier discussion <strong>of</strong> the effect <strong>of</strong> mean stress; similar<br />
values <strong>of</strong> n were obtained at the two mean stresses and therefore as there<br />
was a large effect <strong>of</strong> mean stress under constant amplitude loading it follows<br />
that there is a similarly large effect under NBR loading. This contrasts with<br />
the <strong>behaviour</strong> <strong>of</strong> unbushed lugs which exhibit only a small effect <strong>of</strong> mean stress<br />
under both constant and variable amplitude loading 8.<br />
Local stress measurement sequences (b) and (c) <strong>of</strong> Fig 21 were designed to<br />
look at the local stress histories in bushed and unbushed lugs under simulated<br />
random loading. Considering first sequence (b) which simulates NBR loading at<br />
a mean stress <strong>of</strong> 153 (95) MN/m 2, the local stress history measurements for this<br />
sequence are presented in Figs 29 and 30. These figures show the effect <strong>of</strong> the<br />
largest peak stress in a fatigue test at two particular rms stress levels, on<br />
subsequent smaller cycles in the spectrum. Thus the local stress ranges and<br />
local mean stresses are plotted for the case before and after the largest<br />
peak stress. The effects observed in general were not as great as for sequence<br />
(a) described earlier, although similar basic trends can be identified as<br />
follows:<br />
(i) Effect on local mean stress<br />
The peak stress in the spectra reduced the local mean stress <strong>of</strong> subsequent<br />
smaller cycles by inducing compressive residual stresses. The reduction was<br />
generally not as great in the bushed case as in the unbushed one. Due to this<br />
effect alone, Miner's Rule would be expected to be conservative for both bushed<br />
T-~<br />
and unbushed lugs, although ~ would be slightly higher for the unbushed lug.<br />
(it) Effect on local alternatin G stress<br />
The peak stress had only a small effect on stress range for both bushed and<br />
unbushed lugs, which would not be expected to affect significantly the life<br />
prediction <strong>of</strong> either lug.<br />
As these local stress measurements were broadly consistent with the observed<br />
fatigue <strong>behaviour</strong> it was decided to use them to make modified predictions <strong>of</strong> the<br />
fatigue lives. This was done by adjusting the constant amplitude S-N curve<br />
15
16<br />
used in the calculations, allowing for the reduction in mean stress. The method<br />
adopted is described more fully in Appendix D. For the case <strong>of</strong> meau stress =<br />
153 (95) MN/m 2 the method was only applied to the tests using passivated bushes,<br />
since this is the normal practical situation. The results are summarised in<br />
Fig 38 whloh presents values <strong>of</strong> over the alternating stress range tested.<br />
It can be seen that the life predictions were more accurate than those in which<br />
no allowance was made for residual stresses, although at the higher rms stress<br />
the estimate was on the unsafe side, ~ N being 0.75.<br />
Turning next to sequence (c), which simulated N~R loading at a mean stress<br />
<strong>of</strong> 225 (140) ~/m 2, the results <strong>of</strong> the local stress measurements are presented<br />
in Figs 31-33, each figure representing a random spectrum at a particular rms<br />
alternating stress level. Thus each figure shows the effect <strong>of</strong> the peak stress<br />
at a particular rms stress level on the local stress histories during subsequent<br />
smaller load cycles"<br />
(i) Effect on local mean stresses<br />
Before the application <strong>of</strong> the peak stress~ the mean stress in the bushed<br />
lug was slightly higher than that in the unbushed lug for the same net stress<br />
range due to the initial interference hoop stress. It can be seen that at all<br />
three rms stress levels the peak stress in each spectrum reduced the local mean<br />
stress under subsequent loading in both the bushed and unbushed lugs. The<br />
reduction was approximately the same in both cases~ and was larger for the higher<br />
rms stress levels. Therefore, due to this effect alone, Miner's Rule would be<br />
expected to be equally conservative for both bushed and unbushed lugs.<br />
(ii) Effect on local alter~ stress<br />
At all three stress levels the peak stress in the spectrum had a small<br />
effect on local stress range during smaller cycles. The effect was minimal in<br />
the unbushed lugs, but in the bushed lug there was a tendency for the local<br />
stress ranges for the lower net stresses to be increased slightly. Typically<br />
the local stress range was increased by 5-10% for the lowest two or three net<br />
stress ranges. This would have a detrimental effect on fatigue life but this<br />
would probably be considerably smaller in magnitude than that caused by the mean<br />
stress reduction.<br />
These local stress measurements were used to estimate the fatigue<br />
endurances, making allowance for the reduction in mean stress, in a sim~<br />
manner to that employed for the results <strong>of</strong> sequence (b). The resultant ~Nn
values are plotted in Fig 38, which shows that the estimates lay well over on the<br />
unsafe side, varying from 0.12 %o 0.75. It should be noted that it was<br />
assumed in the calculations~ when constructing the local mean-local alternating<br />
stress diagram, that the bushes were passivated. Thus these predictions were<br />
less satisfactory than those in which no allowance was made for residual<br />
stresses, particularly because conservative estimates became unsafe.<br />
There are several possible reasons for these poor estimates <strong>of</strong> life, which<br />
include the following:<br />
(a) The method employed to adjust the basic S-N data for the life estima-<br />
tion, allowing for residual stresses, may have been in error,<br />
particularly in the construction <strong>of</strong> the local mean-local alternating<br />
stress diagrams where a Goodman-type straight line relationship was<br />
assumed. However, it should be noted that the same assumption was<br />
made for the lower mean stress results using sequence (b), and<br />
reasonably accurate estimates resulted.<br />
(b) At the high mean stress employed in these tests, the largest load<br />
5 CONCLUSIONS<br />
peaks may have effectively loosened the bush leading to an increase<br />
in fretting damage and thus earlier crack initiation. It will be<br />
recalled that a large prestress applied at the start <strong>of</strong> a constant<br />
amplitude fatigue test decreased life and a similar mechanism was<br />
postulated to explain the result. At the higher rms stresses the<br />
peak load in the random sequence was <strong>of</strong> a similar magnitude to the<br />
prestresses applied before the constant amplitude test. Fig 38<br />
shows that the estimates became more unsafe for the higher levels <strong>of</strong><br />
rms alternating stress and thus higher peak loads, which is consis-<br />
tent with the finding that the greater the prestress~ the greater the<br />
reduction in constant amplitude life.<br />
Studies <strong>of</strong> cumulative fatigue damage have been made comparing lugs with and<br />
without interference-fit bushes by carrying out fatigue tests at tensile mean<br />
stresses under constant amplitude and narrow band random loading conditions and<br />
making local stress history measurements using the Companion Specimen Method.<br />
The observed fatigue <strong>behaviour</strong> was only partly explained by the local stress<br />
measurements. The following observations were made:<br />
17
18<br />
(i) Under constant amplitude loading the bush effectively reduced the<br />
amplitude and increased the mean value <strong>of</strong> the local stress. Although<br />
only a small effect on fatigue endurance would be expected, a large<br />
increase in endurance was observed under all conditions tested apart<br />
from the case <strong>of</strong> a high mean stress with a low alternating stress.<br />
It seems possible that the reduction in fretting damage caused by<br />
the presence <strong>of</strong> the bush was an important factor but does not<br />
explain the single above-mentioned case.<br />
(ii) The effect <strong>of</strong> tensile prestress on the unbushed hole was to reduce<br />
considerably the local mean stress, and the expected increase in<br />
endurance under constant amplitude loading was observed. When the<br />
same prestress was applied to the bushed hole an even greater reduc-<br />
tion in local mean stress occurred, accompanied by some increase in<br />
the local stress amplitude; but instead <strong>of</strong> the expected increase in<br />
endurance there was in fact a reduction. A possible explanation is<br />
that the prestress loosened the bush which caused an increase in<br />
fretting damage.<br />
(iii) Under narrow band random loading the occasional peak loads maintained<br />
a low level <strong>of</strong> mean stress by inducing compressive residual stresses<br />
following local tensile yielding in both bushed and unbushed l~s,<br />
whilst having virtually no effect on local stress ranges, and ~N<br />
was generally greater than one. When allowance was made for th-@ ~<br />
lowering <strong>of</strong> the mean stress in the bushed lugs, improved life esti-<br />
mates were produced for fatigue tests at 153 (95) MN/m 2 mean stress,<br />
while worse, unsafe estimates were found for a mean stress <strong>of</strong><br />
225 (140) MN/m 2. It is possible that the large load peaks loosened<br />
the bush in this case in a similar manner to the effect <strong>of</strong> a<br />
prestress noted in (ii).
Appendix A<br />
LOCAL STRESSES IN A BUSHED LUG<br />
A.I The effect <strong>of</strong> an interference fi 3 on local stress histor~ in a lug<br />
In the Introduction it was stated that with the introduction <strong>of</strong> an<br />
interference-fit bush there is a reduction in stress amplitude at the point <strong>of</strong><br />
crack initiation. The reason for this can be explained by imagining the bush as<br />
a stiff spring in compression inside the hole in the lug, as shown in Fig 39.<br />
The spring produces a tensile stress and strain in the lug material surrounding<br />
the hole. The load transmitted by the <strong>pin</strong> is modelled by the load at point A,<br />
which is at the top <strong>of</strong> the spring, where it contacts the lug bore. On applica-<br />
tion <strong>of</strong> a tensile load at this point~ the material surrounding the hole will<br />
experience a tensile strain, which will allow the spring to extend and thus<br />
relieve some <strong>of</strong> its compression. As a consequence the tensile stress in the lug<br />
due to the spring is decreased. Thus~ referring to Fig 40, the lug material will<br />
experience an increase in tensile stress due to the external load and a reduction<br />
in the tensile stress due to the spring. The net effect is that the local stress<br />
amplitude under external loading is reduced by the presence <strong>of</strong> the interference<br />
fit. However, the hoop stress created by the interference will cause an increase<br />
in local mean stress, but this has usually been assumed to be <strong>of</strong> only minor<br />
importance when compared to the reduction in stress amplitude.<br />
A.2 The effect <strong>of</strong> a ~restress o n l oca! stress range in a bushed hole<br />
In section 4.3 during the analysis <strong>of</strong> local stress measurements investi-<br />
gating the effect <strong>of</strong> prestress it was observed that the local stress range in<br />
the bushed lug was increased during subsequent constant amplitude loading. A<br />
simple explanation <strong>of</strong> the increase in stress range after the application <strong>of</strong> a<br />
prestress can be made by referring once again to Fig 39, where the spring<br />
represents the bush. If a sufficiently large load is applied at point A such<br />
that local yielding takes place, then the hole in which the spring is held will<br />
be permanently deformed. Thus the compression in the spring will be reduced~<br />
which means that the stress range over which the spring can help reduce local<br />
stress is reduced, as it can only work in compression.<br />
19
20<br />
FATIGUE TESTING FACILITY AND LOAD SPECTRA<br />
The tests were all carried out on a modified Schenck resonant fatigue<br />
machine operating at 27,4 Hzo Either constant amplitude or narrow band random<br />
loading could be applied~ control being achieved in a similar manner to that<br />
described by Edwards10o The original out-<strong>of</strong>-balance mass exciter was replaced<br />
by an electrohydraulic exciter in the case <strong>of</strong> the unbushed lugs, The bushed<br />
specimens were tested at a later point in time when an electromagnetic exciter<br />
replaced the electrohydraulic one,<br />
The spectrum shape was measured at all stress levels used by means <strong>of</strong> a<br />
levels-crossed counter 11o All spectrum measurements were made when the electro-<br />
magnetic exciter was in use~ including those for the unbushed lugs~ It was<br />
considered that the type <strong>of</strong> exciter would make no difference to the response <strong>of</strong><br />
the machine and hence the spectrum shape, The levels-crossed counter measured<br />
the cumulative number <strong>of</strong> times the stress exceeded a series <strong>of</strong> amplitude levels<br />
(exceedings)~ equally spaced over the range <strong>of</strong> the spectrum° In this report<br />
the resttlts <strong>of</strong> these measurements are plotted in the form cumulative number <strong>of</strong><br />
exceedi~s on a logarithmic scale against the non-dimensional quantity<br />
amp..litude,, Ievel<br />
J<br />
root mean square value <strong>of</strong> waveform °<br />
Plotted in this way true Gaussian narrow band random loading would produce<br />
a straight line, In practice there is a truncation <strong>of</strong> the higher levels <strong>of</strong> load<br />
due to mechanical dam<strong>pin</strong>g, as can be seen in Figs 41 and 42,
Appendix C<br />
CDNULATIVEDANAGE CALCULATIONS MADE USING MINER'S RULE 12<br />
Miner's Rule states that if a component is subjected to a variable ampli-<br />
tude loading sequence containing stress amplitudes ~ q (q = 1,2,3 ... p),<br />
then the fraction <strong>of</strong> the total life used up by any single stress cycle at stress<br />
amplitude ~q is given by I/N where N is the expected number <strong>of</strong> cycles to<br />
q q<br />
failure <strong>of</strong> the component under stress amplitude ~ q alone.<br />
Therefore the total fraction <strong>of</strong> the fatigue life used up by the variable<br />
amplitude waveform is<br />
q=p<br />
..%<br />
= q<br />
where n is the number <strong>of</strong> cycles <strong>of</strong> stress amplitude<br />
q q<br />
variable amplitude waveform.<br />
The rule predicts failure when<br />
q=p n<br />
-~ = I<br />
N<br />
= q<br />
The accuracy <strong>of</strong> the rule is generally judged by computing the ratio<br />
q~0 n<br />
contained in the<br />
for specimens which have been tested to failure. Since the rule predicts failure<br />
when<br />
)N = I~ the computed value <strong>of</strong> the ratio at failure is equal to the ratio<br />
achi eve--£ life<br />
'p'redict=e'd life"<br />
When carrying out the predictions in this report the actual measured load<br />
spectrum for the particular condition and stress level was used in all cases.<br />
It was necessary in carrying out the predictions to use S-N curves which<br />
extended above the stresses actually tested. This was done by extrapolating to<br />
the static failure point.<br />
21
22<br />
~ETHOD OF LIFE ESTIMATION ALLOWING FOR RESIDUAL STRESSES<br />
Section 4.2 described the construction <strong>of</strong> Figs 26 and 27 which present the<br />
local stress histories in bushed and unbushed lugs under constant amplitude<br />
loading. This, in combination with the relevant S-N curves enabled the local<br />
mean-local alternating stress diagram <strong>of</strong> Fig 43 to be drawn for bushed lugs. It<br />
was decided to construct the diagram for the case <strong>of</strong> passivated bushes, since<br />
this is likely to be the situation met in practice. <strong>Fatigue</strong> results were avail-<br />
able at only the low mean stress for passivated bushes but at both low and high<br />
mean stress for non-passivated bushes. However it was found, in section 4.1 that<br />
zt the lower mean stress passivation had little effect except at long lives where<br />
~t reduced the fatigue strength. As the higher mean stress reduced the fatigue<br />
strength at long lives to a very low value, see Fig 11, passivation could have<br />
had very little further effect and thus it was assumed that the S-N curves for<br />
both passivated and unpassivated bushes at the higher mean stress were identical.<br />
It will be noted that a Goodman-type straight line relationship was assumed on<br />
the mean-alternating stress diagram.<br />
Having plotted the mean-alternating stress diagram new S-N curves could be<br />
constructed at any new local mean stress. The local mean stresses for the random<br />
spectra tested were obtained from the local stress measurements, see ~igs 29-33,<br />
and new S-N curves were constructed for each random spectra case, which were used<br />
with the appropriate spectrum measurement to calculate the fatigue life allowing<br />
for residual stresses.
Table I<br />
CHEMICAL COMPOSITION AND TENSILE PROPERTIES OF B S 2L6> ALUMINIUM ALLOY<br />
mm<br />
Chemical composition (nominal)% w/w<br />
Tensile properties (measured)<br />
4.4 Cu, 0.7 Mg, 0.7 Si, 0.6 Mn, balance A1<br />
~s - 517 MN/m 2<br />
0.1% pro<strong>of</strong> - 462 MN/m 2<br />
Elongation - 10%<br />
23
24<br />
CONSTANT AMPLITUDE LOADING<br />
Table 2<br />
FATIGUE TEST RESULTS<br />
Mean <strong>pin</strong> bearing stress = 153 MN/m 2<br />
(Mean net stress* = 95 NN/m 2)<br />
Bushes unpassivated<br />
Specimen No.<br />
825<br />
430<br />
744<br />
438<br />
439<br />
440<br />
749<br />
502<br />
379<br />
426<br />
432<br />
375<br />
378<br />
381<br />
385<br />
370<br />
373<br />
377<br />
448<br />
369<br />
371<br />
376<br />
384<br />
433<br />
Rms <strong>pin</strong><br />
bearing stress<br />
(MN/m 2 )<br />
32.2<br />
32.2<br />
32.2<br />
32.2<br />
36.2<br />
36.2<br />
36.2<br />
36.2<br />
40.3<br />
40.3<br />
40.3<br />
48.3<br />
48.3<br />
48.3<br />
48.3<br />
64.4<br />
64.4<br />
64 -4<br />
64-4<br />
80.5<br />
8O.5<br />
8O.5<br />
8O.5<br />
8O.5<br />
J,,.<br />
i<br />
*Rms net<br />
stress<br />
(NNIm2)<br />
20<br />
20<br />
20<br />
20<br />
22.5<br />
22.5<br />
22.5<br />
22.5<br />
25<br />
25<br />
25<br />
3o<br />
30<br />
30<br />
30<br />
4o<br />
40<br />
40<br />
40<br />
5o<br />
5o<br />
5o<br />
5o<br />
5o<br />
(UB) Unbroken<br />
Life<br />
( 104 cycles)<br />
128.0<br />
289.0<br />
78.5<br />
161o.o (uB)<br />
147.0<br />
96.0<br />
328.0<br />
69.1<br />
122<br />
63,7<br />
58.8<br />
38.2<br />
123.0<br />
82.6<br />
67.0<br />
21.8<br />
26.3<br />
21.8<br />
24.3<br />
7.8<br />
19.1<br />
11.9<br />
7.2<br />
7.4<br />
* Based on net section area including bush wall<br />
it<br />
Loog4mean life<br />
(10 cycles)<br />
134<br />
77.o<br />
71.3<br />
23.5<br />
9.9
CONSTANT AMPLITUDE LOADING<br />
Mean<br />
Table 3<br />
FATIGUE TEST RESULTS<br />
<strong>pin</strong> bearing stress = 153 MN/m 2<br />
(Mean net stress* = 95 MN/m 2)<br />
Bushes passivated<br />
i,,<br />
Specimen No.<br />
481<br />
763<br />
458<br />
467<br />
486<br />
380<br />
372<br />
504<br />
832<br />
427<br />
390<br />
306<br />
474<br />
462<br />
835<br />
383<br />
475<br />
i<br />
Rms <strong>pin</strong><br />
bearing stress<br />
(MN/m 2)<br />
i ii i l<br />
16.1<br />
24.2<br />
24.2<br />
24.2<br />
32.2<br />
32.2<br />
32.2<br />
48.3<br />
48.3<br />
48.3<br />
64.4<br />
64.4<br />
64.4<br />
64.4<br />
80.5<br />
8o.5<br />
80.5<br />
i ,<br />
i<br />
*R ms net<br />
stress<br />
(~IN/m2)<br />
1o<br />
15<br />
15<br />
15<br />
20<br />
20<br />
20<br />
3o<br />
3O<br />
3O<br />
4o<br />
40<br />
40<br />
40<br />
5O<br />
50<br />
50<br />
(UB) Unbroken<br />
Life<br />
(104 cycles)<br />
1o2o<br />
309.0<br />
417.o<br />
149.o<br />
66.0<br />
119.0<br />
131.0<br />
54- 2<br />
38.0<br />
49.7<br />
15.8<br />
24.6<br />
23. I<br />
10.7<br />
7.9<br />
7.6<br />
6.4 i<br />
* Based on net section area including bush wall<br />
Log mean life<br />
(104 cycles)<br />
267<br />
101.0<br />
46.8<br />
17.6<br />
?.3<br />
25
26<br />
CONSTANT AMPLITUDE LOADING<br />
Table 4<br />
FATIGUE TEST RESULTS<br />
Mean <strong>pin</strong> bearing stress = 225 MN/m 2<br />
(Mean net stress* = 140 MN/m 2)<br />
Bushes unpassivated<br />
Specimen No.<br />
746<br />
457<br />
743<br />
450<br />
653<br />
472<br />
838<br />
745<br />
499<br />
686<br />
451<br />
654<br />
489<br />
835<br />
75o<br />
5o3<br />
488<br />
685<br />
482<br />
761<br />
495<br />
Rms <strong>pin</strong><br />
bearing stress<br />
( lvJN/m 2 )<br />
8.05<br />
8.O5<br />
8.05<br />
8.O5<br />
16.1<br />
16.1<br />
16.1<br />
16.1<br />
24 • 2<br />
32.2<br />
32.2<br />
32.2<br />
32.2<br />
48.3<br />
48.3<br />
48.3 L<br />
48.3<br />
64.4<br />
64.4<br />
64.4<br />
64.4<br />
*Rms net<br />
stress<br />
(MN/m 2 )<br />
10<br />
10<br />
10<br />
10<br />
15<br />
20<br />
20<br />
20<br />
20<br />
3O<br />
3O<br />
3O<br />
3O<br />
4O<br />
40<br />
40<br />
40<br />
Life<br />
(t04 cycles)<br />
441.0<br />
578.0<br />
389.0<br />
657.o<br />
113.0<br />
81.6<br />
38.2<br />
101.0<br />
5o.I<br />
26.7<br />
39.1<br />
72.8<br />
14.8<br />
8.6<br />
19.8<br />
18.1<br />
IO.3<br />
6.4<br />
8.0<br />
7.8<br />
6.6<br />
* Based on net section area including bush wall<br />
i<br />
j ,,i<br />
Log4meau life<br />
(IO cycles)<br />
5o5<br />
77. I<br />
32.5<br />
13.3<br />
7.2
Table 5<br />
FATIGUE TEST RESULTS<br />
CONSTANT AMPLITUDE LOADING WITH A PRESTRESS<br />
Mean <strong>pin</strong> bearing stress = 153 MN/m 2. Pin bearing prestress =<br />
(Mean net stress* = 95 MN/m 2.) (Net prestress = 250 MN/m2.)<br />
Bushes unpassivated<br />
Specimen No.<br />
478<br />
756<br />
505<br />
455<br />
Rms <strong>pin</strong><br />
bearing stress<br />
(MN/m 2)<br />
64.4<br />
64.4<br />
64.4<br />
64.4<br />
* Rms net<br />
stress<br />
(MN/m 2)<br />
i<br />
40<br />
40<br />
40<br />
40<br />
Table 6<br />
FATIGUE TEST RESULTS<br />
CONSTANT AMPLITUDE LOADING WITH A PRESTRESS<br />
Life<br />
(104 cycles)<br />
17.7<br />
19.7<br />
13.6<br />
16.4<br />
Mean <strong>pin</strong> bearing stress = 153 MN/m 2. Pin bearing prestress =<br />
(Mean net stress* = 95 MN/m2.) (Net prestress = 294 MN/m2.)<br />
Bushes unpassivated<br />
Specimen No.<br />
468<br />
830<br />
754<br />
827<br />
Rms <strong>pin</strong><br />
bearing stress<br />
(MN/m 2)<br />
i, L<br />
64.4<br />
64.4<br />
64.4<br />
64.4<br />
III I<br />
* Rms net<br />
stress<br />
(M~/m 2)<br />
4O<br />
40<br />
40<br />
40<br />
Life<br />
(lO4 cycles)<br />
10.1<br />
11.5<br />
10.3<br />
9.7<br />
* Based on net section area including bush wall<br />
402 MN/m 2<br />
Log mean life<br />
(104 cycles)<br />
16.7<br />
474 MN/m 2<br />
Log mean life<br />
(104 cycles)<br />
10.4<br />
27
28<br />
NARROW BAND RANDOM LOADING<br />
Table 7<br />
FATIGUE TEST RESULT~<br />
Mean <strong>pin</strong> bearing stress = 153 MN/m 2<br />
(Mean net stress* = 95 MN/m 2)<br />
Bushes unpassivated<br />
Specimen No.<br />
484<br />
454<br />
477<br />
Rms <strong>pin</strong><br />
bearing stress<br />
(MN/m 2)<br />
32.2<br />
32.2<br />
32.2<br />
NARROW BAND RANDOM LOADING<br />
i<br />
. Rms net<br />
stress<br />
(NN/m 2 )<br />
i , i<br />
20<br />
20<br />
20<br />
Table 8<br />
m?IaUE ~ST R~s~S<br />
Mean <strong>pin</strong> bearing stress = 153 MH/m 2)<br />
(Mean net stress* = 95 MN/m 2)<br />
Bushes passivated<br />
Specimen No.<br />
t i ,i<br />
453<br />
452<br />
461<br />
5OO<br />
46o<br />
748<br />
Rms <strong>pin</strong><br />
bearing ~tress<br />
(MN/m)<br />
u , i q<br />
32.2<br />
32.2<br />
32.2<br />
45.9<br />
45.9<br />
45.9<br />
I, ,L<br />
*Rms net<br />
st re s s<br />
(MN/m 2 )<br />
2O<br />
2O<br />
2O<br />
28.5<br />
28.5<br />
28.5<br />
i<br />
Life<br />
(lo4 cycles)<br />
118.0<br />
192.0<br />
156.0<br />
Life<br />
(104 cycles)<br />
258.O<br />
189.0<br />
156.0<br />
165.0<br />
I04.0<br />
113.0<br />
* Based on net section area including bush wall<br />
i<br />
i r 1 111,<br />
Log4mean life<br />
(10 cycles)<br />
i i<br />
152.0<br />
i ii<br />
Log mean life<br />
(104 cycles}<br />
i i i i<br />
197<br />
125
NARROW BAND RANDOM LOADING<br />
Mean stress = 225 MN/m 2<br />
(Mean net stress* = 140 MN/m 2)<br />
Bushes unpassivat ed<br />
Specimen No<br />
i<br />
470<br />
485<br />
464<br />
463<br />
473<br />
490<br />
493<br />
494<br />
711<br />
491<br />
487<br />
466<br />
483<br />
826<br />
492<br />
459<br />
Rms <strong>pin</strong><br />
bearing stress<br />
(MN/m 2 )<br />
16.1<br />
16.1<br />
16.1<br />
16.1<br />
32.2<br />
32.2<br />
32.2<br />
32.2<br />
48.3<br />
48.3<br />
48.3<br />
48.3<br />
64.4<br />
64.4<br />
64.4<br />
64.4<br />
Table<br />
FATIGUE TEST RESULTS<br />
i<br />
*Rms net<br />
stress<br />
(MN/m 2)<br />
10<br />
10<br />
10<br />
10<br />
20<br />
20<br />
20<br />
20<br />
3O<br />
3O<br />
3O<br />
3O<br />
4O<br />
4O<br />
40<br />
40<br />
(UB) Unbroken<br />
Life<br />
(104 cycles)<br />
149.0<br />
448.0<br />
166o.o<br />
319.o<br />
66.2<br />
46.2<br />
42.5<br />
78.2<br />
28.4<br />
21 -9<br />
36.5<br />
20.4<br />
10.4<br />
12.6<br />
15-7<br />
14.1<br />
* Based on net section area including bush wall<br />
Lo~mean life<br />
(I oycles)<br />
56.5<br />
26. I<br />
13.0<br />
29
3O<br />
No<br />
4<br />
6<br />
7<br />
8<br />
Author<br />
WoA.P. Fisher<br />
W.J. Winkworth<br />
Oo Gok~l<br />
W.AoPo Fisher<br />
Ho Yeomans<br />
DoJo White<br />
PoRo Edwards<br />
RoJ. Ryman<br />
CoRo Smith<br />
J.Ho Crews Jr<br />
H.Fo Hardrath<br />
J.Eo Moon<br />
PoRo Edwards<br />
REFERENCES<br />
Title etc<br />
Improvement in the fatigue strength <strong>of</strong> joints by the<br />
use <strong>of</strong> interference fits.<br />
ARC R & M No.2874 (1952)<br />
Estimation <strong>of</strong> endurance <strong>of</strong> light metal <strong>alloy</strong> lugs with<br />
interference fit bushes.<br />
RAE Library Translation 1861 (1975)<br />
Further fatigue tests on loaded holes with interference<br />
fit bushes.<br />
RAE Technical Note Structures 210, ARC 19462 (1956)<br />
The fatigue strength <strong>of</strong> large single <strong>pin</strong>ned and double<br />
<strong>pin</strong>ned connections made from <strong>alloy</strong> steel FV 520B.<br />
Io Mech. E. Applied Mechanics Group Proceedings<br />
1968-1969, Volume 183 Part I<br />
Studies in fretting fatigue under variable amplitude<br />
loading conditions.<br />
RAE Technical Report 75132, ARC 36737 (1975)<br />
Linear strain theory and the Smith Method for<br />
predicting fatigue life <strong>of</strong> structures for spectrum<br />
type loading.<br />
ARL Report 64-55, April 1964<br />
A study <strong>of</strong> cyclic plastic stresses at a notch root.<br />
Exp. Mechanics 23, pp 313-320 (1966)<br />
<strong>Fatigue</strong> <strong>behaviour</strong> <strong>of</strong> <strong>pin</strong>-loaded lugs in <strong>BS</strong> <strong>2L65</strong><br />
<strong>aluminium</strong> <strong>alloy</strong>.<br />
ARC R & M No. 3834 (1977)<br />
Cumulative fatigue damage calculations (effect <strong>of</strong><br />
correcting mean stress at stress concentrations).<br />
Data sheets on fatigue No 71028.<br />
Engineering Science Data Unit. Royal Aeronautical<br />
Society (1971)
No<br />
m<br />
I0<br />
11<br />
12<br />
Author<br />
P.R. Edwards<br />
E.M. Power<br />
M.A. Miner<br />
REFERENCES (Concluded)<br />
Title T etc<br />
A controller for random and constant amplitude loading<br />
on resonant and electrohydraulic fatigue machines.<br />
RAE Technical Report 72226, ARC 34525 (1973)<br />
The analysis <strong>of</strong> random data for fatigue testing.<br />
Paper presented at the SEE symposium "Statistical<br />
Aspects <strong>of</strong> <strong>Fatigue</strong> Testing" held at Warwick University<br />
12 February 1975<br />
Cumulative damage in fatigue.<br />
J. Applied Mechanics, Vol 12, No 3, pp AI59-A164 (1945)<br />
31
_3<br />
Scale 4<br />
Nominal dimensions in mm<br />
I I<br />
I I<br />
I I<br />
I I<br />
I I<br />
25.4 dia<br />
165,1<br />
2 5/..0<br />
Fig 1 Unbushed lug<br />
I I<br />
I I<br />
I I<br />
I I<br />
I I<br />
I<br />
/.4.5<br />
"11
3<br />
Scale /.<br />
Nominal dimensions in mm<br />
This hole incidental<br />
/<br />
This a r ea ~ ~ ~ I ~ ~ ~ , , ~ ~,~~~<br />
clamped<br />
254.0<br />
Fig 2 Bushed lug<br />
i~<br />
II<br />
II<br />
Jt<br />
i I<br />
itl<br />
II<br />
11 J!<br />
25.4 dia<br />
$80 stainless steel bush<br />
-,, / t<br />
!<br />
~D<br />
m<br />
W<br />
"TI<br />
~o
I<br />
t -t-<br />
Scale 2:1<br />
Material $80 steel<br />
Nominal dimensions in mm<br />
25.40 dia<br />
28.65 dia<br />
I<br />
I<br />
I<br />
I<br />
I<br />
I<br />
I<br />
I<br />
I<br />
I<br />
L<br />
.!<br />
v<br />
)<br />
Fig 3 ~nterference fit bush<br />
\<br />
,,.-:.<br />
¢",1<br />
Chamber 4 5 =<br />
xO.6<br />
Fig 3
Fig 4 Failed specimen<br />
e .
?0-~<br />
-- 60-~<br />
E =<br />
ol<br />
Z ~<br />
120<br />
E<br />
zl00<br />
:E 50- 2 80<br />
= ~0-,~<br />
.~ 60<br />
e- ¢_<br />
o ~<br />
~ 30 -~<br />
j,_ m<br />
f-<br />
: 20<br />
L_ i'~<br />
E<br />
~o<br />
"~- 20<br />
10 -<<br />
0 - Oi<br />
10 104 105<br />
Endurance (cycles)<br />
106<br />
Bushed lug 0.27% interference<br />
25.4 mm dia <strong>pin</strong><br />
Frequency = 27Hz<br />
Stress scale is rms. Forpeak<br />
amplitudepamUltiplYun ssivated by<br />
. ® ~® ®<br />
\<br />
I t I I<br />
107<br />
Fig 5 Constant amplitude loading at mean stress = 153(95) MN/m 2. Bushes unpassivated<br />
"11<br />
i i<br />
C11
60-<br />
E<br />
?0-<br />
120 -<br />
100 -<br />
z<br />
~ES0 P 80 -<br />
U~<br />
U~<br />
h0- --<br />
= ~ 60 -<br />
.o<br />
~ 30- "~<br />
~ 20 c ~<br />
< 10<br />
- 0<br />
20 -<br />
-<br />
103<br />
Bushed lug 0.27% interference<br />
25./, mm dia <strong>pin</strong><br />
Frequency = 27Hz<br />
Stress scale is rms. For peak<br />
amp|itude multiply by V2"<br />
® bushes pass|vat.ed<br />
I I I I<br />
10/` 105 106 107<br />
Endurance (cycles)<br />
Fig 6 Constant amplitude loading at mean stress = 153(95) MN/m 2. Bushes passivated<br />
"11<br />
01
70-<br />
E<br />
120 -<br />
~100 -<br />
~-" 60 - ~<br />
E<br />
Z m<br />
~ 50 - N 80-<br />
~ E<br />
. - -<br />
E<br />
" 60 -<br />
Q..<br />
E 30 - ul<br />
a,.<br />
o~ E 40 -<br />
e-<br />
20 -: . ~<br />
E .,..<br />
.,., C<br />
~ 20 -<br />
10 ~<br />
0 0<br />
10 3<br />
I ! I<br />
104 105 106<br />
Endurance (cycles)<br />
°<br />
Bushed lug 0.27% interference<br />
25.4mm dia <strong>pin</strong><br />
Frequency -- 27Hz<br />
Stress scale is rms. For peak<br />
amplitude multiply by<br />
bushes unpassivated<br />
Fig 7 Constant amplitude loading at mean stress = 225(140) MN/m 2. Bushes unpassivated<br />
I<br />
10 ~r<br />
"11<br />
mo<br />
¢Q
?0-<br />
120 -<br />
~EIOC -<br />
60 - z<br />
50 - ~ 8C -<br />
ffl<br />
~ ~0 - .E<br />
e- e-<br />
~ 30 - "~.<br />
E m<br />
60 -<br />
=" E Z.0 -<br />
03<br />
¢-<br />
=--<br />
~20 - o-<br />
c-- o - -<br />
+~ r-<br />
-~ < ~ 20 -<br />
0- 0<br />
103<br />
Bushed lug 0.2'/% interference<br />
25.l, rnm dia <strong>pin</strong><br />
Frequency = 2? Hz<br />
® Bushes passivated ~ ~<br />
+ Bushes unpassivated<br />
I 1 I I<br />
10/' 105 106 107<br />
Endurance (cycles)<br />
Fig 8 Narrow band random loading at mean stress = 153(95) MN/m 2<br />
®<br />
'11<br />
n ,<br />
cO<br />
00
A<br />
E<br />
?0-<br />
6O<br />
Z<br />
:E 50<br />
--Z<br />
w<br />
E<br />
u~<br />
ul<br />
t~3<br />
t/1 C:7<br />
-~ 40 ,.<br />
Q;<br />
r- ¢..<br />
~ 30 -'~<br />
E i-- m<br />
E<br />
1-<br />
=50 -<br />
~ N<br />
.1_, e-<br />
4 ~<br />
_<br />
120 -<br />
00-<br />
80-<br />
60-<br />
/.0-<br />
20-<br />
0<br />
103<br />
Bushed lug 0.24%<br />
25.4 mm dia <strong>pin</strong><br />
Frequency = 2?Hz<br />
Bushes unpassivated<br />
interference<br />
I I I ,,]<br />
104 105 106 107<br />
Endurance (cycles)<br />
Fig 9 Narrow band random loading at mean stress -- 225(140) MN/m 2. Bushes unpassivated<br />
®<br />
"11<br />
l ,<br />
¢.O
1%1<br />
70-<br />
A<br />
120 -<br />
6O - ~ tO0<br />
7<br />
:~ 50 ~ 80<br />
in<br />
in ; 60<br />
c- t--<br />
in 30 "K<br />
E<br />
~0<br />
e-<br />
e--<br />
ilJ<br />
20 -<br />
~ 2O<br />
10-<br />
w<br />
Bushed lug 0.2/,% interference<br />
25./, mm dia <strong>pin</strong><br />
Frequency = 27Hz<br />
Stress scale is rms. For peak<br />
amptitude mu[tiply by v~"<br />
unpassivated<br />
O- 0<br />
I I I I<br />
103 10/. 105<br />
Log mean endurance (cycles)<br />
106<br />
10 7<br />
Fig 10 Effect <strong>of</strong> passivating bushes on constant amplitude performance at<br />
mean stress = 153(95) MN/m2<br />
/<br />
"11<br />
I o<br />
O
E<br />
Z<br />
I J1<br />
L..<br />
e-<br />
E<br />
L.-<br />
.m<br />
e'-<br />
m<br />
(--<br />
70-<br />
E<br />
120<br />
60 - ~z10( -<br />
U3<br />
¢$1<br />
50 - ~ BC -<br />
40 -~<br />
f..<br />
¢-<br />
30 ~<br />
20 - ~<br />
c<br />
6c -<br />
m<br />
~/.0 -<br />
~20 -<br />
10 -=<br />
0 0<br />
10 a<br />
Bushed lug 0.27%<br />
Unbushed mean stress = 155(96)MN/m 2 interference<br />
~ B u 25.4mm dia <strong>pin</strong><br />
Frequency = 2?Hz<br />
Stress scale is rms.<br />
2 For peak amplitude<br />
shed mean stress = 225 (140) MN/m muttipiy by~<br />
%<br />
mean stress =153(95} MN/m 2<br />
I I I I<br />
104 105 106 107<br />
Log mean endurance (cyctes)<br />
Fig 11 Comparison <strong>of</strong> the performance <strong>of</strong> bushed and unbushed lugs under<br />
constant amplitude loading<br />
"11<br />
m,
70-<br />
120<br />
60 - 100<br />
E ~<br />
m<br />
Z ~<br />
x 50 - ~ 80 -<br />
U3<br />
i1~ r-<br />
N~0-~<br />
¢" r<br />
,n 30-<br />
. 6o -<br />
e~<br />
E m<br />
E 40 -<br />
t"-<br />
~ 20_ o~<br />
~ r--<br />
~- 20 -<br />
?0<br />
6O<br />
E<br />
z 50<br />
U3<br />
u3<br />
E<br />
t..<br />
I-<br />
40<br />
30<br />
N 30<br />
e-<br />
<<br />
10<br />
120 -<br />
EEI00<br />
ETJ<br />
.o<br />
e-<br />
r"<br />
<<br />
80<br />
60<br />
40 -<br />
20 -<br />
0 103<br />
Unbushed mean stress =277 (172) MN/m 2<br />
Bushed lug 0.27%<br />
25./, mm dia <strong>pin</strong><br />
Frequency = 2? Hz<br />
interference<br />
\\ Bushed mean stress=225(140)NN/m 2<br />
"~,f~Bushed 2 " mean stress =153 (95) MN/m<br />
Unbushed mean stress=155196)MN/m 2 ~ _ _ ~<br />
I I<br />
10 ~ 105<br />
Endurance (cyctes)<br />
Fig 13 Comparison <strong>of</strong> the effect <strong>of</strong> mean stress on bushed and unbushed lugs under NBR loading<br />
I I<br />
106 10 ?<br />
"11<br />
¢Q
E<br />
?O-A<br />
120 -<br />
E<br />
~I00 -<br />
60-:E<br />
Z m<br />
~. 50 - ~ 80 -<br />
Lq<br />
~'P O3<br />
t..<br />
c"<br />
&..<br />
40- .3<br />
~ 60-<br />
t-<br />
~.<br />
E30- ul<br />
c. E<br />
_= " 40<br />
-=-' ¢~<br />
m , ~ 20 =<br />
(.-<br />
=20<br />
10 -<<br />
O- 0<br />
103<br />
Bushes passivated<br />
10 ~<br />
Log<br />
Bushed lug 0.27%<br />
25.4 mm dia <strong>pin</strong><br />
Frequency = 2?Hz<br />
/--..<br />
Miner's rule predition""<br />
I I<br />
105 106<br />
mean endurance (cycles)<br />
Achieved /<br />
Fig 14 Accuracy <strong>of</strong> Miner's rule for NBR loading at mean stress = 153(95) MN/m 2<br />
interference<br />
performance<br />
I<br />
I0 ~<br />
"1"1<br />
m,<br />
4==
E<br />
Z<br />
I[<br />
¢-<br />
(Jl<br />
E<br />
L_<br />
.E<br />
e-<br />
70<br />
120 -<br />
04<br />
EIO0<br />
GO - "--<br />
2<br />
50 - ~80<br />
,.=..<br />
E~<br />
40 - .E<br />
6o-<br />
G:<br />
30 - ~-<br />
20 - r-<br />
.m<br />
U1<br />
E ~.oI<br />
L.<br />
n~<br />
10 ~..$ 20<br />
0 0 10 3<br />
Miner s<br />
Bushed lug 0.27%<br />
25.4mm dia <strong>pin</strong><br />
Frequency = 27Hz<br />
~ Achieved performance<br />
I I I<br />
10 ~ 1 05 106<br />
Log mean endurance (cycles)<br />
Fig 15 Accuracy <strong>of</strong> Miner's rule for NBR loading at mean stress = 225(140) MN/m 2<br />
interference<br />
I<br />
10 ?<br />
=11<br />
i°<br />
¢¢2<br />
O1
(~<br />
E<br />
Z<br />
~E<br />
i...<br />
Is)<br />
6+1<br />
E<br />
En<br />
C<br />
.w<br />
n~<br />
¢-<br />
t..<br />
<<br />
30<br />
20<br />
10<br />
('M<br />
E<br />
ul<br />
ul<br />
~a<br />
L.<br />
E~<br />
C<br />
o~<br />
qa<br />
JE~<br />
i-<br />
o~<br />
trl<br />
E<br />
i._<br />
r-<br />
r--<br />
50<br />
40<br />
30<br />
20<br />
10 -<br />
0 0<br />
m<br />
Mean<br />
Mean<br />
I<br />
stress=225 (140) MN/m 2<br />
bushes unpassivatedx / J ~ ' -<br />
I ~ + J Mean stress=153 (95)MN/m 2<br />
Jl *<br />
stress=153 (951 MN/m 2<br />
bushes unpassivated<br />
I<br />
I<br />
I t I I<br />
1 2 n 3 4<br />
zW<br />
n<br />
Fig 16 Z Ki values for lugs with interference fit bushes at two mean<br />
stresses under NBR loading<br />
"11<br />
mo<br />
O1
E<br />
Z<br />
30 - E<br />
Z<br />
:E<br />
ul<br />
Ltl<br />
,ol<br />
(,'1<br />
=20-5<br />
~. rt<br />
Ul<br />
._ 10-c.<br />
C ,*-,<br />
O-<br />
60-<br />
50-<br />
Z.0 -<br />
30 -<br />
20 -<br />
10-<br />
0<br />
i<br />
Mean<br />
Fig 17<br />
I<br />
I<br />
I<br />
I<br />
stress = 155<br />
!<br />
I<br />
(96) MN/m 2<br />
Mean stress - 277 (172)<br />
I I I ,I<br />
2 n 3 /. 5<br />
n<br />
2; ~ values for unbushed lugs at two mean stresses under NBR loading<br />
MN/m 2<br />
"11<br />
n .<br />
tQ
Material: <strong>BS</strong>ZL65<br />
Nominal dimensions in mm<br />
Hole<br />
Hole<br />
I i i<br />
1<br />
i<br />
!<br />
' I<br />
!<br />
!<br />
1 !<br />
I<br />
i i i<br />
25-40 d~a ~5train gauges-~<br />
A- to accommodate bush<br />
B-for clearance fit <strong>pin</strong><br />
165-I 44 "5<br />
254-0<br />
Fig 18 Lug used in companion specimen testing<br />
;<br />
//--28-58 dia
Bush is split olong-~<br />
this line so that<br />
each half can be<br />
inserted into the<br />
lug from opposite<br />
sides<br />
Scale: 2:1<br />
Material: SBO steel<br />
t<br />
Nominal dimensions in mm<br />
25.40<br />
28-65<br />
Fig 19 Interference fit bush<br />
6.4 dia window<br />
for strain gouge<br />
t<br />
¢%1<br />
Chamfe r 450<br />
x 0.6<br />
Bush to be inserted<br />
into hole A in Figl8<br />
Fig 19
i<br />
Scale: 314<br />
M~terial: <strong>BS</strong> <strong>2L65</strong><br />
Nominal dimensions in mffl<br />
For use vith specimen in Fig18<br />
i I<br />
S<br />
D<br />
3 i.7 rQd<br />
Fig 20 Plain specimen<br />
Strain gauges<br />
L<br />
139-7<br />
114 "3<br />
82"6<br />
;l<br />
=11<br />
mo<br />
¢Q
2values <strong>of</strong> prestress applied in constant amplitude<br />
%<br />
z t, O0<br />
/ . / ~ ~ _ A47l*(29/~) MN/mz<br />
== 300<br />
200<br />
1oo<br />
o ~<br />
n 0<br />
Sequence progression<br />
Peaks applied in random fatigue tests at<br />
,oo<br />
~6(28.5)MN/m 2 rms respectively<br />
300<br />
200<br />
100<br />
m<br />
32(20) and<br />
fatigue tests<br />
Peaks applied inrandom fatigue tests at 16(10), 32(20) and<br />
/~8 ( 3 0 ~ ~ e c t ively<br />
Fig 21a-c Sequences applied to lugs in Companion Specimen tests<br />
Fig 21 a- c<br />
a<br />
c
Fig 22<br />
E<br />
z<br />
C<br />
°~<br />
.0<br />
C<br />
,w<br />
~L.<br />
500<br />
z, O0<br />
300<br />
200<br />
100<br />
0 5000 10000 15000<br />
Local strain (pc)<br />
Fig 22 Pin bearing stress vs local strain diagram for lug with interference fit bush.<br />
Sequence (a)
500 -<br />
400<br />
300<br />
ZOO<br />
!00<br />
0<br />
- I00 I<br />
- ZOO L<br />
/ 7f I0 000<br />
Local strain (p¢~)<br />
Fig 23 Companion plain specimen reproduction <strong>of</strong> local stress and local strain in a lug<br />
with an interference fit bush. Sequence (a)<br />
r<br />
"11<br />
~ °<br />
¢=0
+<br />
Fig 24<br />
E<br />
Z<br />
~E<br />
e.-<br />
°--<br />
CL<br />
500<br />
1,00<br />
300<br />
200<br />
100<br />
I<br />
0 5000 10000<br />
Local strain (IJ.¢)<br />
I I I I I<br />
15000<br />
Fig 24 Pin bearing stress vs local strain diagram for lug with clearance fit <strong>pin</strong>.<br />
Sequence (a)
N<br />
E<br />
z<br />
I/I<br />
f~<br />
¢1<br />
0<br />
..I<br />
500 r-<br />
400<br />
300<br />
200<br />
i00<br />
-I00<br />
0<br />
-200<br />
l I I I<br />
5000<br />
'Local strain OJ¢)<br />
Fig 25 Companion plain specimen reproduction <strong>of</strong> local stress and local<br />
strain in a lug with a clearance fit <strong>pin</strong>. Sequence (a)<br />
I<br />
!0 000<br />
=11<br />
mo<br />
01
Fig 26<br />
E<br />
500<br />
i, O0<br />
300<br />
Z<br />
x 200<br />
U~<br />
I,,,,,<br />
U<br />
o<br />
--J<br />
100<br />
-1001-<br />
-200 L<br />
ol J m<br />
20 ~0 60 80<br />
rms <strong>pin</strong> bearing stress (MN/m 2<br />
0<br />
Bushed<br />
Unbushed<br />
I I<br />
100 II 120 I/.0 160<br />
Fig 26 Comparison <strong>of</strong> Iocai'stress excursions in a bushed and an unbushed lug under<br />
constant amplitude loading at mean stress = 153(95) MN/m2
¢W<br />
E<br />
500<br />
z,00<br />
300<br />
z 200<br />
I/1<br />
I/I<br />
w<br />
(J<br />
o<br />
..-I<br />
100<br />
0<br />
-100<br />
-200<br />
I<br />
2O<br />
D<br />
Bushed<br />
Unbushed<br />
f<br />
I I I I~,<br />
0 60 80 100<br />
rms <strong>pin</strong> bearing stress (MN/m 2<br />
Fig 27 Comparison <strong>of</strong> local stress excursions in a bushed and an unbushed lug under<br />
constant amplitude loading at mean stress = 225(140) MN/m2<br />
120<br />
Fig 27<br />
I<br />
160
700[ Bushed Unbushed Bushed Unbushed<br />
300<br />
600 / ~<br />
!<br />
constant amplitude<br />
load ing at<br />
~E S00]-- ~E rms stress = 64.4 (40) HN/m z<br />
~: /<br />
-~<br />
="<br />
Heart stress = 153 (95) HN/m z<br />
4001- ~ 200<br />
x x---.---x E<br />
,oo[ 1<br />
OI I I i I I I I I I J J<br />
0 403 483 0 403 483 0 403 483 0 403 483<br />
(?SO) (300) (ZSO) (300) (2SO) (300) (ZSO) (300)<br />
Prestress NN/m 2 Prestress HN/m z<br />
Fig 28 Effect <strong>of</strong> prestress on local stress histories during constant amplitude loading<br />
"11<br />
0O
E<br />
700<br />
600<br />
500<br />
z<br />
x 400<br />
c<br />
c~<br />
L-<br />
300<br />
-- 200<br />
o<br />
O<br />
..J<br />
!00<br />
0<br />
- Bushed<br />
P<br />
o ®<br />
- E?_~ c<br />
_ b<br />
o ®<br />
1<br />
Before<br />
I<br />
I<br />
I<br />
I<br />
I<br />
I<br />
I<br />
I<br />
I<br />
I<br />
I<br />
I<br />
I<br />
I<br />
I<br />
I<br />
I<br />
I x<br />
I<br />
I<br />
I<br />
I<br />
i<br />
I<br />
1 I I<br />
After Before<br />
Before or after<br />
peak in sequence<br />
Unbushed<br />
P<br />
X X<br />
x d x<br />
O<br />
X X<br />
b<br />
G<br />
X<br />
X<br />
1<br />
After<br />
E<br />
L.<br />
e.-<br />
o<br />
E<br />
o<br />
u<br />
o<br />
400 -<br />
30O<br />
200<br />
100<br />
0<br />
Bushed Unbushed<br />
X<br />
X<br />
c b<br />
X ×<br />
P<br />
I I I I<br />
Before AFter Before After<br />
Before or after<br />
peak in sequence<br />
Fig 29 Effect <strong>of</strong> peak stress on local stress histories during subsequent<br />
smaller net stress cycles<br />
Simulated NBR loading<br />
at:<br />
rms stress =32.2 (20) MN/m z<br />
Mean stress = 153 (95) HN/m 2<br />
Xn/N bushed=l.8<br />
Pin bearing stress<br />
121 -- 185 a<br />
89- 217 b<br />
56 - 250 c<br />
24-- 282 d<br />
ii - 295 p<br />
( peak )<br />
range<br />
"n<br />
w,<br />
¢0
(%1<br />
E<br />
Z<br />
¢I<br />
£,.<br />
¢,.<br />
m<br />
o<br />
¢.}<br />
o<br />
-J<br />
700 -<br />
600 -<br />
500 -<br />
400 -<br />
300<br />
200<br />
I00<br />
0<br />
P<br />
C> C)<br />
a<br />
Bushed<br />
I 1<br />
Before After<br />
Before<br />
peak in<br />
P<br />
X X<br />
e<br />
x ~ X<br />
X ~<br />
x ~<br />
d .-....x<br />
b ~x<br />
×<br />
×<br />
E<br />
Z<br />
~r<br />
f,,#=l<br />
l,=.<br />
e-<br />
E<br />
u<br />
o<br />
,.=i<br />
400 -<br />
300 -<br />
200<br />
I00-<br />
m<br />
X<br />
x- T-<br />
Unbushed Bushed Unbushed<br />
I I I I 1 I<br />
Before After Before After Before After<br />
or after Before or after<br />
sequence peak in sequence<br />
Fig 30 Effect <strong>of</strong> peak stress on local stress histories during subsequent<br />
smaller net stress cycles<br />
Simulated NBR loading<br />
at:<br />
rms stress =45.9(28.5)MN/m 2<br />
Mean stress = 153 (95) MN/m z<br />
~E a/N bushed = 3.6<br />
Hn bearing<br />
MN/m z<br />
121-185 a<br />
8g--217 b<br />
56- 250 c<br />
24 -- 282 d<br />
0-314 e<br />
O-- 355 p<br />
( pea k ]<br />
stress range<br />
"11<br />
m,<br />
gO<br />
C~
E<br />
z<br />
IE<br />
_ 200-<br />
¢-<br />
[..<br />
¢¢1<br />
{--<br />
o<br />
o<br />
_J<br />
700 --<br />
600 -<br />
500 -<br />
400 -<br />
300 -<br />
I00 -<br />
0<br />
Bushed Unbushed<br />
P<br />
Q Q<br />
cp._ a..__..Q<br />
I I I<br />
Before After Before<br />
Before or after<br />
peak in sequence<br />
X<br />
X<br />
x<br />
P<br />
b<br />
a<br />
X<br />
--X<br />
, X<br />
z<br />
E<br />
u~<br />
400<br />
300<br />
t--<br />
" 200<br />
c-<br />
a<br />
E<br />
o<br />
-J<br />
I00<br />
Bushed Unbushed<br />
,J I I I I<br />
After Before After Before After<br />
Before or after<br />
peak in sequence<br />
Fig 31 Effect <strong>of</strong> peak stress on local stress histories during subsequent<br />
smaller net stress ranges<br />
Simulated N B R loading<br />
at:<br />
rms stress =16.1 (10) MN/m z<br />
Mean stress=Z25.4 (140) MN/m z<br />
]rn/M bushed = 3.2<br />
Pin bearing stress range<br />
HN/m z<br />
193- 258 a<br />
161 -290 b<br />
14 - 309 p<br />
( peak }<br />
"11<br />
~o<br />
(A1
E<br />
z<br />
c<br />
o<br />
L.<br />
o<br />
..,I<br />
700<br />
600<br />
500<br />
400<br />
300<br />
200 -- b_._ E)<br />
_ IOC<br />
i<br />
P<br />
Q 0<br />
-- C<br />
E> 0<br />
Bushed<br />
0 t !<br />
Before After<br />
Before<br />
peak<br />
P<br />
X ~ X<br />
C<br />
X X<br />
b --.---,X<br />
X....~--~<br />
a<br />
X.-~-----.._. x<br />
E<br />
O<br />
..J<br />
400<br />
300<br />
200<br />
IOC<br />
b a<br />
Unbushed > Bushed Unbushed<br />
I I 0 < I I I I<br />
Before After Before After Before After<br />
or after Before or after<br />
in sequence peak in sequence<br />
Fig 32 Effect <strong>of</strong> peak stress on local stress histories during subsequent<br />
smaller net stress cycles<br />
C<br />
X<br />
'i~ a Simulated N BR loading<br />
at:<br />
rms stress=32.2 (20) MNlm z<br />
Mean stress=225.4 (140)HN/m 2<br />
~n/N bushed = 2.2<br />
d<br />
Pin bearinq stress range<br />
MN/m z<br />
193-258 a<br />
16| =290 b<br />
129- 322 c<br />
97 -354 d<br />
74 - 377 p<br />
(peak)<br />
"11
E<br />
700-<br />
600 -<br />
500-<br />
Z<br />
z400 -<br />
(P<br />
e,-<br />
0<br />
L<br />
300 -<br />
- - 2(i)0<br />
o<br />
o<br />
I00<br />
Q<br />
P<br />
f IQ<br />
e<br />
b...~<br />
Cp__a----¢<br />
Bushed<br />
P<br />
X X<br />
x_.-L--x<br />
x_~e x<br />
C<br />
X X<br />
I I I I<br />
Before After Before After<br />
Before or after<br />
peak in sequence<br />
Unbushed<br />
E<br />
Z<br />
x<br />
L<br />
c<br />
o<br />
¢B<br />
E<br />
m<br />
¢.1<br />
o<br />
.J<br />
400<br />
300<br />
200<br />
I00<br />
Bushed<br />
! I I !<br />
I<br />
~efore After Before After<br />
Before<br />
peak in<br />
I<br />
I<br />
!<br />
I<br />
!<br />
!<br />
X<br />
I<br />
!<br />
i<br />
i<br />
I<br />
I<br />
I<br />
I<br />
!<br />
I<br />
i<br />
I<br />
i *<br />
I<br />
I<br />
I<br />
I<br />
I Unbushed<br />
or after<br />
sequence<br />
Fig 33 Effect <strong>of</strong> peak stress on local stress histories during subsequent<br />
smaller net stress cycles<br />
Simulated NBR loading<br />
at:<br />
rms stress=48.3 (30)MN/m z<br />
Hean stress=225.4 (140)HN/m z<br />
Zn/N bushed = 2.25<br />
Pin bearing<br />
MN/m 2<br />
193-258 a<br />
161 - 290 b<br />
129 - 322 c<br />
97 - 354 d<br />
64 - 386 e<br />
32 - 419 f<br />
20 -- 431 p<br />
(peak)<br />
stress range<br />
"!1<br />
mo<br />
¢Q
E<br />
Z<br />
~E<br />
120 -<br />
100 -<br />
~n 80<br />
el<br />
Oa<br />
u';<br />
.c_ 60<br />
t--<br />
n<br />
¢-<br />
o-/* 0<br />
el<br />
E<br />
L..<br />
20<br />
f/<br />
0 40<br />
..~3<br />
////<br />
x~ ?xl 4<br />
X ~ X<br />
3x10⁶ x<br />
5x 10⁶<br />
~ X<br />
~ x<br />
~ x<br />
"=-="=='=--=-x<br />
I I I I I I I<br />
80 120 160 200 2/.0 280 320<br />
Mean stress (MN/m 2)<br />
Fig 34 Alternating-mean stress diagram for unbushed lugs<br />
X<br />
X<br />
Constant life lines<br />
=11<br />
4~
Z<br />
E<br />
ol<br />
¢-<br />
r~<br />
L.<br />
ul<br />
I/I<br />
U<br />
o<br />
.J<br />
600-<br />
500<br />
400<br />
300<br />
200<br />
100<br />
Constant life [ines<br />
I I I<br />
100 200 300<br />
Locat mean stress (MN/m 2)<br />
x<br />
x S./,/o~<br />
3 x 10 s<br />
x ~ ~ . _ x<br />
x-- 1.6 x 10⁶ --X<br />
Fig 35 Local mean-local alternating stress diagram for unbushed lugs<br />
Fig 35<br />
I<br />
,~00
70<br />
6O<br />
E<br />
z 50<br />
~E<br />
Ul<br />
I/1<br />
E<br />
30<br />
C<br />
"~ 20<br />
fll<br />
e-<br />
10<br />
0<br />
- Z<br />
IN<br />
120<br />
I/1<br />
I/1<br />
-~80-<br />
m<br />
I/1<br />
O!<br />
t--<br />
5-.<br />
.JO<br />
60 -<br />
I/1<br />
E ~0 -<br />
o ~<br />
c-<br />
¢::<br />
~,20-<br />
- 0<br />
103<br />
Unbushed achieved<br />
\<br />
Bushed predicted performance from local stress measurements<br />
performance ~ , ~ . ~ - achieved per formance<br />
I I I J<br />
104 105 106 10 ?<br />
Log mean endurance (cycles)<br />
Fig 36 Estimation <strong>of</strong> endurance <strong>of</strong> bushed lugs using local stress<br />
history measurements. Mean stress = 153(95) MN/m2<br />
"il<br />
m o
A<br />
I/I<br />
70<br />
60<br />
50<br />
40<br />
f..<br />
u~ 30<br />
E<br />
¢...<br />
o - -<br />
~ 20<br />
C<br />
m<br />
10 -<br />
120<br />
C~<br />
w-<br />
°m<br />
,bJ<br />
t~<br />
e-<br />
+.~ 20 -<br />
0- 0 103<br />
- \<br />
~ X Bushed predicted<br />
- J<br />
_ \<br />
_/_,,<br />
Unbushed estimated achieved per ormance~ ,,<br />
- from fatigue test results ~ ~<br />
perform ante<br />
Bushed<br />
J<br />
from local stress measurements<br />
achieved performance<br />
I I I I<br />
10 ~ 105 106 10 ?<br />
Log mean endurance (cycles)<br />
Fig 37 Estimation <strong>of</strong> endurance <strong>of</strong> bushed lugs using local stress<br />
history measurements. Mean stress = 225(140) MN/m2<br />
_-q.<br />
¢Q<br />
¢0
Fig 38<br />
N<br />
E<br />
Z<br />
i/1<br />
ul<br />
P<br />
A<br />
Tensile stre ss-~ ~ _ ~<br />
spring<br />
Lug<br />
-Spring<br />
inside<br />
Fig 39 Simulation <strong>of</strong> bush by a spring in compression<br />
in compression<br />
hole<br />
Fig 39
m<br />
u<br />
o<br />
.,.I<br />
Sin1<br />
StuB<br />
0<br />
Local stress due to external toad<br />
÷<br />
Local stress due to<br />
bush<br />
Time<br />
Time T<br />
m<br />
m<br />
Sm 2<br />
Fig 40 Effect <strong>of</strong> bush on local stress history in a lug<br />
0<br />
Local stress in interference fit lug<br />
Sm 2=Sml+Sm B (Mean stress)<br />
Saz=Sat-SaB (Alternating<br />
Time T<br />
stress)<br />
v<br />
=11<br />
m o<br />
4==<br />
O
IJ.<br />
141<br />
.E<br />
u<br />
x<br />
0<br />
, m<br />
0 ~<br />
m<br />
o<br />
a~<br />
IO_ 0 0<br />
-~<br />
10 -1<br />
10 .2<br />
I 0 "3<br />
1 0 -4<br />
lO-5<br />
io-6<br />
45.9<br />
\<br />
10<br />
(F/o rms) 2<br />
/<br />
(28.5) MN/m 2<br />
32.2<br />
/<br />
(20)<br />
/<br />
/<br />
20<br />
MN/m 2<br />
Fig 41 Measured load spectra at mean stress = 153(95) MN/m 2 at various rms<br />
alternating stress levels<br />
Fig41
Fig 42<br />
U.<br />
LU<br />
e-<br />
~P<br />
X<br />
O<br />
.D<br />
nl<br />
.O<br />
O<br />
Q.<br />
( F/o rms) 2<br />
0 10 20<br />
10 -0 ~ ~ ]<br />
10-1<br />
1 0 -2<br />
10 -3<br />
10 -t,<br />
10-5<br />
10-6<br />
48.3 (30) MN/m 2<br />
32 2 (20) MN/m 2<br />
16.1 (10) MN/m 2<br />
Fig 42 Measured load spectra at mean stress = 225(140) MN/m 2 at various rms<br />
alternating stress levels
E<br />
800<br />
700<br />
600<br />
Z<br />
~E 500<br />
c-<br />
m<br />
ul<br />
~00<br />
- 300<br />
r~<br />
(D<br />
....I<br />
200<br />
100<br />
0<br />
I<br />
100<br />
Constant life lines<br />
I I I<br />
200 300 400<br />
Local mean stress MN/m 2<br />
Bushes passivated<br />
Locus <strong>of</strong> results at mean stress =153 (95) MN/m 2<br />
Locus <strong>of</strong> results at mean stress = 225 (1/~0)MN/m 2<br />
I I<br />
5OO 600<br />
Fig 43 Local mean-local alternating stress diagram for bushed lugs "I1<br />
m °<br />
4~
© Crown copyright 1979<br />
First published 1979<br />
HER MA3ESTY'S STATIONERY OFFICE<br />
Government Bookshops<br />
49 High Holbom, London WCIV 6HB<br />
13a Castle Street, Edinburgh EH2 3AR<br />
41 The Hayes, Cardiff CFI 1JW<br />
Brazennose Street, Manchester M60 8AS<br />
Southey House, Wine Street, Bristol <strong>BS</strong>1 2BQ<br />
258 Broad Street, Birmingham BI 2HE<br />
80 Chichester Street, Belfast BT1 4JY<br />
Government Publications are also available<br />
through booksellers<br />
R &M No.3835<br />
ISBN Of] 471168 2