polarimetric sar for geomorphic mapping in the intertidal ... - GeoGratis
polarimetric sar for geomorphic mapping in the intertidal ... - GeoGratis
polarimetric sar for geomorphic mapping in the intertidal ... - GeoGratis
You also want an ePaper? Increase the reach of your titles
YUMPU automatically turns print PDFs into web optimized ePapers that Google loves.
November 2001<br />
Prepr<strong>in</strong>t/Prétirage<br />
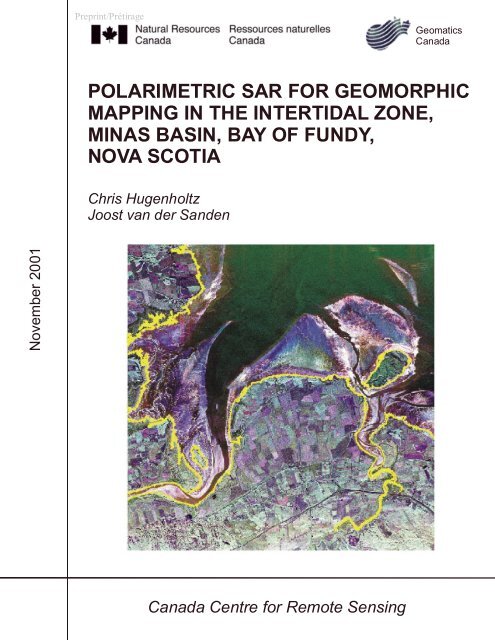
POLARIMETRIC SAR FOR GEOMORPHIC<br />
MAPPING IN THE INTERTIDAL ZONE,<br />
MINAS BASIN, BAY OF FUNDY,<br />
NOVA SCOTIA<br />
Chris Hugenholtz<br />
Joost van der Sanden<br />
Canada Centre <strong>for</strong> Remote Sens<strong>in</strong>g<br />
Geomatics<br />
Canada
Hugenholtz and van der Sanden: POLARIMETRIC SAR FOR GEOMORPHIC MAPPING 1<br />
SUMMARY<br />
The purpose of this study was to assess <strong>the</strong> potential of airborne <strong>polarimetric</strong> Syn<strong>the</strong>tic<br />
Aperture Radar (SAR) data <strong>for</strong> <strong>geomorphic</strong> <strong>mapp<strong>in</strong>g</strong> of <strong>in</strong>tertidal terra<strong>in</strong>. The study is part of<br />
ongo<strong>in</strong>g applications development research at <strong>the</strong> Canada Centre <strong>for</strong> Remote Sens<strong>in</strong>g<br />
(CCRS) <strong>in</strong> preparation <strong>for</strong> <strong>the</strong> launch of RADARSAT-2 <strong>in</strong> 2003. Calibrated <strong>polarimetric</strong><br />
Convair-580 SAR data were acquired dur<strong>in</strong>g low tide conditions over <strong>the</strong> sou<strong>the</strong>rn Bight of<br />
M<strong>in</strong>as Bas<strong>in</strong>, Bay of Fundy, Nova Scotia, <strong>in</strong> November 1999. It is shown that <strong>the</strong>re is a<br />
significant improvement <strong>in</strong> <strong>geomorphic</strong> target identification and discrim<strong>in</strong>ation when fully<br />
<strong>polarimetric</strong> SAR data are used. Qualitative analysis of <strong>the</strong> SAR power images reveals <strong>the</strong><br />
relative importance of surface and vegetation scatter <strong>in</strong> <strong>the</strong> <strong>in</strong>tertidal terra<strong>in</strong>. Strong<br />
backscatter contrasts <strong>in</strong> <strong>the</strong> l<strong>in</strong>ear polarizations enabled del<strong>in</strong>eation of <strong>the</strong> boundaries<br />
between various tidal sub-environments. The cross-polarized channel return (HV) was <strong>the</strong><br />
optimal polarization <strong>for</strong> del<strong>in</strong>eat<strong>in</strong>g <strong>the</strong> mean high water l<strong>in</strong>e. The HH-polarized channel<br />
return (HH) was <strong>the</strong> optimal polarization <strong>for</strong> del<strong>in</strong>eat<strong>in</strong>g <strong>the</strong> mean low water l<strong>in</strong>e and<br />
enabled differentiation of <strong>in</strong>tertidal sediment classes. Comparison of co-polarized<br />
<strong>polarimetric</strong> response plots from different tidal sub-environments with previous studies<br />
reveals <strong>the</strong> importance of surface roughness as <strong>the</strong> dom<strong>in</strong>ant target scatter<strong>in</strong>g mechanism<br />
<strong>in</strong> <strong>the</strong> <strong>in</strong>tertidal zone. An unsupervised classification of target scatter<strong>in</strong>g behaviour shows<br />
good agreement with <strong>the</strong> known distribution of <strong>in</strong>tertidal vegetation and sediment<br />
characteristics.
Hugenholtz and van der Sanden: POLARIMETRIC SAR FOR GEOMORPHIC MAPPING 2<br />
1. INTRODUCTION<br />
Conventional <strong>geomorphic</strong> <strong>mapp<strong>in</strong>g</strong> of <strong>the</strong> <strong>in</strong>tertidal zone from land-based (i.e., geodetic) and<br />
ship-based (i.e., echo-sound<strong>in</strong>g) surveys is extremely time consum<strong>in</strong>g and expensive.<br />
Fur<strong>the</strong>rmore, <strong>in</strong>tertidal zones, particularly those characterized by extensive mud deposits,<br />
are difficult to measure because of <strong>the</strong>ir <strong>in</strong>accessibility and <strong>the</strong> dangers posed by <strong>the</strong> mud<br />
and tides. Increas<strong>in</strong>gly, remote sens<strong>in</strong>g is be<strong>in</strong>g used as an alternative method <strong>for</strong> rapidly<br />
del<strong>in</strong>eat<strong>in</strong>g and classify<strong>in</strong>g <strong>in</strong>tertidal areas (e.g., Yates et al., 1993; Lohani and Mason,<br />
1999; Ra<strong>in</strong>ey et al., 2000). These data are critical <strong>for</strong> monitor<strong>in</strong>g spatially distributed<br />
sedimentary and biologic processes <strong>in</strong> <strong>in</strong>tertidal zones and provide important <strong>in</strong>sight <strong>in</strong>to<br />
ecosystem structure and dynamics. The potential <strong>for</strong> systematic coverage from satellite<br />
remote sens<strong>in</strong>g plat<strong>for</strong>ms and <strong>the</strong> synoptic <strong>in</strong><strong>for</strong>mation <strong>in</strong>herent <strong>in</strong> <strong>the</strong>se data can improve<br />
our understand<strong>in</strong>g of <strong>the</strong> impacts of global change, particularly related to sea-level changes.<br />
A number of satellite and airborne remote sens<strong>in</strong>g studies have attempted to map <strong>the</strong><br />
<strong>in</strong>tertidal zone, focuss<strong>in</strong>g primarily on <strong>the</strong> nature and distribution of <strong>in</strong>tertidal sediments and<br />
land<strong>for</strong>ms. Studies <strong>in</strong>volv<strong>in</strong>g optical plat<strong>for</strong>ms (e.g., Bartholdy and Folv<strong>in</strong>g, 1986; Yates et<br />
al., 1993; Ra<strong>in</strong>ey et al., 2000) have contributed to our understand<strong>in</strong>g of <strong>in</strong>tertidal ecology,<br />
morphodynamics and pollution processes. However, systematic coverage with optical<br />
devices is problematic because atmospheric phenomena such as clouds effectively mask<br />
certa<strong>in</strong> regions dur<strong>in</strong>g image acquisition. These effects limit <strong>the</strong> usefulness of optical<br />
devices, especially <strong>in</strong> cloud- and fog-prone coastal areas.<br />
Radar plat<strong>for</strong>ms provide a strategic advantage over optical plat<strong>for</strong>ms, particularly <strong>for</strong><br />
operational users, by enabl<strong>in</strong>g systematic coverage (satellite plat<strong>for</strong>ms) and different<br />
<strong>in</strong><strong>for</strong>mation (i.e., structural). Studies <strong>in</strong> <strong>in</strong>tertidal areas us<strong>in</strong>g SAR have used both s<strong>in</strong>glefrequency/s<strong>in</strong>gle-polarization<br />
data (e.g., Tittley, 1990; Tittley and Werle, 1997) and multifrequency/multi-polarization<br />
data (Melsheimer et al., 1998; Tanck et al., 1999). In contrast to<br />
<strong>the</strong> s<strong>in</strong>gle-polarization data currently available from satellite plat<strong>for</strong>ms (e.g., Radarsat, ERS),<br />
fully-<strong>polarimetric</strong> SAR data provides <strong>in</strong><strong>for</strong>mation on <strong>the</strong> complete scatter<strong>in</strong>g matrix of imaged<br />
targets. These data are particularly well suited <strong>for</strong> studies on structural elements <strong>in</strong> <strong>the</strong><br />
<strong>in</strong>tertidal zone. Geomorphic targets of <strong>in</strong>terest <strong>in</strong> <strong>the</strong> <strong>in</strong>tertidal zone <strong>in</strong>clude: sediment type,<br />
tidal creeks, ephemeral bed<strong>for</strong>m features, sandbars, bedrock outcrops, and vegetation.<br />
In this study we use C-Band fully-<strong>polarimetric</strong> SAR imagery collected aboard Environment<br />
Canada’s CV-580 aircraft over <strong>the</strong> sou<strong>the</strong>rn Bight of <strong>the</strong> M<strong>in</strong>as Bas<strong>in</strong>, Bay of Fundy, Nova<br />
Scotia, Canada. The data were collected dur<strong>in</strong>g low-tide conditions on November 10, 1999<br />
<strong>in</strong> an east-to-west direction. The purpose of <strong>the</strong> study was to explore <strong>the</strong> potential of<br />
airborne POL-SAR to dist<strong>in</strong>guish various <strong>geomorphic</strong> targets <strong>in</strong> <strong>the</strong> <strong>in</strong>tertidal zone as an<br />
analogue <strong>for</strong> future POL-SAR satellites such as RADARSAT-2.<br />
2. BACKGROUND<br />
2.1 Polarimetric SAR (POL-SAR)<br />
Polarimetric SAR (POL-SAR) is a technology that exploits <strong>the</strong> polarized nature of<br />
electromagnetic waves <strong>in</strong> order to extrapolate multi-dimensional <strong>in</strong><strong>for</strong>mation from imaged<br />
targets. The polarization of a wave is <strong>the</strong> description of <strong>the</strong> spatial orientation of <strong>the</strong> electric
Hugenholtz and van der Sanden: POLARIMETRIC SAR FOR GEOMORPHIC MAPPING 3<br />
vector <strong>for</strong> a given wave. In s<strong>in</strong>gle-polarization SAR’s <strong>the</strong> electric field is recorded as ei<strong>the</strong>r<br />
H- or V-polarized waves and a s<strong>in</strong>gle scatter<strong>in</strong>g coefficient is measured <strong>for</strong> thousands of<br />
po<strong>in</strong>ts <strong>in</strong> <strong>the</strong> scene. In this configuration SAR’s only measure a scalar quantity and loose <strong>the</strong><br />
polarization properties of <strong>the</strong> reflected wave. In fully <strong>polarimetric</strong> SAR’s <strong>the</strong> polarization of<br />
<strong>the</strong> reflected wave is measured as a vector quantity and <strong>the</strong> polarization signature of every<br />
resolution cell is recorded.<br />
The electric field (E) of a multi-polarized wave consists of <strong>the</strong> vector sum of <strong>the</strong> H- and Vpolarized<br />
electric field components. The phase difference between <strong>the</strong>se two components<br />
results <strong>in</strong> a wave hav<strong>in</strong>g ei<strong>the</strong>r a l<strong>in</strong>ear, elliptical or circular polarization. The rotation<br />
direction of <strong>the</strong> wave is def<strong>in</strong>ed by two parameters: ellipticity angle (χ) and orientation angle<br />
(Ψ). Ellipticity ranges between -45º (right-handed) and 45º (left-handed). For l<strong>in</strong>early<br />
polarized waves, χ is equal to 0º. For circularly polarized waves, χ is equal to ± 45º. The<br />
orientation angle is ei<strong>the</strong>r 0º or 180º <strong>for</strong> H-polarization and 90º <strong>for</strong> V-polarization.<br />
Fully <strong>polarimetric</strong> SAR data provides <strong>the</strong> 2 × 2 target scatter<strong>in</strong>g matrix (also referred to as<br />
<strong>the</strong> S<strong>in</strong>clair scatter<strong>in</strong>g matrix):<br />
S HH S HV <br />
S <br />
<br />
<br />
<br />
(eq. 1)<br />
S VH S VV <br />
Knowledge of <strong>the</strong> scatter<strong>in</strong>g matrix permits calculation of <strong>the</strong> received power <strong>for</strong> any<br />
comb<strong>in</strong>ation of transmit and receive antennas and is referred to as polarization syn<strong>the</strong>sis<br />
(van Zyl and Zebker, 1990). Reciprocity dictates that SHV = SVH <strong>for</strong> monostatic polarimeters<br />
where <strong>the</strong> target is not affected by Faraday rotation.<br />
POL-SAR data is neces<strong>sar</strong>ily large and often beyond <strong>the</strong> process<strong>in</strong>g capabilities of many<br />
users. For reasons of data handl<strong>in</strong>g efficiency, <strong>in</strong>dividual measurements are comb<strong>in</strong>ed to<br />
<strong>for</strong>m <strong>the</strong> Stokes matrix or covariance matrix which preserve <strong>the</strong> polarization, amplitude and<br />
phase <strong>in</strong><strong>for</strong>mation (cf. van Zyl and Zebker, 1990; Boerner et al., 1998). The state of<br />
polarization of a wave can be expressed <strong>in</strong> terms of <strong>the</strong> Stokes parameters:<br />
S1 = So cos (2ψ) cos (2Χ) (eq. 2a)<br />
S2 = So s<strong>in</strong> (2ψ) cos (2Χ) (eq. 2b)<br />
S3 = So s<strong>in</strong> (2Χ) (eq. 2c)<br />
where So is <strong>the</strong> radius of <strong>the</strong> Po<strong>in</strong>caré sphere and is proportional to <strong>the</strong> total power <strong>in</strong> <strong>the</strong><br />
wave (van Zyl et al., 1987).<br />
The Stokes matrix uses <strong>the</strong> four Stokes parameters from <strong>the</strong> transmitted wave:<br />
R<br />
S<br />
0 <br />
<br />
S1<br />
<br />
S<br />
<br />
2 <br />
S<br />
<br />
3 <br />
T<br />
S0<br />
<br />
<br />
~ S1<br />
<br />
[ R][<br />
R][<br />
M ]<br />
(eq. 3)<br />
S <br />
2 <br />
S <br />
3
Hugenholtz and van der Sanden: POLARIMETRIC SAR FOR GEOMORPHIC MAPPING 4<br />
where <strong>the</strong> superscripts T and R represent <strong>the</strong> transmit and received waves respectively. The<br />
Stokes matrix [M] can be expressed as:<br />
where ~ denotes matrix transpose and [W] is def<strong>in</strong>ed by:<br />
where * denotes <strong>the</strong> complex conjugate and:<br />
[<br />
~<br />
1<br />
1<br />
M ] [ R]<br />
[ W ][ R]<br />
(eq. 4)<br />
*<br />
*<br />
*<br />
*<br />
S<br />
<br />
HH SHH<br />
S HV S HV SHH<br />
SHV<br />
SHV<br />
SHH<br />
<br />
<br />
*<br />
*<br />
*<br />
*<br />
S<br />
<br />
VH SVH<br />
SVV<br />
SVV<br />
SVH<br />
SVV<br />
SVV<br />
SVH<br />
[ W ] <br />
<br />
(eq. 5)<br />
*<br />
*<br />
*<br />
*<br />
SHH<br />
SVH<br />
S HV SVV<br />
S HHS<br />
VV SHV<br />
SVH<br />
<br />
*<br />
*<br />
*<br />
* <br />
SVH<br />
SHH<br />
SVV<br />
SHV<br />
SVH<br />
S HV SVV<br />
SHH<br />
<br />
1<br />
1 0<br />
<br />
1<br />
1<br />
0<br />
R 0<br />
0 1<br />
<br />
<br />
0<br />
0 i<br />
0 <br />
<br />
0<br />
1<br />
<br />
i<br />
<br />
(eq. 6)<br />
The assumption of reciprocity causes [M] to be symmetrical and makes this 4 x 4 matrix fully<br />
describable with just ten <strong>in</strong>dependent elements. These ten parameters can be used to<br />
derive various scene statistics:<br />
M11 = ¼(|S’HH| 2 + |S’VV| 2 + 2|S’HV| 2 ) (eq. 7a)<br />
M12 = ¼(|S’HH| 2 - |S’VV| 2 ) (eq. 7b)<br />
M13 = ½Re(S’*HHS’HV + S’*VVS’HV) (eq. 7c)<br />
M14 = ½Im(S’*HHS’HV – S’*VVS’HV) (eq. 7d)<br />
M22 = ¼(|S’HH| 2 + |S’VV| 2 – 2|S’HV| 2 ) (eq. 7e)<br />
M23 = ½Re(S’*HHS’HV – S’*VVS’HV) (eq. 7f)<br />
M24 = ½Im(S’*HHS’HV + S’*VVS’HV) (eq. 7g)<br />
M33 = ½|S’HV| 2 + ½Re(S’*HHS’VV) (eq. 7h)<br />
M34 = ½Im(S’*HHS’VV) (eq. 7i)<br />
M44 = ½|S’HV| 2 – ½Re(S’*HHS’VV) (eq. 7j)
Hugenholtz and van der Sanden: POLARIMETRIC SAR FOR GEOMORPHIC MAPPING 5<br />
2.2 Backscatter properties of tidal sub-environments<br />
The differential radar cross-section (σº) is a response to both surface and system<br />
parameters. Surface parameters <strong>in</strong>clude surface roughness (i.e., centimeter to meter scale)<br />
and soil dielectric properties attributable to m<strong>in</strong>eralogy, gra<strong>in</strong> size, soil moisture, and soil<br />
structure. System parameters <strong>in</strong>clude wavelength (λ), look angle and direction, <strong>in</strong>cident<br />
angle (θº<strong>in</strong>c), and polarization. Radar <strong>in</strong>teraction with surficial deposits can occur at two<br />
levels: (1) accord<strong>in</strong>g to <strong>the</strong> roughness of <strong>the</strong> imaged ground (microtopography) and (2),<br />
s<strong>in</strong>gle- or double-bounce <strong>in</strong>teractions with large <strong>in</strong>dividual objects, from pebbles to boulders,<br />
whose size is similar or greater than <strong>the</strong> radar wavelength (Boerner et al., 1998). L<strong>in</strong>ear copolarized<br />
microwaves (i.e., HH and VV) are generally more sensitive to <strong>the</strong> orientation of <strong>the</strong><br />
target relative to <strong>the</strong> transmitted polarization whereas cross-polarized waves (i.e., HV) are<br />
more sensitive to multiple scatter at <strong>the</strong> surface and, if penetration occurs, volume scatter<strong>in</strong>g<br />
from <strong>the</strong> subsurface.<br />
The <strong>in</strong>tertidal zone <strong>in</strong> macrotidal bas<strong>in</strong>s is typically characterized by gentle topography with<br />
broad sand/mudflats dissected by tidal creeks (e.g., Severn River, United K<strong>in</strong>gdom; San<br />
Sebastian Bay, Argent<strong>in</strong>a; and <strong>the</strong> Bay of Fundy, Canada). The backscatter coefficient from<br />
<strong>the</strong>se broad <strong>in</strong>tertidal areas is largely a response to variations <strong>in</strong> aquatic vegetation, gra<strong>in</strong><br />
size, moisture content and surface roughness. In recent SAR studies on <strong>in</strong>tertidal<br />
sediments, Melcheimer et al. (1998) and Tanck et al. (1999) explored multi-frequency/multipolarization<br />
SIR-C/X-SAR images from <strong>the</strong> Wadden Sea at low tide. Results from <strong>the</strong>se<br />
studies <strong>in</strong>dicated that <strong>the</strong> radar backscatter was ma<strong>in</strong>ly controlled by <strong>the</strong> surface roughness<br />
attributable to ebb and tide current structures ra<strong>the</strong>r than soil moisture.<br />
3. STUDY AREA<br />
M<strong>in</strong>as Bas<strong>in</strong> is a large macrotidal bas<strong>in</strong> located <strong>in</strong> <strong>the</strong> upper reaches of <strong>the</strong> Bay of Fundy<br />
(Figure 1). The area is characterized by one of <strong>the</strong> largest semidiurnal tidal ranges <strong>in</strong> <strong>the</strong><br />
world. Average tidal amplitude is 11.5 m, rang<strong>in</strong>g up to 15 m (Yeo and Risk, 1981) with a<br />
period of oscillation of 6.29 hours (approximat<strong>in</strong>g a semidiurnal period). Tidal velocities are<br />
extreme, reach<strong>in</strong>g up to 11 knots and generally 3-4 knots <strong>in</strong> <strong>the</strong> open bas<strong>in</strong> (Middleton,<br />
1972). Due to <strong>the</strong> Coriolis effect, <strong>the</strong> flood<strong>in</strong>g tide moves along <strong>the</strong> sou<strong>the</strong>rn marg<strong>in</strong> of <strong>the</strong><br />
Bay, while <strong>the</strong> ebb moves along <strong>the</strong> nor<strong>the</strong>rn marg<strong>in</strong>, result<strong>in</strong>g <strong>in</strong> a counter-clockwise tidal<br />
system (Swift and McMullen, 1968).<br />
The entrance to M<strong>in</strong>as Bas<strong>in</strong> from <strong>the</strong> Bay of Fundy (M<strong>in</strong>as Passage) is constricted by Cape<br />
Split, a <strong>for</strong>mation of resistant Triassic basalts (Swift and McMullen, 1968), <strong>the</strong> shape of<br />
which is a result of <strong>the</strong> Fundy Syncl<strong>in</strong>e plung<strong>in</strong>g westward through Scots Bay (Middleton,<br />
1972). This narrow passage plays a crucial role <strong>in</strong> amplify<strong>in</strong>g <strong>the</strong> tidal range. Petrographic<br />
studies show that <strong>the</strong> deeper parts of <strong>the</strong> Bas<strong>in</strong> are underla<strong>in</strong> by a diamicton overly<strong>in</strong>g<br />
Triassic bedrock. The diamicton is thought to have orig<strong>in</strong>ated from <strong>the</strong> late Quaternary and<br />
is overla<strong>in</strong> by stratified deposits of fluvial and mar<strong>in</strong>e outwash sediments (Swift and<br />
McMullen, 1968).<br />
Tidal fluxes play an important role <strong>in</strong> <strong>the</strong> sedimentary regime of <strong>the</strong> M<strong>in</strong>as Bas<strong>in</strong>. Tides<br />
control <strong>the</strong> distribution of sediment and <strong>the</strong> morphology of ephemeral features such as<br />
migrat<strong>in</strong>g sand wave fields. Because of <strong>the</strong> large tidal range <strong>in</strong> <strong>the</strong> Bas<strong>in</strong>, <strong>the</strong> <strong>in</strong>tertidal zone<br />
is an extremely extensive ecosystem (Thomas, 1977). Bousfield and Leim (1960) <strong>in</strong>dicate<br />
that more than one-third of <strong>the</strong> bottom is exposed at low tide.
Hugenholtz and van der Sanden: POLARIMETRIC SAR FOR GEOMORPHIC MAPPING 6<br />
FIGURE 1: Location of study area. Four dist<strong>in</strong>ct regions are identified: (A) South, (B) Sou<strong>the</strong>ast, (C) Southwest,<br />
(D) Northwest. Location of POL-SAR image specified by box.<br />
The <strong>in</strong>tertidal sediment distribution <strong>in</strong> <strong>the</strong> study area can be separated <strong>in</strong>to four major<br />
regions (Figure 1): sou<strong>the</strong>rn, sou<strong>the</strong>astern, southwestern and northwestern. The least<br />
extensive <strong>in</strong>tertidal zone is found along <strong>the</strong> shore of <strong>the</strong> northwestern side of <strong>the</strong> bas<strong>in</strong>,<br />
correspond<strong>in</strong>g to <strong>the</strong> location of highly erosive Triassic sandstone cliffs and strong<br />
anisotropic ebb and tide currents. Similar anisotropic currents occur along <strong>the</strong> sou<strong>the</strong>ast<br />
region at <strong>the</strong> mouth of <strong>the</strong> Avon River, but <strong>the</strong> <strong>in</strong>tertidal zone is slightly greater <strong>in</strong> extent and<br />
<strong>the</strong>re are numerous limestone bedrock outcrops with irregularly modulated expressions<br />
(karstic). More extensive <strong>in</strong>tertidal areas are found along <strong>the</strong> sou<strong>the</strong>rn and southwestern<br />
shores where <strong>the</strong> current velocities decrease substantially, enabl<strong>in</strong>g deposition of f<strong>in</strong>e<br />
sediment and result<strong>in</strong>g <strong>in</strong> extensive mud and sand deposits and salt marshes. One<br />
particularly <strong>in</strong>terest<strong>in</strong>g feature at <strong>the</strong> sou<strong>the</strong>rn <strong>in</strong>tertidal mudflat is <strong>the</strong> widespread<br />
occurrence of boulders <strong>in</strong> <strong>the</strong> muddy sediment (Figure 2). Accord<strong>in</strong>g to observations by<br />
Knight and Dalrymple (1976) <strong>the</strong>se boulders represent ice-rafted material deposited dur<strong>in</strong>g<br />
w<strong>in</strong>ter conditions.<br />
4. DESCRIPTION OF DATA<br />
The POL-SAR data used <strong>in</strong> this study were collected by Environment Canada’s CV580<br />
aircraft <strong>in</strong> an east-west direction on November 10, 1999, between 12:06:23.648002 and<br />
12:12:10.74000 UTC. The SAR onboard <strong>the</strong> CV580 (Liv<strong>in</strong>gstone et al., 1995) was<br />
developed by <strong>the</strong> Canada Centre <strong>for</strong> Remote Sens<strong>in</strong>g (CCRS). The data consist of<br />
radiometrically corrected fully-<strong>polarimetric</strong> data <strong>in</strong> C-Band (λ = 5.6 cm), S<strong>in</strong>gle-look Complex<br />
(SLC), 32bit float<strong>in</strong>g po<strong>in</strong>t <strong>for</strong>mat. The fly<strong>in</strong>g altitude was approximately 6015 m and <strong>the</strong>
Hugenholtz and van der Sanden: POLARIMETRIC SAR FOR GEOMORPHIC MAPPING 7<br />
resolution of <strong>the</strong> data was approximately 4 m <strong>in</strong> slant range by 0.42 m <strong>in</strong> azimuth. A series<br />
of n<strong>in</strong>e corner reflectors were used <strong>for</strong> calibration dur<strong>in</strong>g image acquisition.<br />
A B<br />
FIGURE 2: A) Photograph of a large ice-rafter boulder at Evangel<strong>in</strong>e Beach mudflat. Note <strong>the</strong> large water-filled<br />
scour mark around <strong>the</strong> boulder. The boulder height is approximately 0.5 m. B) Photograph of boulders and gravel<br />
along eastern marg<strong>in</strong> of Evangel<strong>in</strong>e Beach mudflat.<br />
5. METHODS<br />
5.1 Field Methods<br />
An <strong>in</strong>itial analysis of <strong>the</strong> <strong>in</strong>tertidal zone <strong>in</strong> <strong>the</strong> SAR image was done prior to field visits <strong>in</strong><br />
order to identify areas of <strong>in</strong>terest. Field observations were made <strong>in</strong> June and September<br />
2001 under similar conditions to when <strong>the</strong> CV580 SAR data were acquired. Surface<br />
characteristics of each terra<strong>in</strong> type were recorded <strong>in</strong> an ef<strong>for</strong>t to understand and identify <strong>the</strong><br />
features that control <strong>the</strong> backscatter observed <strong>in</strong> <strong>the</strong> SAR image. The SAR image was used<br />
to guide <strong>the</strong> field studies <strong>in</strong> different tidal sub-environments. The primary field method<br />
consisted of photograph<strong>in</strong>g various <strong>in</strong>tertidal features present with<strong>in</strong> each region. As a result<br />
of accessibility problems and <strong>the</strong> dangers imposed by <strong>the</strong> <strong>in</strong>tertidal mud deposits, only a few<br />
sub-environments could be visited.<br />
5.2 Data Process<strong>in</strong>g<br />
The complex data were provided at <strong>the</strong> POLGASP level of process<strong>in</strong>g (Hawk<strong>in</strong>s et al.,<br />
1999). The data were phase corrected, azimuth focused and motion compensated. Raw file<br />
dimensions were 65,000 pixels <strong>in</strong> azimuth and 4,096 pixels <strong>in</strong> slant range. Initially, <strong>the</strong> data<br />
were processed with a series of <strong>in</strong>dependent FORTRAN-based rout<strong>in</strong>es to trans<strong>for</strong>m <strong>the</strong><br />
complex data <strong>in</strong>to PCI (.pix) <strong>for</strong>mat and extract various scene statistics. Later, <strong>the</strong> data were<br />
entered <strong>in</strong>to <strong>polarimetric</strong> analysis software (PWS1.1) developed by R. Touzi and F.<br />
Charbonneau (CCRS). This software enabled extraction of amplitude images, polarization<br />
response plots, and phase difference images. Image visualisation was done on 32-bit<br />
imagery <strong>in</strong> PCI. Image process<strong>in</strong>g <strong>in</strong>volved contrast enhancements and filter<strong>in</strong>g to better<br />
dist<strong>in</strong>guish various terra<strong>in</strong> types.
Hugenholtz and van der Sanden: POLARIMETRIC SAR FOR GEOMORPHIC MAPPING 8<br />
6. IMAGE ANALYSIS AND INTERPRETATION<br />
Image analysis consisted of visual <strong>in</strong>terpretation of <strong>the</strong> l<strong>in</strong>ear polarization power images and<br />
<strong>the</strong> composite image. Due to <strong>the</strong> assumption of reciprocity (i.e., SHV = SVH), only <strong>the</strong> HV<br />
cross-polarized image was exam<strong>in</strong>ed. A total of five sub-regions were selected <strong>for</strong> fur<strong>the</strong>r<br />
analysis which comprise dist<strong>in</strong>ct tidal sub-environments <strong>in</strong> <strong>the</strong> M<strong>in</strong>as Bas<strong>in</strong>. The locations of<br />
<strong>the</strong> sub-regions are shown <strong>in</strong> Figure 3. They are: a) Middle Ground sandbar, b) bedrock<br />
outcrops along <strong>the</strong> eastern shore zone (Scotch Rocks), c) a large mudflat near Evangel<strong>in</strong>e<br />
Beach, d) <strong>the</strong> salt marshes of <strong>the</strong> Canard and Habitant Rivers, and e) <strong>the</strong> mudflats of <strong>the</strong><br />
Canard River Estuary (Starr’s Pt.).<br />
6.1 Middle Ground sandbar<br />
Middle Ground (Canadian Hydrographic Service, 1972) is a large <strong>in</strong>tertidal sandbar located<br />
at <strong>the</strong> mouth of <strong>the</strong> Avon River (Figure 3). When exposed at low tide, <strong>the</strong> bar is<br />
approximately 5.6 km <strong>in</strong> its longest dimension (a-axis) and 0.9 km wide (b-axis). The a-axis<br />
follows <strong>the</strong> local anisotropic current regime. A seismic profile <strong>in</strong> 1975 by <strong>the</strong> Bed<strong>for</strong>d Institute<br />
of Oceanography determ<strong>in</strong>ed that Middle Ground conta<strong>in</strong>s a bedrock core. The sediment<br />
and bed<strong>for</strong>m distribution have been described by Lambiase (1980). The author dist<strong>in</strong>guishes<br />
six pr<strong>in</strong>ciple bed<strong>for</strong>m zones on <strong>the</strong> bar which are characterised by four bed<strong>for</strong>m class<br />
configurations: s<strong>in</strong>uous and l<strong>in</strong>ear megaripples, l<strong>in</strong>guoid ripples, and plane bed. The<br />
megaripple bed<strong>for</strong>ms are on <strong>the</strong> order of 0.5 m <strong>in</strong> wave height and 10 m <strong>in</strong> wavelength. The<br />
ripple bed<strong>for</strong>ms are 0.05 m <strong>in</strong> height and 0.3 m <strong>in</strong> wavelength.<br />
FIGURE 3: Location of key sub-regions.
Hugenholtz and van der Sanden: POLARIMETRIC SAR FOR GEOMORPHIC MAPPING 9<br />
Figure 4 shows <strong>the</strong> three polarizations and a composite image of Middle Ground sandbar.<br />
The composite image shows that <strong>the</strong> airborne SAR is capable of resolv<strong>in</strong>g <strong>the</strong> ma<strong>in</strong><br />
structural sediment pathways of <strong>the</strong> sandbar (cf. Lambiase, 1980). Dist<strong>in</strong>ction can be made<br />
between various features <strong>in</strong>clud<strong>in</strong>g <strong>the</strong> ma<strong>in</strong> crest of <strong>the</strong> sandbar, <strong>the</strong> l<strong>in</strong>ear megaripples<br />
along <strong>the</strong> sou<strong>the</strong>rn portion of <strong>the</strong> bar, and <strong>the</strong> larger l<strong>in</strong>guoid megaripples to <strong>the</strong> north.<br />
Comparison of <strong>the</strong> three <strong>in</strong>dividual polarization power images <strong>in</strong>dicates some difference <strong>in</strong><br />
<strong>the</strong> terra<strong>in</strong> backscatter response. Bed<strong>for</strong>m structure and sediment pathways are well<br />
pronounced <strong>in</strong> all three polarizations, however, <strong>the</strong> VV-polarization reveals more of <strong>the</strong><br />
small-scale bed<strong>for</strong>m structures. In comparison, <strong>the</strong> HH-polarization image provides a better<br />
discrim<strong>in</strong>ation of <strong>the</strong> large megaripples because <strong>the</strong> horizontally transmitted electric vector<br />
couples more effectively than VV to <strong>the</strong> horizontal orientation of <strong>the</strong> ripples. A common<br />
element to all-three polarization power images is a well-def<strong>in</strong>ed bright region (high<br />
backscatter) on <strong>the</strong> western marg<strong>in</strong> of <strong>the</strong> bar. Accord<strong>in</strong>g to Lambiase (1980) this area does<br />
not correspond to any particular bed<strong>for</strong>m feature. Un<strong>for</strong>tunately, due to accessibility<br />
problems Middle Ground could not be accessed <strong>for</strong> field verification. It is possible that <strong>the</strong><br />
high return is <strong>the</strong> result of Bragg scatter<strong>in</strong>g from periodically spaced ripples <strong>for</strong>med dur<strong>in</strong>g<br />
<strong>the</strong> latter stages of <strong>the</strong> ebb. However, It is more likely that <strong>the</strong> high return is <strong>the</strong> result of<br />
scatter<strong>in</strong>g from ice-rafted boulders or gravels, s<strong>in</strong>ce <strong>the</strong>se are common <strong>in</strong> o<strong>the</strong>r portions of<br />
<strong>the</strong> bas<strong>in</strong> (cf. Knight and Dalrymple, 1976).<br />
Exam<strong>in</strong>ation of <strong>the</strong> backscatter values over various regions on <strong>the</strong> sandbar supports <strong>the</strong><br />
<strong>in</strong>itial visual <strong>in</strong>terpretation. Overall, <strong>the</strong> highest average backscatter occurs <strong>in</strong> <strong>the</strong> VVpolarization<br />
(-21.1 dB) followed by <strong>the</strong> HH- (-25.6 dB) and HV-polarizations (-37.6 dB). The<br />
greatest variability <strong>in</strong> backscatter occurs <strong>in</strong> <strong>the</strong> HH- and HV-polarizations, <strong>in</strong>dicat<strong>in</strong>g why <strong>the</strong><br />
megaripples are best visually discrim<strong>in</strong>ated <strong>in</strong> <strong>the</strong>se power images. Comparison of threedimensional<br />
surface plots of <strong>the</strong> backscatter from <strong>the</strong> megaripples provides an additional<br />
visualization of <strong>the</strong> improved imag<strong>in</strong>g potential of <strong>the</strong> HH- and HV-polarizations <strong>for</strong> large<br />
bed<strong>for</strong>ms oriented more or less parallel to <strong>the</strong> radar track (APPENDIX 1A).<br />
6.2 Eastern shore bedrock outcrops<br />
The eastern shore is characterized by extensive sand/mudflats and a series of Triassic<br />
limestone bedrock outcrops. These rocks are comparably more resistant to erosion than <strong>the</strong><br />
red Triassic sandstone common <strong>in</strong> o<strong>the</strong>r areas <strong>in</strong> <strong>the</strong> Bas<strong>in</strong> and have <strong>for</strong>med a karstic<br />
topography <strong>in</strong> <strong>the</strong> region near Scotch Rocks (Figure 3). The limestone is a member of <strong>the</strong><br />
W<strong>in</strong>dsor Group which also conta<strong>in</strong>s sandstone, siltstone, dolostone, anhydrite and gypsum<br />
(Bell, 1960). Air photos <strong>in</strong>dicate that <strong>the</strong> bedrock surface is extremely distorted along <strong>the</strong><br />
shore zone, result<strong>in</strong>g <strong>in</strong> a modulated appearance <strong>in</strong> some areas with sand deposits fill<strong>in</strong>g<br />
<strong>the</strong> depressions of <strong>the</strong> modulations <strong>in</strong> <strong>the</strong> <strong>in</strong>tertidal zone.<br />
The three-polarization power images and composite image of Scotch Rocks are shown <strong>in</strong><br />
Figure 5. Bedrock produces a high radar return relative to <strong>the</strong> surround<strong>in</strong>g <strong>in</strong>tertidal sands<br />
with <strong>the</strong> greatest contrast occurr<strong>in</strong>g <strong>in</strong> <strong>the</strong> HV- and HH-polarization images, respectively.<br />
The modulations <strong>in</strong> <strong>the</strong> bedrock are clearly dist<strong>in</strong>guished <strong>in</strong> all three polarization images.<br />
The HH image produces <strong>the</strong> best contrast with <strong>the</strong> sand <strong>in</strong> <strong>the</strong> bedrock troughs. These<br />
observations are supported by three-dimensional plots of <strong>the</strong> backscatter versus <strong>in</strong>cident<br />
angle (θº<strong>in</strong>c) and azimuth distance (APPENDIX 1B). These plots show that <strong>the</strong> VVpolarization<br />
is more sensitive to <strong>the</strong> sand and produces a higher backscatter and<br />
subsequently a higher return from <strong>the</strong> bedrock troughs. In comparison, both <strong>the</strong> HHpolarization<br />
and to a lesser extent <strong>the</strong> HV-polarization produce better backscatter contrasts<br />
because of much lower backscatter from <strong>the</strong> troughs.
Hugenholtz and van der Sanden: POLARIMETRIC SAR FOR GEOMORPHIC MAPPING 10<br />
FIGURE 4: RGB color composite (R-HH, G-HV, B-VV) and three l<strong>in</strong>ear polarizations (VV, HH, and HV,<br />
respectively) <strong>for</strong> Middle Ground sandbar. A) RGB, B) VV, C) HH, and D) HV.
Hugenholtz and van der Sanden: POLARIMETRIC SAR FOR GEOMORPHIC MAPPING 11<br />
FIGURE 5: RGB color composite (R-HH, G-HV, B-VV) and three l<strong>in</strong>ear polarizations (VV, HH, and HV,<br />
respectively) <strong>for</strong> Scotch Rocks. A) RGB, B) VV, C) HH, and D) HV.
Hugenholtz and van der Sanden: POLARIMETRIC SAR FOR GEOMORPHIC MAPPING 12<br />
FIGURE 6: RGB color composite (R-HH, G-HV, B-VV) and three l<strong>in</strong>ear polarizations (VV, HH, and HV,<br />
respectively) <strong>for</strong> Evangel<strong>in</strong>e Beach mudflat. A) RGB, B) VV, C) HH, and D) HV.
Hugenholtz and van der Sanden: POLARIMETRIC SAR FOR GEOMORPHIC MAPPING 13<br />
FIGURE 7: RGB color composite (R-HH, G-HV, B-VV) and three l<strong>in</strong>ear polarizations (VV, HH, and HV,<br />
respectively) <strong>for</strong> Canard and Habitant salt marshes. A) RGB, B) VV, C) HH, and D) HV.
Hugenholtz and van der Sanden: POLARIMETRIC SAR FOR GEOMORPHIC MAPPING 14<br />
FIGURE 8: RGB color composite (R-HH, G-HV, B-VV) and three l<strong>in</strong>ear polarizations (VV, HH, and HV,<br />
respectively) <strong>for</strong> Starr’s Po<strong>in</strong>t mudflat. A) RGB, B) VV, C) HH, and D) HV.
Hugenholtz and van der Sanden: POLARIMETRIC SAR FOR GEOMORPHIC MAPPING 15<br />
An evaluation of <strong>the</strong> average backscatter values from a portion of <strong>the</strong> modulated bedrock<br />
<strong>in</strong>dicates that VV has <strong>the</strong> highest average backscatter (-18.0 dB) followed closely by HH (-<br />
19.6 dB) and HV (-29.3 dB), respectively. The greatest variability <strong>in</strong> sigma naught occurs <strong>in</strong><br />
<strong>the</strong> HV- and HH-polarizations (S.D. values are 6.2 and 5.7, respectively). The majority of this<br />
variability is related to <strong>the</strong> reduction of backscatter from <strong>the</strong> sand <strong>in</strong> between <strong>the</strong> bedrock<br />
modulations and <strong>in</strong>dicates why <strong>the</strong> HH- and HV-polarizations provide <strong>the</strong> best contrast<br />
between bedrock and sand. It should be noted that HH often exceeds VV over <strong>the</strong><br />
bedrock because <strong>the</strong> horizontal radar waves couple more effectively with <strong>the</strong> orientation of<br />
<strong>the</strong> bedrock modulations.<br />
6.3 Intertidal mudflat at Evangel<strong>in</strong>e Beach<br />
An extensive <strong>in</strong>tertidal flat occurs at Evangel<strong>in</strong>e Beach (Figure 3). The central portion of <strong>the</strong><br />
flat is characterized by a relatively smooth gentle slope (1-2º), with no significant tidal creeks<br />
or large-scale ripple <strong>for</strong>ms. The substrate varies considerably across <strong>the</strong> flat. Sediment<br />
types range from friable sandstone to muds, sands and gravels. Small dra<strong>in</strong>age channels<br />
and ice-rafted boulders are scattered across <strong>the</strong> flat. A large channel, referred to as <strong>the</strong><br />
Guzzle, separates <strong>the</strong> flat from Boot Island. Extensive gravel and boulder deposits occur<br />
along <strong>the</strong> sides of <strong>the</strong> Guzzle (Figure 2B).<br />
The multi-polarized composite image reveals some strong contrasts <strong>in</strong> <strong>the</strong> radar return<br />
(Figure 6). The extensive green area <strong>in</strong>dicates <strong>the</strong> dom<strong>in</strong>ance of cross-polarized return<br />
which would be expected from volume or mutliple scatter<strong>in</strong>g as <strong>the</strong> result of greater<br />
depolarization. Yet <strong>the</strong>re is no vegetation <strong>in</strong> this area of <strong>the</strong> mudflat. Field observations<br />
<strong>in</strong>dicate that this surface consists primarily of friable sandstone that may have sufficient<br />
porosity to account <strong>for</strong> <strong>the</strong> depolarization. The precise depolariz<strong>in</strong>g mechanism requires<br />
fur<strong>the</strong>r study.<br />
The white areas along <strong>the</strong> eastern marg<strong>in</strong> of <strong>the</strong> mudflat <strong>in</strong>dicate strong backscatter from all<br />
polarizations. Field observations confirm that <strong>the</strong> high backscatter is from gravel deposits<br />
and ice-rafted boulders (Figure 2). A backscatter transect across <strong>the</strong> entire flat <strong>for</strong> an<br />
<strong>in</strong>cident angle range of 60 to 66º reveals some significant variations <strong>in</strong> <strong>the</strong> backscatter<br />
coefficient associated with different <strong>in</strong>tertidal features (Figure 9). Average backscatter<br />
values over <strong>the</strong> flat show that <strong>the</strong> strongest return is from <strong>the</strong> VV-polarization (-22.5 dB)<br />
followed by HH (-31.3 dB) and HV (-37.7 dB), respectively. However, <strong>the</strong>re is more<br />
variability <strong>in</strong> <strong>the</strong> HH-polarization (S.D. values: HH = 7.5, HV = 6.4 and VV = 5.0). The<br />
backscatter values from <strong>the</strong> HH- and VV-polarizations are nearly symmetric over <strong>the</strong><br />
deciduous <strong>for</strong>est along <strong>the</strong> shorel<strong>in</strong>e, but <strong>the</strong>y diverge rapidly at <strong>the</strong> edge of <strong>the</strong> near-shore<br />
gravel facies (where σºVV > σºHH). The cross-polarization backscatter drops much more than<br />
<strong>the</strong> l<strong>in</strong>ear polarizations from land <strong>in</strong>to <strong>the</strong> <strong>in</strong>tertidal zone. This is <strong>the</strong> result of high σºHV<br />
attributable to depolarization from <strong>the</strong> deciduous <strong>for</strong>est along <strong>the</strong> shorel<strong>in</strong>e and <strong>the</strong> lack of<br />
significant depolarization (i.e., low σºHV) <strong>in</strong> <strong>the</strong> <strong>in</strong>tertidal zone. The contrast <strong>in</strong> HV backscatter<br />
between land and <strong>the</strong> <strong>in</strong>tertidal zone <strong>in</strong>dicates that HV is <strong>the</strong> optimum polarization <strong>for</strong><br />
del<strong>in</strong>eat<strong>in</strong>g <strong>the</strong> mean high water l<strong>in</strong>e <strong>in</strong> POL-SAR imagery taken at low tide. It should be<br />
po<strong>in</strong>ted out that this is not neces<strong>sar</strong>ily <strong>the</strong> case at <strong>the</strong> mean low waterl<strong>in</strong>e because <strong>the</strong><br />
contrast between <strong>the</strong> two media is much lower than <strong>the</strong> co-polarizations.<br />
6.4 Salt marshes of <strong>the</strong> Canard and Habitant Estuaries<br />
Salt marshes <strong>in</strong> <strong>the</strong> M<strong>in</strong>as Bas<strong>in</strong> are raised mudflats which have <strong>for</strong>med <strong>in</strong> sheltered<br />
<strong>in</strong>tertidal areas and have been stabilized by vegetation colonization. Examples of salt<br />
marshes <strong>in</strong> M<strong>in</strong>as Bas<strong>in</strong> are shown <strong>in</strong> Figure 10. The sediment is dom<strong>in</strong>ated by f<strong>in</strong>e sand,<br />
silt and clay. Sediment supply is primarily mar<strong>in</strong>e <strong>in</strong> orig<strong>in</strong>, compared to o<strong>the</strong>r salt marshes<br />
which are usually <strong>for</strong>med from river-born sediments. The upper limit of <strong>the</strong> salt marsh <strong>for</strong>ms
Hugenholtz and van der Sanden: POLARIMETRIC SAR FOR GEOMORPHIC MAPPING 16<br />
FIGURE 9: Plot of backscatter values along a portion of <strong>the</strong> Evangel<strong>in</strong>e mudflat. Relative locations of different<br />
<strong>geomorphic</strong> targets have been verified dur<strong>in</strong>g field visits. Backscatter transect denoted <strong>in</strong> Figure 6. Curves<br />
derived from averag<strong>in</strong>g <strong>in</strong> azimuth by 200 samples per l<strong>in</strong>e.<br />
<strong>the</strong> highest high water l<strong>in</strong>e and <strong>the</strong> lower limit <strong>for</strong>ms <strong>the</strong> mean sea level. Salt marshes <strong>for</strong>m a<br />
large component of <strong>the</strong> <strong>in</strong>tertidal zone <strong>in</strong> <strong>the</strong> sou<strong>the</strong>rn Bight of <strong>the</strong> M<strong>in</strong>as Bas<strong>in</strong> (e.g.,<br />
Cornwallis, Canard, Habitant). These marshes are separated <strong>in</strong>to a lower marsh dom<strong>in</strong>ated<br />
by Spart<strong>in</strong>a alterniflora and a high marsh dom<strong>in</strong>ated by Spart<strong>in</strong>a patens. O<strong>the</strong>r plants<br />
present <strong>in</strong>clude angiosperms, algae and microscopic fungi.<br />
A B<br />
FIGURE 10: A) Photograph of patchy marsh vegetation with sandy substrate near Starr’s Po<strong>in</strong>t, B) muddy<br />
substrate at Canard River.<br />
The multi-polarization composite image reveals several important characteristics of <strong>the</strong> salt<br />
marshes, particularly spatial variations <strong>in</strong> <strong>the</strong> nature of <strong>the</strong> substrate (Figure 7). High radar<br />
return areas are found along <strong>the</strong> lower marsh near <strong>the</strong> mudflats. Field reconnaissance<br />
<strong>in</strong>dicates that <strong>the</strong>se areas have patchy vegetation and sandy soils (Figure 10A). Darker
Hugenholtz and van der Sanden: POLARIMETRIC SAR FOR GEOMORPHIC MAPPING 17<br />
areas are observed <strong>in</strong> <strong>the</strong> high marsh regions where <strong>the</strong> substrate is smoo<strong>the</strong>r and primarily<br />
composed of saturated silt and mud (Figure 10B).<br />
Comparison of <strong>the</strong> three polarization power images does not reveal any significant<br />
difference <strong>in</strong> <strong>the</strong> backscatter from <strong>the</strong> salt marshes however <strong>the</strong>re is considerable difference<br />
<strong>in</strong> some of <strong>the</strong> adjacent agricultural fields and <strong>for</strong>ests, and along <strong>the</strong> banks of <strong>the</strong> Canard<br />
River. The ma<strong>in</strong> difference between <strong>the</strong> images occurs because of multiple reflections from<br />
different vegetation types which result <strong>in</strong> depolarization and subsequently a higher<br />
backscatter <strong>in</strong> <strong>the</strong> cross-polarized channel.<br />
Exam<strong>in</strong>ation of <strong>the</strong> backscattered power along a transect across <strong>the</strong> Canard and Habitant<br />
River Estuaries reveals <strong>the</strong> effect of <strong>the</strong> salt marsh vegetation on <strong>the</strong> sigma naught values<br />
(Figure 11). All three polarizations have high values over <strong>the</strong> marsh which drop significantly<br />
over <strong>the</strong> bare surface of <strong>the</strong> tidal channels, dropp<strong>in</strong>g most <strong>for</strong> <strong>the</strong> HH- and HV-polarizations.<br />
In <strong>the</strong> marsh vegetation, <strong>the</strong> backscatter from <strong>the</strong> HH-polarization is generally higher than<br />
that from VV because of <strong>the</strong> improved penetration of <strong>the</strong> horizontally polarized<br />
electromagnetic waves <strong>in</strong>to <strong>the</strong> vertically oriented marsh vegetation, and because <strong>the</strong><br />
vertically polarized waves couple more effectively with <strong>the</strong> vegetation result<strong>in</strong>g <strong>in</strong> <strong>in</strong>creased<br />
attenuation.<br />
FIGURE 11: Plot of backscatter values along a portion of <strong>the</strong> salt marshes. The two sharp <strong>in</strong>creases <strong>in</strong> <strong>the</strong><br />
backscatter (i.e., -0.9 and 3.6 dB) are associated with reflection from metallic roofs of a poultry farm. Backscatter<br />
transect denoted <strong>in</strong> Figure 7. Curves derived from averag<strong>in</strong>g <strong>in</strong> azimuth by 200 samples per l<strong>in</strong>e.<br />
6.5 Mudflats of <strong>the</strong> Canard and Habitant Estuaries<br />
Extensive mudflats are found at <strong>the</strong> mouths of <strong>the</strong> Canard and Habitant Estuaries. The<br />
mudflats are dissected by numerous dendritic tidal creeks which have cut <strong>in</strong>to <strong>the</strong> soft<br />
mar<strong>in</strong>e deposits. Wave action is m<strong>in</strong>imal and sediment transport is largely controlled by tidal<br />
currents (Amos et al., 1988). The mudflat is biologically very active and a key feed<strong>in</strong>g<br />
ground <strong>for</strong> <strong>for</strong>ag<strong>in</strong>g shore birds. The flat off Starr’s Po<strong>in</strong>t has been studied extensively by<br />
Amos et al. (1988) <strong>for</strong> variations <strong>in</strong> <strong>the</strong> sediment bulk properties when exposed at low tide.
Hugenholtz and van der Sanden: POLARIMETRIC SAR FOR GEOMORPHIC MAPPING 18<br />
The authors noted a gradual seaward sediment gradation across <strong>the</strong> flat from f<strong>in</strong>e to coarse.<br />
Bed<strong>for</strong>ms are limited to <strong>the</strong> periphery of <strong>the</strong> flat.<br />
The multi-polarization image of <strong>the</strong> mudflats is shown <strong>in</strong> Figure 8. Tidal creeks are clearly<br />
visible on <strong>the</strong> image. The red streaks <strong>in</strong> <strong>the</strong> image are <strong>the</strong> result of system artifacts.<br />
Superimpos<strong>in</strong>g <strong>the</strong> relative location of <strong>the</strong> transect by Amos et al. (1988) shows that <strong>the</strong>re is<br />
some similarity between <strong>the</strong> brightness of <strong>the</strong> power images and <strong>the</strong> gradation of sediment<br />
from f<strong>in</strong>e to coarse. Backscatter values support <strong>the</strong>se observations and show that <strong>the</strong>re is<br />
considerably higher return from <strong>the</strong> sand <strong>in</strong> all three polarizations when compared to mud.<br />
Comparison of <strong>the</strong> amplitude images <strong>for</strong> <strong>the</strong> three polarizations shows that <strong>the</strong> two<br />
horizontal transmit polarization images provide <strong>the</strong> best contrast <strong>for</strong> discrim<strong>in</strong>at<strong>in</strong>g tidal<br />
creeks whereas <strong>the</strong> high return <strong>in</strong> <strong>the</strong> VV-polarization due to surface roughness (i.e., sand)<br />
reduces discrim<strong>in</strong>ation <strong>in</strong> some areas.<br />
7. TERRAIN POLARIZATION RESPONSE STATISTICS<br />
In this section, various terra<strong>in</strong> polarization response statistics are evaluated <strong>for</strong> eleven<br />
dist<strong>in</strong>ct <strong>geomorphic</strong> targets: water, mud, sand, silty-sand, gravel, bedrock, salt marsh with<br />
muddy substrate, salt marsh with sandy substrate, <strong>for</strong>est, small ripples, and megaripples.<br />
Analysis <strong>in</strong>volved <strong>the</strong> extraction of polarization response plots and statistics. The statistics<br />
are sigma naught <strong>for</strong> <strong>the</strong> three l<strong>in</strong>ear polarizations (σ o HH, σ o HV, σ o VV), co-polarized phase<br />
difference (ΦHH - VV), co-polarized pedestal height, total power (Stokes matrix element M11),<br />
co-polarized ratio (HH/VV), and cross-polarized ratio (HH/HV).<br />
Polarization response plots are graphical representations of <strong>the</strong> variation of co- or crosspolarization<br />
radar returns as <strong>the</strong>y are distributed over half of <strong>the</strong> Po<strong>in</strong>tcaré sphere (Boerner<br />
et al., 1998). These diagrams are used to support <strong>the</strong> identification of <strong>the</strong> target scatter<strong>in</strong>g<br />
mechanism. The backscatter range along <strong>the</strong> vertical axis is normalized between 0.0 and<br />
1.0. The horizontal axes conta<strong>in</strong> <strong>the</strong> orientation and ellipticity angles (0º to 180º and –45º to<br />
45º respectively). The pedestal height provides a measure of <strong>the</strong> unpolarized return, which<br />
<strong>in</strong> turn provides a measure of <strong>the</strong> degree of volume scatter<strong>in</strong>g and relative roughness of <strong>the</strong><br />
selected area (van Zyl et al., 1987). Total power (SPAN) is <strong>the</strong> sum of <strong>the</strong> four l<strong>in</strong>ear<br />
polarizations (eq. 7a) and is related to <strong>the</strong> roughness of <strong>the</strong> target relative to <strong>the</strong> radar<br />
wavelength (Small and Cumm<strong>in</strong>gs, 1991). The co- (HH/VV) and cross-polarized ratios<br />
(HH/HV) measure <strong>the</strong> strength of <strong>the</strong> differences between <strong>the</strong> HH and VV returns and HH<br />
and HV returns, respectively. Values approach<strong>in</strong>g 1.0 <strong>in</strong>dicate random target structure. The<br />
co-polarized phase difference provides a measure of <strong>the</strong> type of scatter<strong>in</strong>g (close to 0 <strong>for</strong><br />
s<strong>in</strong>gle bounce, 180 <strong>for</strong> double bounce and variable <strong>for</strong> multiple <strong>in</strong>teractions).<br />
S<strong>in</strong>ce ground data were unavailable dur<strong>in</strong>g <strong>the</strong> CV580 image acquisition over M<strong>in</strong>as Bas<strong>in</strong>,<br />
two approaches were taken <strong>in</strong> order to avoid ambiguities <strong>in</strong> <strong>the</strong> <strong>in</strong>terpretation of <strong>the</strong><br />
polarization response statistics and hence, <strong>in</strong> dist<strong>in</strong>gush<strong>in</strong>g different <strong>in</strong>tertidal terra<strong>in</strong> types.<br />
The approaches <strong>in</strong>volved a qualitative <strong>in</strong>tegration of ancillary data from air photos and field<br />
observations. The <strong>in</strong>itial task consisted of del<strong>in</strong>eat<strong>in</strong>g broad groups of <strong>in</strong>tertidal terra<strong>in</strong> types<br />
on air photos (1960-1995). Most of <strong>the</strong>se areas were <strong>the</strong>n field checked <strong>in</strong> June and August<br />
2001 <strong>in</strong> order to: a) identify tra<strong>in</strong><strong>in</strong>g areas which had a consistent distribution of surface<br />
roughness and moisture, and b) better understand <strong>the</strong> sediment composition. Once tra<strong>in</strong><strong>in</strong>g<br />
areas were identified, <strong>the</strong> polarization response statistics were calculated <strong>for</strong> sample sizes<br />
conta<strong>in</strong><strong>in</strong>g no less than 5500 pixels <strong>in</strong> order to ensure a statistically robust sample.
Hugenholtz and van der Sanden: POLARIMETRIC SAR FOR GEOMORPHIC MAPPING 19<br />
7.1 Polarimetric parameters<br />
The <strong>polarimetric</strong> statistics derived <strong>for</strong> various <strong>geomorphic</strong> targets are summarized <strong>in</strong> Table<br />
1. The sigma naught values show that <strong>the</strong> cross-polarized backscatter was consistently<br />
lower than <strong>the</strong> l<strong>in</strong>ear polarizations. Backscatter from HH exceeded VV <strong>for</strong> gravel, silty sand<br />
and mud. The lowest cross-pol backscatter occurred from water (-44.56) and mud (-40.92).<br />
Bedrock, <strong>for</strong>est, gravel, sand, high marsh and low marsh produced high returns <strong>in</strong> all three<br />
polarizations. The best contrast between water and <strong>the</strong> sediments was <strong>in</strong> <strong>the</strong> HH-pol. Large<br />
differences <strong>in</strong> <strong>the</strong> return from <strong>the</strong> cross-polarized and l<strong>in</strong>ear polarizations (> 15 dB) occur <strong>for</strong><br />
megaripples and silty sand, <strong>in</strong>dicat<strong>in</strong>g little depolarization of <strong>the</strong> <strong>in</strong>cident wave. With <strong>the</strong><br />
exception of sand, σVV decreases as particle size decreases. One possible reason why<br />
sand has a higher backscatter than gravel is because <strong>the</strong> surface of <strong>the</strong> sand may have<br />
been roughened by human disturbance (<strong>the</strong> location chosen <strong>for</strong> <strong>the</strong> <strong>polarimetric</strong> response of<br />
sand is commonly roughened by people walk<strong>in</strong>g on it). Backscatter values from <strong>the</strong><br />
vegetation classes are very similar, however σHH is higher from <strong>the</strong> <strong>for</strong>est (deciduous)<br />
compared to <strong>the</strong> vertically oriented marsh vegetation. It should be po<strong>in</strong>ted out that σHH and<br />
σHV from <strong>the</strong> deciduous <strong>for</strong>est are nearly equal, highlight<strong>in</strong>g <strong>the</strong> importance of volume<br />
scatter<strong>in</strong>g. HH backscatter provided <strong>the</strong> best contrast between <strong>the</strong> high and low marsh subenvironments,<br />
reflect<strong>in</strong>g <strong>the</strong> effects of <strong>the</strong> sandy substrate (low marsh) which is rougher than<br />
<strong>the</strong> muddy substrate characteristic of <strong>the</strong> high marsh sub-environment.<br />
Target<br />
Sample<br />
size<br />
(pixels)<br />
Inc.<br />
Angle<br />
(º)<br />
Co-pol<br />
Pedestal<br />
height<br />
Copolarized<br />
ratio<br />
Crosspolarized<br />
ratio<br />
Copolarized<br />
phase<br />
difference<br />
σHH<br />
(dB)<br />
σVV<br />
(dB)<br />
σHV<br />
(dB)<br />
Total<br />
power<br />
(dB)<br />
Water 7420 63.7 0.08 0.12 0.30 18.43 -39.39 -30.20 -44.56 -35.45<br />
Bedrock 5911 64.5 0.47 1.31 0.13 20.64 -12.89 -14.05 -21.80 -15.85<br />
Small ripples 7088 61.8 0.11 0.17 0.17 23.51 -30.36 -22.61 -37.96 -27.75<br />
Mega ripples<br />
Deciduous<br />
12526 66.9 0.26 0.85 0.04 36.14 -19.82 -19.13 -34.32 -22.34<br />
<strong>for</strong>est<br />
13295<br />
60.4<br />
0.56<br />
1.01<br />
Gravel 8775 60.9 0.38 0.72 0.10 48.16 -13.66 -12.24 -23.57 -15.54<br />
Sand 6314 65.2 0.55 1.36 0.15 20.93 -11.16 -12.49 -19.32 -14.08<br />
Silty sand 15619 59.4 0.23 0.47 0.06 27.50 -23.05 -19.82 -35.09 -23.98<br />
Mud<br />
Salt<br />
12651 61.4 0.21 0.39 0.09 45.53 -30.36 -26.31 -40.92 -30.68<br />
marsh/mud<br />
Salt<br />
marsh/sand<br />
11957<br />
8893<br />
61.2<br />
61.0<br />
0.45<br />
0.39<br />
1.34<br />
2.33<br />
0.21<br />
0.29<br />
0.13<br />
5.65<br />
14.05<br />
-8.66<br />
-10.40<br />
-15.01<br />
-10.57<br />
-10.46<br />
-16.28<br />
-14.25<br />
TABLE 1: Polarimetric parameters <strong>for</strong> <strong>geomorphic</strong> targets <strong>in</strong> <strong>the</strong> <strong>in</strong>tertidal zone.<br />
The SPAN or total power had a wide range of values among <strong>the</strong> different <strong>geomorphic</strong><br />
targets. Values of total power reflect <strong>the</strong> micro-scale roughness of <strong>the</strong> <strong>in</strong>dividual targets.<br />
High values of total power occur <strong>for</strong> bedrock, <strong>for</strong>est, gravel, sand and salt marsh (sandy<br />
substrate). Low values occur <strong>for</strong> smoo<strong>the</strong>r surfaces such as water, silty sand, mud and <strong>the</strong><br />
bed<strong>for</strong>m classes. The co-polarization phase difference values <strong>in</strong>dicate that <strong>the</strong> return from<br />
<strong>for</strong>est and salt marsh with sandy substrate are very similar, with <strong>the</strong> vertical phase be<strong>in</strong>g<br />
slightly smaller than <strong>the</strong> horizontal phase <strong>for</strong> <strong>the</strong> marsh (i.e., negative values). Co-pol phase<br />
difference from o<strong>the</strong>r targets shows that <strong>the</strong> horizontal phase is consistently greater than <strong>the</strong><br />
vertical phase. Pedestal height values were high (0.38 to 0.56) <strong>for</strong> bedrock, <strong>for</strong>est, gravel,<br />
sand, and <strong>the</strong> two salt marsh classes. This range is similar to <strong>for</strong>est targets reported by<br />
Zebker and van Zyl (1991). The high pedestal height <strong>for</strong> sand <strong>in</strong>dicates that it may have<br />
experienced some volume scatter<strong>in</strong>g <strong>in</strong> addition to multiple scatter<strong>in</strong>g, whereas <strong>the</strong> high<br />
pedestal <strong>for</strong> gravel and bedrock is likely attributable solely to<br />
-17.14<br />
-20.34<br />
-19.28<br />
-12.60<br />
-17.35<br />
-14.29
Hugenholtz and van der Sanden: POLARIMETRIC SAR FOR GEOMORPHIC MAPPING 20<br />
multiple reflections. The co-polarization ratios show significant difference <strong>in</strong> <strong>the</strong> l<strong>in</strong>ear<br />
polarization returns. The largest difference occurs <strong>for</strong> <strong>the</strong> salt marsh with sand substrate,<br />
because <strong>the</strong> horizontally polarized waves are more effective at penetrat<strong>in</strong>g <strong>the</strong> vertically<br />
oriented marsh vegetation, and because <strong>the</strong> vertically polarized waves couple more<br />
effectively with <strong>the</strong> vegetation result<strong>in</strong>g <strong>in</strong> <strong>in</strong>creased attenuation. Ratios above unity also<br />
occur <strong>for</strong> rough surfaces such as bedrock, <strong>for</strong>est, sand and high marsh. In contrast, low copol<br />
ratios occur <strong>for</strong> smoo<strong>the</strong>r surfaces such as water, mud, and silty sand.<br />
The effect of <strong>the</strong> co-polarization ratio can be seen clearly <strong>in</strong> <strong>the</strong> polarization response plots<br />
(APPENDIX 2). For comparative purposes <strong>the</strong>se plots were derived from a narrow <strong>in</strong>cident<br />
angle range (60-67º). Also, <strong>the</strong> response from a dihedral corner reflector deployed at M<strong>in</strong>as<br />
Bas<strong>in</strong> is <strong>in</strong>cluded. The dist<strong>in</strong>ct saddle shape produced <strong>in</strong> <strong>the</strong> response plots <strong>for</strong> bedrock,<br />
sand, both salt marsh classes, and <strong>for</strong>est confirms <strong>the</strong> dom<strong>in</strong>ance of σHH. This response is<br />
typical of double bounce reflection. There is a noticeable <strong>in</strong>crease <strong>in</strong> <strong>the</strong> HH component with<br />
<strong>in</strong>creas<strong>in</strong>g gra<strong>in</strong> size. The exception to this trend is sand because it is rougher than <strong>the</strong><br />
o<strong>the</strong>r sediments possibly as a result of human-<strong>in</strong>duced roughen<strong>in</strong>g. The peak <strong>in</strong> <strong>the</strong><br />
response from <strong>the</strong> marsh with muddy substrate is somewhat offset from an ideal HH<br />
response with orientation angle at 3. This offset <strong>in</strong>dicates that <strong>the</strong>re is a peak return from a<br />
wave oriented a few degrees off <strong>the</strong> horizontal axis. Comparison of <strong>the</strong> polarization<br />
responses derived from <strong>the</strong> different <strong>in</strong>tertidal sub-environments with <strong>the</strong>oretical responses<br />
<strong>in</strong>dicates several different scatter<strong>in</strong>g mechanisms (APPENDIX 3). None of <strong>the</strong> targets<br />
produce responses similar to a smooth dielectric surface. The responses from bedrock,<br />
sand, and both salt marsh classes are comparable to <strong>the</strong> <strong>the</strong>oretical response of a dihedral<br />
corner reflector. The response from water, mud, silty sand and gravel are comparable to <strong>the</strong><br />
response from a rough surface. Notice <strong>in</strong> APPENDIX 2 that <strong>the</strong> horizontal polarization<br />
contribution <strong>in</strong>creases progressively from water to mud, silty sand and <strong>the</strong>n gravel. Ideally,<br />
<strong>the</strong> response from sand should lie somewhere between that of silty sand and gravel.<br />
7.2 Unsupervised classification<br />
In addition to <strong>the</strong> polarization response analysis, an unsupervised classification was<br />
per<strong>for</strong>med us<strong>in</strong>g <strong>the</strong> method outl<strong>in</strong>ed by van Zyl (1989). The method classifies <strong>the</strong> dom<strong>in</strong>ant<br />
scatter<strong>in</strong>g behaviour of each pixel by compar<strong>in</strong>g <strong>the</strong> polarization properties of each pixel to<br />
one of three scatter<strong>in</strong>g classes: double bounce scatter<strong>in</strong>g, diffuse scatter<strong>in</strong>g and odd bounce<br />
scatter<strong>in</strong>g. Results from <strong>the</strong> analysis are shown <strong>in</strong> Figures 12A and B. The classifications<br />
show good agreement with <strong>the</strong> known distribution of gravel deposits (double bounce), mud<br />
deposits (odd bounce -- s<strong>in</strong>gle bounce), marsh vegetation and <strong>for</strong>est (diffuse scatter<strong>in</strong>g).<br />
The classification results over water are not valid s<strong>in</strong>ce <strong>the</strong> algorithm assumes <strong>the</strong> target to<br />
be reciprocal. It should be po<strong>in</strong>ted out that <strong>the</strong> bright area along <strong>the</strong> western marg<strong>in</strong> of<br />
Middle Ground sandbar (see section 6.1), previously expla<strong>in</strong>ed as ei<strong>the</strong>r Bragg scatter<strong>in</strong>g or<br />
scatter<strong>in</strong>g from boulders, is classified as double bounce, confirm<strong>in</strong>g that <strong>the</strong> high<br />
backscatter is from boulders. Overall, <strong>the</strong> results from <strong>the</strong> unsupervised classification add<br />
considerable support <strong>in</strong> identify<strong>in</strong>g <strong>the</strong> scatter<strong>in</strong>g mechanism and <strong>for</strong> identify<strong>in</strong>g different<br />
tidal sub-environments.<br />
8. CONCLUSIONS<br />
High-resolution fully <strong>polarimetric</strong> SAR data can provide an excellent source <strong>for</strong> <strong>the</strong><br />
identification and del<strong>in</strong>eation of <strong>geomorphic</strong> targets <strong>in</strong> <strong>the</strong> <strong>in</strong>tertidal zone. The f<strong>in</strong>d<strong>in</strong>gs<br />
presented here <strong>in</strong>dicate that <strong>polarimetric</strong> SAR data can be used to del<strong>in</strong>eate various<br />
<strong>in</strong>tertidal sediment and vegetation classes accord<strong>in</strong>g to <strong>the</strong>ir scatter<strong>in</strong>g response. The
Hugenholtz and van der Sanden: POLARIMETRIC SAR FOR GEOMORPHIC MAPPING 21<br />
A<br />
B<br />
FIGURE 12: Unsupervised classification results us<strong>in</strong>g van Zyl (1989) method (Red = double bounce, Green =<br />
diffuse scatter, Blue = odd bounce) <strong>for</strong> A) Evangel<strong>in</strong>e mudflat and B) Canard and Habitant salt marshes.
Hugenholtz and van der Sanden: POLARIMETRIC SAR FOR GEOMORPHIC MAPPING 22<br />
results from an unsupervised classification <strong>in</strong>dicate that <strong>polarimetric</strong> SAR data are useful <strong>for</strong><br />
classify<strong>in</strong>g <strong>in</strong>tertidal terra<strong>in</strong> where different scatter<strong>in</strong>g mechanisms are present. In addition to<br />
<strong>the</strong> enhanced target <strong>in</strong><strong>for</strong>mation, a prelim<strong>in</strong>ary analysis of backscatter variations from<br />
different surface types <strong>in</strong>dicates that <strong>the</strong> HH and cross-polarized channels provide excellent<br />
sources <strong>for</strong> del<strong>in</strong>eat<strong>in</strong>g <strong>the</strong> mean high water l<strong>in</strong>e or shorel<strong>in</strong>e. The improved shorel<strong>in</strong>e<br />
<strong>mapp<strong>in</strong>g</strong> potential of <strong>the</strong>se channels is <strong>the</strong> result of high backscatter contrasts between land<br />
targets and low return from both water and <strong>the</strong> <strong>in</strong>tertidal zone. Collectively <strong>the</strong>se results<br />
suggest some improvement <strong>in</strong> <strong>the</strong> potential of <strong>the</strong> fully <strong>polarimetric</strong> modes of RADARSAT-2<br />
<strong>for</strong> coastal <strong>mapp<strong>in</strong>g</strong>.<br />
9. RECOMMENDATIONS<br />
The f<strong>in</strong>d<strong>in</strong>gs presented here provide some <strong>in</strong>sight <strong>in</strong>to <strong>the</strong> <strong>in</strong><strong>for</strong>mation content of <strong>polarimetric</strong><br />
SAR <strong>for</strong> <strong>geomorphic</strong> <strong>mapp<strong>in</strong>g</strong> <strong>in</strong> <strong>the</strong> <strong>in</strong>tertidal zone of macro-tidal bas<strong>in</strong>s. However, only a<br />
limited portion of <strong>the</strong> fully <strong>polarimetric</strong> CV580 SAR data were exam<strong>in</strong>ed <strong>in</strong> this study and<br />
attempts should be made to exam<strong>in</strong>e o<strong>the</strong>r <strong>polarimetric</strong> methods <strong>for</strong> <strong>mapp<strong>in</strong>g</strong> various<br />
<strong>geomorphic</strong> targets and del<strong>in</strong>eat<strong>in</strong>g <strong>the</strong> shorel<strong>in</strong>e vector. Recent advances <strong>in</strong> <strong>polarimetric</strong><br />
SAR filter<strong>in</strong>g and classification should be exam<strong>in</strong>ed <strong>in</strong> order to identify <strong>the</strong> optimum method<br />
<strong>for</strong> classify<strong>in</strong>g <strong>geomorphic</strong> targets <strong>in</strong> <strong>the</strong> <strong>in</strong>tertidal zone and extract<strong>in</strong>g <strong>the</strong> most accurate<br />
shorel<strong>in</strong>e vector. Of particular <strong>in</strong>terest are methods developed by Lee et al. (1999), Cloude<br />
and Pottier (1997), and Yeremy et al. (2000). These methods should be exam<strong>in</strong>ed from<br />
different coastal areas <strong>in</strong> order to compare <strong>the</strong> POL-SAR data from a range of <strong>geomorphic</strong><br />
sett<strong>in</strong>gs. In addition, fur<strong>the</strong>r studies should be undertaken to explore <strong>the</strong> scatter<strong>in</strong>g<br />
properties of <strong>in</strong>tertidal sediments and coastal vegetation <strong>in</strong> order to build a comprehensive<br />
understand<strong>in</strong>g of scatter<strong>in</strong>g response from <strong>the</strong>se sub-environments.
Hugenholtz and van der Sanden: POLARIMETRIC SAR FOR GEOMORPHIC MAPPING 23<br />
10. REFERENCES<br />
Amos, C.L., N.A. Van Wagoner, and G.R. Daborn, The <strong>in</strong>fluence of subaerial exposure on <strong>the</strong> bulk<br />
properties of f<strong>in</strong>e-gra<strong>in</strong>ed <strong>in</strong>tertidal sediment from M<strong>in</strong>as Bas<strong>in</strong>, Bay of Fundy, Estuar<strong>in</strong>e, Coastal<br />
Shelf Science, 27: 1-13, 1988.<br />
Bartholdy, J., and S. Folv<strong>in</strong>g, Sediment classification and surface type <strong>mapp<strong>in</strong>g</strong> <strong>in</strong> <strong>the</strong> Dannish<br />
Wadden Sea by remote sens<strong>in</strong>g, Ne<strong>the</strong>rlands Journal of Sea Research, 20: 337-345, 1986.<br />
Bell, W.A., Mississipian Horton Group Of Type W<strong>in</strong>dsor-Horton District, Nova Scotia, Department of<br />
M<strong>in</strong>es and Technical Surveys Canada, 1960.<br />
Bousfield, E.L., and A.H. Leim, The fauna of <strong>the</strong> M<strong>in</strong>as Bas<strong>in</strong> and M<strong>in</strong>as Channel, Bullet<strong>in</strong> of <strong>the</strong><br />
National Museum of Canada, 166: 1-30, 1960.<br />
Boerner, W.M., H. Mott, E. Luneburg, C. Liv<strong>in</strong>gstone, B. Brisco, R.J. Brown, and S. Paterson,<br />
Polarimetry <strong>in</strong> Radar Remote Sens<strong>in</strong>g: Basic and Applied Concepts, In: Henderson, F.M. and A.J.<br />
Lewis, Manual of Remote Sens<strong>in</strong>g, 3 rd Edition, Vol. 2, 271-357, 1998.<br />
Canadian Hydrographic Service, Avon River and approaches; Chart 4140, 1972.<br />
Cloude, S.R., and E. Pottier, An entropy based classification scheme <strong>for</strong> land applications of<br />
<strong>polarimetric</strong> SAR image data, IEEE Transactions on Geoscience and Remote Sens<strong>in</strong>g, 35: 68-78,<br />
1997.<br />
Hawk<strong>in</strong>s, R.K., R. Touzi, and C.E. Liv<strong>in</strong>gstone, Calibration and use of CV-580 airborne <strong>polarimetric</strong><br />
SAR data, Proceed<strong>in</strong>gs of <strong>the</strong> Fourth International Airborne Remote Sens<strong>in</strong>g Conference and<br />
Exhibition / 21 st Canadian Symposium on Remote Sens<strong>in</strong>g, 2: 32-40, 1999.<br />
Knight, R.J., and R.W. Dalrymple, W<strong>in</strong>ter conditions <strong>in</strong> a macrotidal environment, Cobequid Bay,<br />
Nova Scotia, Geographie Physique et Qauternaire, 3(1-2): 65-85, 1076.<br />
Lambiase, J.J., Topographic control of sediment distribution on an <strong>in</strong>tertidal sand bar: a case study,<br />
In: McCann, S.B., The Coastl<strong>in</strong>e of Canada: Littoral processes and chore morphology, GSC Paper<br />
80-10, 181-187, 1980.<br />
Lee, J.S., M. R. Grunes, T. L. A<strong>in</strong>sworth, Li-Jen Du, Dale L. Schuler, and S. R. Cloude. Unsupervisied<br />
Classification Us<strong>in</strong>g Polarimetric Decompostion and <strong>the</strong> Complex Wishart Classifier. IEEE<br />
Transactions on Geoscience and Remote Sens<strong>in</strong>g, 37(5): 2249-2258, 1999.<br />
Liv<strong>in</strong>gstone, C.E., A.L. Gray, R.K. Hawk<strong>in</strong>s, P. Vachon, T.I. Lukowski, and M. Lalonde, The CCRS<br />
airborne SAR systems: Radar <strong>for</strong> remote sens<strong>in</strong>g research, Canadian Journal of Remote Sens<strong>in</strong>g,<br />
21(4): 468-491, 1995.<br />
Lohani, B., and D.C. Mason, Extraction of tidal channel networks from LiDAR data, Proceed<strong>in</strong>gs of<br />
<strong>the</strong> Fourth International Airborne Remote Sens<strong>in</strong>g Conference and Exhibition / 21 st Canadian<br />
Symposium on Remote Sens<strong>in</strong>g, 1: 672-679, 1999.<br />
Melsheimer, C., G. Tanck, M. Gade, and W. Alpers, Imag<strong>in</strong>g of tidal flats by <strong>the</strong> SIR-C/X-SAR multifrequency<br />
/ multi-polarization syn<strong>the</strong>tic aperture radar, In: Nieuwenhuis, G.J.A., R.A. Vaughan, and<br />
M. Molenaar, Operational Remote Sens<strong>in</strong>g <strong>for</strong> susta<strong>in</strong>able development: Proceed<strong>in</strong>gs of <strong>the</strong> 18 th<br />
EARSel Symposium on Operational Remote Sens<strong>in</strong>g <strong>for</strong> Susta<strong>in</strong>able Development, Enschede,<br />
Ne<strong>the</strong>rlands, May 11-14, 189-192, 1998.<br />
Middleton, G.V., Crief Field Guide to Interidal Sediments, M<strong>in</strong>as Bas<strong>in</strong>, Nova Scotia, Maritime<br />
Sediments, 8(3): 114-122, 1972.
Hugenholtz and van der Sanden: POLARIMETRIC SAR FOR GEOMORPHIC MAPPING 24<br />
Ra<strong>in</strong>ey, M.P., A.N. Tyler, R.G. Bryant, D.J. Gilvear, and P. McDonald, The <strong>in</strong>fluence of surface and<br />
<strong>in</strong>terstitial moisture on <strong>the</strong> spectral characteristics of <strong>in</strong>tertidal sediments: implications <strong>for</strong> airborne<br />
image acquisition and process<strong>in</strong>g, International Journal of Remote Sens<strong>in</strong>g, 21(16): 3025-3038.<br />
Small, D., and I. Cumm<strong>in</strong>g, Evaluation study on multi-frequency <strong>polarimetric</strong> SAR, F<strong>in</strong>al Report,<br />
p.102, 1991.<br />
Swift, D.J.P., and R.M. McMullen, Prelim<strong>in</strong>ary Studies of Intertidal Sand Bodies <strong>in</strong> <strong>the</strong> M<strong>in</strong>as Bas<strong>in</strong>,<br />
Bay of Fundy, Nova Scotia, Canadian Journal of Earth Sciences, 5(2): 175-183, 1968.<br />
Tanck, G., W. Alpers, and M. Gade, Determ<strong>in</strong>ation of surface roughness parameters of tidal flats from<br />
SIR-C/X-SAR 3-frequency SAR data, IGARSS ’99, 1677-1679, 1999<br />
Thomas, M.L.H., Intertidal Resources of <strong>the</strong> Bay of Fundy, In: Daborn, G.R., Fundy Tidal Power and<br />
<strong>the</strong> Environment: Proceed<strong>in</strong>gs of <strong>the</strong> Environmental Implications of Fundy Tidal Power, Wolfville,<br />
Nova Scotia, November 4-5, 148-159, 1977.<br />
Tittley, B., The Analysis and Interpretation of SAR Imagery Applied to Intertidal Zone Geomorphology,<br />
Unpublished Co-Operative Project Thesis, Nova Scotia College of Geographical Sciences,<br />
Lawrencetown, NS., 42p, 1990.<br />
Tittley, B., and D. Werle. Us<strong>in</strong>g RADARSAT-1 SAR Imagery <strong>for</strong> Coastal Zone Sensitivity Mapp<strong>in</strong>g <strong>in</strong><br />
Nova Scotia, AERDE Environmental Research, Halifax, Nova Scotia, EOP3 Contract 234-13-5 D550,<br />
72p, 1997.<br />
van Zyl, J.J., Unsupervised classification of scatter<strong>in</strong>g behavior us<strong>in</strong>g radar polarimetry data, IEEE<br />
Transactions on Geoscience and Remote Sens<strong>in</strong>g, 27: 36-45, 1989.<br />
van Zyl, J.J., and H.A. Zebker, Imag<strong>in</strong>g Radar Polarimetry, In: J.A. Kong, Progress <strong>in</strong><br />
Electromagnetics Research, Pier 3, 277-370, 1990.<br />
van Zyl, J.J., H.A. Zebker, and C. Elachi, Imag<strong>in</strong>g radar polarization signatures: Theory and<br />
observation, Radio Science, 22(4): 529-543, 1987.<br />
Yates, M.G., A.R. Jones, S. McGrorty, and J.D. Goss-Custard, The use of satellite imagery to<br />
determ<strong>in</strong>e <strong>the</strong> distribution of <strong>in</strong>tertidal surface sediments of <strong>the</strong> Wash, England, Estuar<strong>in</strong>e, Coastal<br />
and Shelf Science, 36: 333-344, 1993.<br />
Yeo, R.K., and M.J. Risk, The Sedimentology, Stratigraphy, and Preservation of Intertidal Deposits <strong>in</strong><br />
<strong>the</strong> M<strong>in</strong>as Bas<strong>in</strong> System, Bay of Fundy, Journal of Sedimentary Petrology, 51(1): 245-260, 1981.<br />
Yeremy, M., J. D. Beaudo<strong>in</strong>, G. M. Walter, and A. Beaudo<strong>in</strong>, Shorel<strong>in</strong>e <strong>mapp<strong>in</strong>g</strong> from SAR imagery: a<br />
<strong>polarimetric</strong> approach, Proceed<strong>in</strong>gs of <strong>the</strong> 22 nd Canadian Symposium on Remote Sens<strong>in</strong>g, 365-374,<br />
2000.<br />
Zebker, H.A, and J.J. van Zyl, Imag<strong>in</strong>g Radar Polarimetry: A Review, Proceed<strong>in</strong>g of <strong>the</strong> IEEE, 79(11):<br />
1583-1606, 1991.
Hugenholtz and van der Sanden: POLARIMETRIC SAR FOR GEOMORPHIC MAPPING APPENDIX 1<br />
A B<br />
APPENDIX 1: Three-dimensional plots of backscatter from A) megaripples on Middle Ground sandbar and B),<br />
modulated bedrock surface at Scotch Rocks.
Hugenholtz and van der Sanden: POLARIMETRIC SAR FOR GEOMORPHIC MAPPING APPENDIX 2<br />
APPENDIX 2: Polarization response plots <strong>for</strong> various <strong>geomorphic</strong> targets. Polygons used to derive <strong>the</strong> plots<br />
conta<strong>in</strong>ed no less than 5500 samples and were taken from <strong>in</strong>cident angles rang<strong>in</strong>g from 60-67º.
Hugenholtz and van der Sanden: POLARIMETRIC SAR FOR GEOMORPHIC MAPPING APPENDIX 3<br />
APPENDIX 3: Polarization response plots from van Zyl et al. (1987) show<strong>in</strong>g: (1) a smooth dielectric surface,<br />
(2a) a modelled response from a dihedral corner reflector, (2b) an actual corner reflector, (3a) a modelled rough<br />
surface at 20º <strong>in</strong>cident angle, (3b) rough ocean surface at 20º <strong>in</strong>cident angle, (3c) modelled rough surface at 50º<br />
<strong>in</strong>cident angle, and (3d) rough ocean surface at 50º <strong>in</strong>cident angle.


