InSAR Results from the RADARSAT Antarctic Mapping ... - GeoGratis
InSAR Results from the RADARSAT Antarctic Mapping ... - GeoGratis
InSAR Results from the RADARSAT Antarctic Mapping ... - GeoGratis

You also want an ePaper? Increase the reach of your titles
YUMPU automatically turns print PDFs into web optimized ePapers that Google loves.
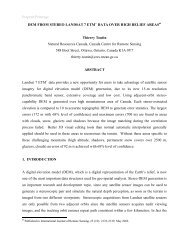
<strong>InSAR</strong> <strong>Results</strong> <strong>from</strong> <strong>the</strong> <strong>RADARSAT</strong> <strong>Antarctic</strong> <strong>Mapping</strong> Mission Data:<br />
Estimation of Glacier Motion using a Simple Registration Procedure<br />
A.L. Gray, K.E. Mattar, and P.W. Vachon,<br />
Canada Centre for Remote Sensing,<br />
588 Booth Street, Ottawa, Canada K1A 0Y7.<br />
Tel: (613) 995-3671, Fax: (613) 947-1383, Email: laurence.gray@geocan.nrcan.gc.ca<br />
R. Bindschadler,<br />
NASA Goddard Space Flight Center, ms 971<br />
Greenbelt, Maryland, USA 20771.<br />
K.C. Jezek and R. Forster,<br />
Byrd Polar Research Center, Ohio-State University,<br />
108 Scott Hall, 1090 Carmack Road,<br />
Colombus, Ohio, USA 43210<br />
J.P. Crawford,<br />
Jet Propulsion Laboratory, 4800 Oak Grove Drive,<br />
Pasadena, California, USA 91109-8099.<br />
ABSTRACT<br />
An interferometric method is used to derive ice<br />
motion <strong>from</strong> <strong>RADARSAT</strong> data collected during<br />
<strong>the</strong> <strong>Antarctic</strong> <strong>Mapping</strong> Mission. Although one<br />
cannot solve for both topography and ice motion<br />
using one interferometric pair, it is possible to<br />
use a coarsely sampled digital terrain model to<br />
estimate ice motion using an image registration<br />
method. Less accurate than <strong>the</strong> usual fringe<br />
counting method for estimation of radial<br />
displacement, <strong>the</strong> image registration method<br />
allows useful motion estimation in both range<br />
and azimuth. The method is described and some<br />
results shown for a large area (~17,000 km 2 )<br />
including ice flow into <strong>the</strong> Filchner Ice Shelf.<br />
INTRODUCTION<br />
During September and early October 1997,<br />
<strong>RADARSAT</strong> was manoeuvred to operate in a<br />
left looking mode and carried out <strong>the</strong> first high<br />
resolution mapping of <strong>the</strong> complete <strong>Antarctic</strong><br />
continent. The <strong>RADARSAT</strong> satellite is in a 24<br />
day repeat orbit and it was suspected that this<br />
time period was too long to expect satisfactory<br />
coherence, especially for coastal outflow glaciers<br />
[1]. However, in interior <strong>Antarctic</strong>a, surface<br />
snow or ice melt is very rare. Therefore, <strong>the</strong>re<br />
was a possibility that backscatter <strong>from</strong> <strong>the</strong> firn<br />
and upper ice layers would not change<br />
sufficiently in <strong>the</strong> 24 days between data<br />
acquisitions to destroy <strong>the</strong> necessary coherence<br />
for interferometric analysis. The data were<br />
collected as part of <strong>the</strong> <strong>Antarctic</strong> <strong>Mapping</strong><br />
Mission (AMM) organized as a result of <strong>the</strong><br />
NASA/CSA agreement whereby NASA<br />
launched <strong>RADARSAT</strong> in exchange for access to<br />
data and <strong>the</strong> opportunity to map <strong>Antarctic</strong>a.<br />
During <strong>the</strong> last 6 days of <strong>the</strong> 30 day mission, <strong>the</strong><br />
coverage of <strong>the</strong> first 6 days was repeated exactly,<br />
<strong>the</strong>reby generating many pairs of images with<br />
which this type of interferometric analysis is<br />
possible. The technique used to measure <strong>the</strong> ice<br />
motion is an image correlation approach and<br />
depends on <strong>the</strong> coherent speckle pattern in <strong>the</strong> 2<br />
images being correlated. The accuracy with<br />
which registration can be achieved is an order of<br />
magnitude better than with <strong>the</strong> incoherent crosscorrelation<br />
approach that depends on image<br />
features, like crevasses, to obtain good results.<br />
METHOD<br />
Raw signal data <strong>from</strong> <strong>the</strong> 2 passes were<br />
processed with a phase preserving SAR<br />
processor, dtSAR, supplied by MDA. The single<br />
look complex data were oversampled by a factor<br />
of 2 in both range and azimuth prior to detection.<br />
To avoid aliasing problems with <strong>the</strong> sin(x)/x<br />
kernel used in <strong>the</strong> oversampling, <strong>the</strong> azimuth<br />
frequency was shifted to be centred on zero<br />
Doppler using <strong>the</strong> Doppler centroid information.<br />
After detection, image chips were crosscorrelated<br />
to obtain <strong>the</strong> offset in both azimuth<br />
and range. The cross-correlation function was<br />
<strong>the</strong>n oversampled by an additional factor of 20 in<br />
both directions. The position of <strong>the</strong> peak in <strong>the</strong><br />
oversampled cross-correlation function was used<br />
to determine <strong>the</strong> pixel shifts and <strong>the</strong> magnitude<br />
was used as a quality factor for poor point<br />
rejection. The pixel shifts in image slant range<br />
(δr) and image azimuth (δa) can be related to <strong>the</strong><br />
24 day ice displacements in <strong>the</strong> ground range<br />
(Dr) and azimuth (Da) directions through <strong>the</strong><br />
relations:<br />
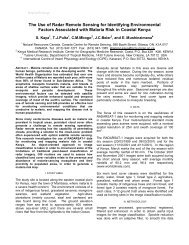
δr = Β cos (χ − α) + Dr sin (θ + Sr) (1)<br />
and δa = Da cos (Sa) (2)<br />
where <strong>the</strong> baseline, angle, and slope parameters<br />
are defined in Fig. 1. For <strong>the</strong> baselines estimated
for <strong>the</strong>se data, typically less than 200 m, <strong>the</strong> error<br />
associated with <strong>the</strong> parallel ray approximation<br />
implicit in (1) is only a few centimetres, small in<br />
comparison with o<strong>the</strong>r errors. Knowledge of <strong>the</strong><br />
baseline is required, as well as a digital terrain<br />
model for calculation of <strong>the</strong> incidence angle,<br />
look angle, and terrain slopes.<br />
Fig. 1<br />
Illustration of <strong>the</strong> displacement geometry for<br />
calculation of <strong>the</strong> ground range displacement (Dr).<br />
B is <strong>the</strong> baseline, χ is <strong>the</strong> baseline angle, α is <strong>the</strong><br />
radar look angle at <strong>the</strong> satellite, Sr and Sa are <strong>the</strong><br />
terrain slopes in range and azimuth respectively (to<br />
<strong>the</strong> local horizontal), θ is <strong>the</strong> local incidence angle,<br />
and δr = δ1 + δ 2.<br />
In practice, it is normally possible to use 1 or 2<br />
points in <strong>the</strong> imagery, which correspond to<br />
exposed rock or mountains, to help calibrate <strong>the</strong><br />
ice displacement information. Radar look and<br />
incidence angles are calculated for points in <strong>the</strong><br />
digital terrain model by using <strong>the</strong> satellite orbit<br />
information and solving for <strong>the</strong> zero Doppler<br />
range between <strong>the</strong> point on <strong>the</strong> earth’s surface<br />
and <strong>the</strong> satellite track. The orbit data are used to<br />
get an initial estimate of <strong>the</strong> baseline B and <strong>the</strong><br />
baseline angle χ. The baseline information is<br />
refined using <strong>the</strong> zero velocity points.<br />
A complete error analysis is beyond <strong>the</strong> scope of<br />
this paper but <strong>the</strong> following points can be made.<br />
The pixel registration in areas of good coherence<br />
can be done to better than 1/10 of a pixel, <strong>the</strong><br />
‘unit’ of pixel shift in this work is 1/40 of <strong>the</strong><br />
0-7803-4403-0/98/$10.00 (c) 1998 IEEE<br />
pixel spacing. Small bias errors in velocity may<br />
exist when using an area that is assumed to be<br />
stationary. These errors can increase with both<br />
baseline and <strong>the</strong> look angle difference between<br />
<strong>the</strong> reference area and <strong>the</strong> area for which <strong>the</strong><br />
velocity estimate is being made. It is anticipated<br />
that errors in velocity will be in <strong>the</strong> range of 10<br />
cm/day in range and around 3 cm/day in<br />
azimuth. With poor digital elevation data, or<br />
poor baseline information, <strong>the</strong>se errors will<br />
increase. Absence of a ‘zero velocity’ reference<br />
area will make <strong>the</strong> technique more difficult, and<br />
<strong>the</strong> results more uncertain, however it is<br />
anticipated that velocity gradients will still be<br />
measurable.<br />
RESULTS<br />
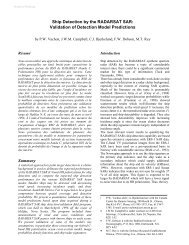
Figure 2 illustrates <strong>the</strong> ice movement derived<br />
<strong>from</strong> two merged pairs of <strong>RADARSAT</strong> standard<br />
mode 2 images (100 km x 170 km) acquired on<br />
September 24 and October 18, 1997. The vectors<br />
represent <strong>the</strong> ice motion of <strong>the</strong> Slessor Glacier as<br />
it flows into <strong>the</strong> Filchner Ice Shelf in Western<br />
<strong>Antarctic</strong>a. The vector direction corresponds<br />
well with <strong>the</strong> flow lines in <strong>the</strong> glacier and, as <strong>the</strong><br />
range and azimuth displacement estimates are<br />
independent, <strong>the</strong> agreement between <strong>the</strong> derived<br />
directions and <strong>the</strong> ice stream flow lines helps<br />
validate <strong>the</strong> derived velocities. The acceleration<br />
in <strong>the</strong> ice stream as it enters <strong>the</strong> floating ice shelf<br />
is apparent. Velocities in <strong>the</strong> more sou<strong>the</strong>rly<br />
(upper) part of <strong>the</strong> glacier change <strong>from</strong> around<br />
250 m/year as <strong>the</strong> ice enters <strong>the</strong> area covered by<br />
<strong>the</strong> image to almost 800 m/year as it leaves at <strong>the</strong><br />
bottom right-hand corner.<br />
CONCLUSIONS<br />
In 24 days time ice displacement can be large<br />
enough that a simple image registration<br />
technique can lead to useful results for ice<br />
motion. The advantages are:<br />
• Displacements in both range and azimuth<br />
can be measured.<br />
• Phase analysis is not essential, so that errors<br />
due to phase aliasing or incorrect phase<br />
unwrapping are avoided.<br />
• Local errors do not propagate through <strong>the</strong><br />
image as <strong>the</strong>y can with phase analysis.<br />
• In some cases, use of <strong>the</strong> phase information<br />
could be used to improve <strong>the</strong> range velocity<br />
or velocity gradient estimation.<br />
• The accuracy requirements for orbit and<br />
terrain topographic data are not as stringent<br />
as for conventional interferometric analysis<br />
for terrain motion.
ACKNOWLEDGMENTS<br />
Dirk Geudtner (DLR) provided help and<br />
software for our early work on <strong>RADARSAT</strong><br />
interferometry. The Canadian Space Agency,<br />
CSA, and <strong>RADARSAT</strong> International, RSI, also<br />
helped in making data available to CCRS in<br />
order to do an initial evaluation of <strong>the</strong> potential<br />
of interferometry.<br />
REFERENCE<br />
1. Goldstein, R.M., H. Englehardt, B. Lamb,<br />
and R.M. Frolich, Satellite radar<br />
interferometry for monitoring ice sheet<br />
motion: Application to an <strong>Antarctic</strong> ice<br />
stream, Science, 262, 1525-1530, 1993.<br />
Figure 2<br />
Illustration of ice motion <strong>from</strong> <strong>the</strong> Slessor Glacier (upper left) as <strong>the</strong> ice enters <strong>the</strong> Filchner Ice Shelf and<br />
flows as an ice stream northward towards <strong>the</strong> shelf edge. Two mosaicked pairs of <strong>RADARSAT</strong> standard<br />
mode 2 images were used to create this image (100 km x 170 km) of ice motion. Velocities in <strong>the</strong> more<br />
sou<strong>the</strong>rly (upper) part of <strong>the</strong> glacier change <strong>from</strong> around 250 m/year as <strong>the</strong> ice enters <strong>the</strong> area covered by<br />
<strong>the</strong> image to almost 800 m/year as it leaves at <strong>the</strong> bottom right-hand corner.<br />
0-7803-4403-0/98/$10.00 (c) 1998 IEEE