InSAR Results from the RADARSAT Antarctic Mapping ... - GeoGratis
InSAR Results from the RADARSAT Antarctic Mapping ... - GeoGratis
InSAR Results from the RADARSAT Antarctic Mapping ... - GeoGratis

You also want an ePaper? Increase the reach of your titles
YUMPU automatically turns print PDFs into web optimized ePapers that Google loves.
for <strong>the</strong>se data, typically less than 200 m, <strong>the</strong> error<br />
associated with <strong>the</strong> parallel ray approximation<br />
implicit in (1) is only a few centimetres, small in<br />
comparison with o<strong>the</strong>r errors. Knowledge of <strong>the</strong><br />
baseline is required, as well as a digital terrain<br />
model for calculation of <strong>the</strong> incidence angle,<br />
look angle, and terrain slopes.<br />
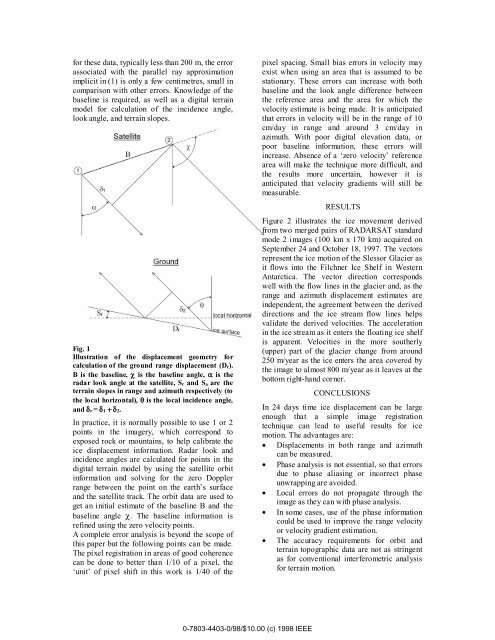
Fig. 1<br />
Illustration of <strong>the</strong> displacement geometry for<br />
calculation of <strong>the</strong> ground range displacement (Dr).<br />
B is <strong>the</strong> baseline, χ is <strong>the</strong> baseline angle, α is <strong>the</strong><br />
radar look angle at <strong>the</strong> satellite, Sr and Sa are <strong>the</strong><br />
terrain slopes in range and azimuth respectively (to<br />
<strong>the</strong> local horizontal), θ is <strong>the</strong> local incidence angle,<br />
and δr = δ1 + δ 2.<br />
In practice, it is normally possible to use 1 or 2<br />
points in <strong>the</strong> imagery, which correspond to<br />
exposed rock or mountains, to help calibrate <strong>the</strong><br />
ice displacement information. Radar look and<br />
incidence angles are calculated for points in <strong>the</strong><br />
digital terrain model by using <strong>the</strong> satellite orbit<br />
information and solving for <strong>the</strong> zero Doppler<br />
range between <strong>the</strong> point on <strong>the</strong> earth’s surface<br />
and <strong>the</strong> satellite track. The orbit data are used to<br />
get an initial estimate of <strong>the</strong> baseline B and <strong>the</strong><br />
baseline angle χ. The baseline information is<br />
refined using <strong>the</strong> zero velocity points.<br />
A complete error analysis is beyond <strong>the</strong> scope of<br />
this paper but <strong>the</strong> following points can be made.<br />
The pixel registration in areas of good coherence<br />
can be done to better than 1/10 of a pixel, <strong>the</strong><br />
‘unit’ of pixel shift in this work is 1/40 of <strong>the</strong><br />
0-7803-4403-0/98/$10.00 (c) 1998 IEEE<br />
pixel spacing. Small bias errors in velocity may<br />
exist when using an area that is assumed to be<br />
stationary. These errors can increase with both<br />
baseline and <strong>the</strong> look angle difference between<br />
<strong>the</strong> reference area and <strong>the</strong> area for which <strong>the</strong><br />
velocity estimate is being made. It is anticipated<br />
that errors in velocity will be in <strong>the</strong> range of 10<br />
cm/day in range and around 3 cm/day in<br />
azimuth. With poor digital elevation data, or<br />
poor baseline information, <strong>the</strong>se errors will<br />
increase. Absence of a ‘zero velocity’ reference<br />
area will make <strong>the</strong> technique more difficult, and<br />
<strong>the</strong> results more uncertain, however it is<br />
anticipated that velocity gradients will still be<br />
measurable.<br />
RESULTS<br />
Figure 2 illustrates <strong>the</strong> ice movement derived<br />
<strong>from</strong> two merged pairs of <strong>RADARSAT</strong> standard<br />
mode 2 images (100 km x 170 km) acquired on<br />
September 24 and October 18, 1997. The vectors<br />
represent <strong>the</strong> ice motion of <strong>the</strong> Slessor Glacier as<br />
it flows into <strong>the</strong> Filchner Ice Shelf in Western<br />
<strong>Antarctic</strong>a. The vector direction corresponds<br />
well with <strong>the</strong> flow lines in <strong>the</strong> glacier and, as <strong>the</strong><br />
range and azimuth displacement estimates are<br />
independent, <strong>the</strong> agreement between <strong>the</strong> derived<br />
directions and <strong>the</strong> ice stream flow lines helps<br />
validate <strong>the</strong> derived velocities. The acceleration<br />
in <strong>the</strong> ice stream as it enters <strong>the</strong> floating ice shelf<br />
is apparent. Velocities in <strong>the</strong> more sou<strong>the</strong>rly<br />
(upper) part of <strong>the</strong> glacier change <strong>from</strong> around<br />
250 m/year as <strong>the</strong> ice enters <strong>the</strong> area covered by<br />
<strong>the</strong> image to almost 800 m/year as it leaves at <strong>the</strong><br />
bottom right-hand corner.<br />
CONCLUSIONS<br />
In 24 days time ice displacement can be large<br />
enough that a simple image registration<br />
technique can lead to useful results for ice<br />
motion. The advantages are:<br />
• Displacements in both range and azimuth<br />
can be measured.<br />
• Phase analysis is not essential, so that errors<br />
due to phase aliasing or incorrect phase<br />
unwrapping are avoided.<br />
• Local errors do not propagate through <strong>the</strong><br />
image as <strong>the</strong>y can with phase analysis.<br />
• In some cases, use of <strong>the</strong> phase information<br />
could be used to improve <strong>the</strong> range velocity<br />
or velocity gradient estimation.<br />
• The accuracy requirements for orbit and<br />
terrain topographic data are not as stringent<br />
as for conventional interferometric analysis<br />
for terrain motion.