BOILER OPERATION EFFICIENCY Insights and Tips - Lattner Boiler ...
BOILER OPERATION EFFICIENCY Insights and Tips - Lattner Boiler ...
BOILER OPERATION EFFICIENCY Insights and Tips - Lattner Boiler ...

You also want an ePaper? Increase the reach of your titles
YUMPU automatically turns print PDFs into web optimized ePapers that Google loves.
<strong>BOILER</strong> <strong>OPERATION</strong><br />
<strong>EFFICIENCY</strong><br />
<strong>Insights</strong> <strong>and</strong> <strong>Tips</strong><br />
Debunking five common myths about boiler-system<br />
<strong>Boiler</strong> systems have been operated for<br />
decades with an eye to efficient <strong>and</strong> safe<br />
operation. This article is intended<br />
as a review of some of the basic<br />
operating principles that most operators<br />
<strong>and</strong> engineers already know, but<br />
may tend to forget over the years. The<br />
basic information presented in this article has been<br />
gathered over a couple of years of testing boiler-operating<br />
efficiency at ap-<br />
proximately thirty industrial<br />
plants with multiple<br />
boilers each. The data illustrated<br />
in the various<br />
curves shown are actual<br />
operating boilers at these<br />
various locations across<br />
the United States.<br />
MYTH NO. 1: A <strong>BOILER</strong><br />
OPERATES MOST EFFI-<br />
CIENTLY AT FULL LOAD.<br />
This is not necessarily<br />
the case as shown in the<br />
following case study for a<br />
boiler tested equipped<br />
with a feedwater economizer<br />
(similar results for<br />
an air heater).<br />
Figure 1 <strong>and</strong> its accom-<br />
Combustion efficiency, percent<br />
84.5<br />
84.0<br />
83.5<br />
83.0<br />
82.5<br />
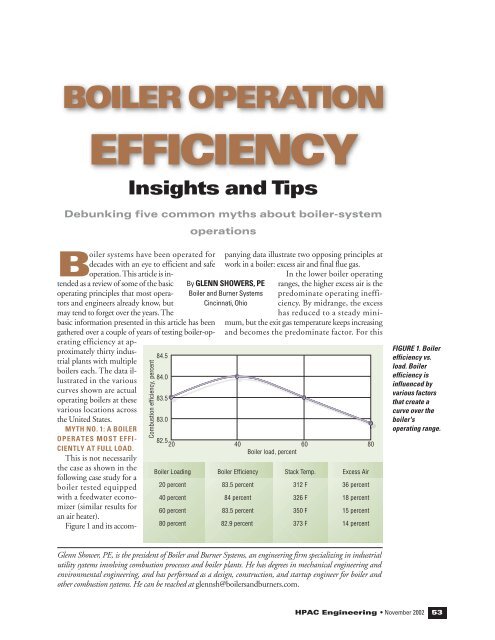
panying data illustrate two opposing principles at<br />
work in a boiler: excess air <strong>and</strong> final flue gas.<br />
In the lower boiler operating<br />
ranges, the higher excess air is the<br />
predominate operating inefficiency.<br />
By midrange, the excess<br />
has reduced to a steady minimum,<br />
but the exit gas temperature keeps increasing<br />
<strong>and</strong> becomes the predominate factor. For this<br />
20 40 60 80<br />
<strong>Boiler</strong> load, percent<br />
<strong>Boiler</strong> Loading<br />
20 percent<br />
40 percent<br />
60 percent<br />
80 percent<br />
operations<br />
By GLENN SHOWERS, PE<br />
<strong>Boiler</strong> <strong>and</strong> Burner Systems<br />
Cincinnati, Ohio<br />
<strong>Boiler</strong> Efficiency<br />
83.5 percent<br />
84 percent<br />
83.5 percent<br />
82.9 percent<br />
Stack Temp.<br />
312 F<br />
326 F<br />
350 F<br />
373 F<br />
Excess Air<br />
36 percent<br />
18 percent<br />
15 percent<br />
14 percent<br />
Glenn Shower, PE, is the president of <strong>Boiler</strong> <strong>and</strong> Burner Systems, an engineering firm specializing in industrial<br />
utility systems involving combustion processes <strong>and</strong> boiler plants. He has degrees in mechanical engineering <strong>and</strong><br />
environmental engineering, <strong>and</strong> has performed as a design, construction, <strong>and</strong> startup engineer for boiler <strong>and</strong><br />
other combustion systems. He can be reached at glennsh@boilers<strong>and</strong>burners.com.<br />
FIGURE 1. <strong>Boiler</strong><br />
efficiency vs.<br />
load. <strong>Boiler</strong><br />
efficiency is<br />
influenced by<br />
various factors<br />
that create a<br />
curve over the<br />
boiler's<br />
operating range.<br />
HPAC Engineering • November 2002<br />
53
Efficiency, percent<br />
87<br />
86<br />
85<br />
84<br />
83<br />
82<br />
81<br />
<strong>Boiler</strong> efficiency, percent<br />
20 40 60 80<br />
<strong>Boiler</strong> load, percent<br />
<strong>Boiler</strong> Loading<br />
20 percent<br />
40 percent<br />
60 percent<br />
80 percent<br />
<strong>Boiler</strong> Efficiency<br />
81.4 percent<br />
85.4 percent<br />
84.9 percent<br />
84.1 percent<br />
54 November 2002 • HPAC Engineering<br />
Combustion efficiency<br />
<strong>Boiler</strong> efficiency<br />
Combustion Efficiency<br />
83.8 percent<br />
86.6 percent<br />
85.7 percent<br />
84.7 percent<br />
84<br />
83<br />
82<br />
81<br />
80<br />
Group<br />
79<br />
78<br />
77<br />
76<br />
Individual<br />
75<br />
20 40 60 80<br />
<strong>Boiler</strong> load, percent<br />
<strong>Boiler</strong> Loading<br />
20 percent<br />
40 percent<br />
60 percent<br />
80 percent<br />
B O I L E R E F F I C I E N C Y M Y T H S<br />
FIGURE 2. Radiation loss effects on efficiency. A boiler constantly radiates heat but the<br />
effect on efficiency varies with boiler load.<br />
Burners operating as one<br />
146 percent excess air<br />
82 percent excess air<br />
49 percent excess air<br />
15 percent excess air<br />
Burners operating individually<br />
70 percent excess air<br />
50 percent excess air<br />
15 percent excess air<br />
15 percent excess air<br />
FIGURE 3. Multiple burner operation effect on efficiency. How burners on a mutli-burner<br />
boiler are operated has a strong impact on efficiency.<br />
boiler, the mid-fire range is the most efficient<br />
operation.<br />
Myth No. 2: Radiation losses are so<br />
minor they can be ignored.<br />
As with the full-load assumption, it’s<br />
also a myth that one can ignore “minor”<br />
radiation losses. The radiation losses seen<br />
in figure 2 are estimated based on a curve<br />
prepared by the American <strong>Boiler</strong> Manufacturers’<br />
Association. These ABMA<br />
curves factor boiler size, partial load, <strong>and</strong><br />
whether or not the walls are water- or aircooled<br />
into the estimate of the radiation<br />
loss for any given boiler.<br />
The basic principle in action here is<br />
that the furnace is virtually operating at<br />
the same temperature regardless of boiler<br />
load, therefore the heat loss through the<br />
walls to the ambient surroundings are almost<br />
constant over the load range.<br />
Therefore, at the lower boiler firing rates,<br />
the heat lost to the surroundings will calculate<br />
to a higher percentage of the heat<br />
input to the boiler. Take, for example, a<br />
boiler that has been “banked,” operating<br />
just enough to keep it warm but not producing<br />
steam. This boiler has an efficiency<br />
of 0 percent <strong>and</strong> is giving up all its<br />
heat as radiation losses to the space surrounding<br />
the boiler.<br />
Myth No. 3: For a multiple-burner<br />
boiler, adding one burner at a time is<br />
the preferred method.<br />
While this may be the preferred<br />
method, as with myth No. 1, this is not<br />
the most efficient way to operate, as<br />
shown in figure 3 for a boiler tested that<br />
was equipped with three burners. The<br />
simple principle at work in this boiler is<br />
excess air, <strong>and</strong> the more there is, the lower<br />
the efficiency, as can be seen from the<br />
curve data for Figure 3.<br />
For this test, airflow was reduced to its<br />
lowest possible level as indicated by a<br />
sudden build-up of carbon monoxide.<br />
Excess air had to be run higher when the<br />
burners were operated individually to<br />
avoid the formation of undesired carbon<br />
monoxide. In the lower boiler operating<br />
ranges using the burners individually,<br />
combustion air short-circuited around<br />
the operational burner by going through<br />
the out-of-service burner. Not until all
urners are operating does the flame actually<br />
use all the air supplied for combustion.<br />
Therefore, to achieve the best possible<br />
operating efficiency for this boiler, the<br />
burners should be operated as a single<br />
unit <strong>and</strong> not operated as individual burners.<br />
Another option is for the dampers on<br />
each burner to be tight shut-off to eliminate<br />
the bypassing of combustion air, but<br />
this is not always a practical solution.<br />
Myth No. 4: Similar air <strong>and</strong> temperature<br />
conditions mean similar efficiency,<br />
regardless of fuel.<br />
Again, as with myths 1 <strong>and</strong> 2, this is<br />
not necessarily the case, as shown in Figure<br />
4, which includes data for two identical<br />
boilers, both equipped with air preheaters,<br />
one burning light oil <strong>and</strong> the<br />
other natural gas. The operating principles<br />
at work in these boilers involve the<br />
way each fuel burns.<br />
The combustion of the hydrogen<br />
component of any fuel forms water vapor,<br />
which, when heated to the exhaust<br />
gas exit temperature, is a major inefficiency<br />
factor. Natural gas contains a high<br />
amount of hydrogen (four hydrogen to<br />
one carbon) as compared to fuel oil (one<br />
hydrogen to six carbon); therefore, natural<br />
gas has much higher water vapor inefficiency.<br />
For this boiler, whenever fuel oil <strong>and</strong><br />
natural gas are at the same cost<br />
($/MMBtu), the boiler should be operated<br />
on fuel oil because it is about 4 percent<br />
more efficient burning oil than gas.<br />
Myth No.5. <strong>Boiler</strong> selection does not<br />
affect the plant’s overall efficiency.<br />
Like the first four, this is totally untrue.<br />
The curves in figures 5a <strong>and</strong> 5b are intended<br />
to demonstrate that a plant’s overall<br />
operating efficiency is based, in large<br />
part, on the selection of the boiler to place<br />
in operation. In this example, the plant<br />
has three boilers at different sizes <strong>and</strong> efficiencies,<br />
which is summarized in the<br />
curve table for figures 5a <strong>and</strong> b on page<br />
56. As one can see, selecting the most efficient<br />
combination of boilers <strong>and</strong> operating<br />
each one at or near its most efficient<br />
point will present the best overall operating<br />
efficiency.<br />
B O I L E R E F F I C I E N C Y M Y T H S<br />
<strong>Boiler</strong> efficiency, percent<br />
90<br />
89<br />
88<br />
87<br />
86<br />
85<br />
84<br />
83<br />
82<br />
81<br />
80<br />
<strong>Boiler</strong> on oil<br />
<strong>Boiler</strong> on gas<br />
20 40 60 80<br />
<strong>Boiler</strong> load, percent<br />
<strong>Boiler</strong> Loading<br />
20 percent<br />
40 percent<br />
60 percent<br />
80 percent<br />
Plant efficiency, percent<br />
86<br />
85<br />
84<br />
83<br />
82<br />
81<br />
80<br />
Burners on natural gas<br />
80% excess air, 225 F exit temp<br />
60% excess air, 245 F exit temp<br />
55% excess air, 270 F exit temp<br />
60% excess air, 310 F exit temp<br />
Burners individually<br />
125% excess air, 220 F exit temp<br />
65% excess air, 260 F exit temp<br />
65% excess air, 295 F exit temp<br />
70% excess air, 305 F exit temp<br />
FIGURE 4. Fuel selection effect on efficiency. Natural gas <strong>and</strong> fuel oil have different<br />
effects on efficiency.<br />
100<br />
80<br />
60<br />
40<br />
20<br />
<strong>Boiler</strong> steam load, 1,000 pounds per hour 120<br />
10 20 30 40 50 60 70 80 90 100 110 120 130<br />
Total plant steam dem<strong>and</strong>, 1,000 pounds per hr<br />
<strong>Boiler</strong> 3<br />
<strong>Boiler</strong> 2<br />
<strong>Boiler</strong> 1<br />
0<br />
10 20 30 40 50 60 70 80 90 100 110 120 130 140 150 160 170 180 190<br />
Total plant steam dem<strong>and</strong>, 1,000 pounds per hr<br />
FIGURE 5a <strong>and</strong> b. <strong>Boiler</strong> selection vs. overall efficiency. The boiler plant's overall<br />
efficiency is composed of the individual boiler efficiencies, so boiler selection greatly<br />
influences overall plant efficiency. See page 56 for sizes <strong>and</strong> efficiencies of these boilers.<br />
HPAC Engineering • November 2002<br />
55
B O I L E R E F F I C I E N C Y M Y T H S<br />
<strong>Boiler</strong> loading (lb/hr)<br />
10<br />
20<br />
30<br />
40<br />
50<br />
60<br />
70<br />
80<br />
90<br />
100<br />
<strong>Boiler</strong> No. 1<br />
83.9<br />
84.2<br />
84.4<br />
84.5<br />
84.65<br />
84.7<br />
56 November 2002 • HPAC Engineering<br />
<strong>Boiler</strong> No.2<br />
85.4<br />
84.95<br />
84.1<br />
<strong>Boiler</strong> No. 3<br />
83.8<br />
84.3<br />
84.6<br />
84.81<br />
84.7<br />
84.25<br />
83.3<br />
82.6<br />
81.6<br />
80.8<br />
FIGURE 5a. illustrates a plant’s overall efficiency <strong>and</strong> 5b shows multiple boiler load<br />
management. This table shows sizes <strong>and</strong> percent load efficiencies of the boilers in<br />
Figures 5a <strong>and</strong> b.<br />
C O N T R O L F R E A K S<br />
Continued from Page 11<br />
Typically, when one evaluates the<br />
capability of the “supervisory” network<br />
interface device, the primary concern<br />
is how many nodes the device can<br />
manage. In addition to this, the engineer<br />
<strong>and</strong> installing contractor need<br />
to be cognizant of any limitation on<br />
data traffic. This includes the transfer<br />
of physical hardware point information,<br />
software calculations, alarming,<br />
trending, <strong>and</strong>, potentially, the data<br />
transfer of additional parameter<br />
details. Not all controllers have the<br />
memory capacity required to h<strong>and</strong>le<br />
the input/output (I/O) data transfer<br />
of these additional parameters. Some<br />
controllers have the memory to h<strong>and</strong>le<br />
250 pieces of I/O, while others are<br />
limited to 50. If a given controller has<br />
16 points, <strong>and</strong> you require access to an<br />
additional six, this won’t be a problem.<br />
If you require the ability to put each<br />
point into a test mode, to override each<br />
point, <strong>and</strong> input an offset to some<br />
of the analog inputs for calibration<br />
purposes, you will quickly exceed these<br />
memory limitations. Engineers need<br />
to research these details or performance-specify<br />
the criteria that dictate<br />
acceptable performance.<br />
Again, with DDC systems, there<br />
are additional details that need<br />
researching <strong>and</strong> specification as part<br />
of the engineering process. These<br />
additional details increase as we<br />
mix products from different suppliers.<br />
Unfortunately, some of these particulars<br />
are not readily apparent. This is<br />
not to say we shouldn’t mix systems,<br />
but rather we need to do a little<br />
more homework as we apply new<br />
approaches in this quickly changing<br />
field. It is much better to find out<br />
system limitations before we build the<br />
system.<br />
Send comments <strong>and</strong> questions to<br />
controlfreaks@penton.com. For<br />
previous Control Freaks columns, visit<br />
www.hpac.com.