Minnesota Juvenile Justice Advisory Committee - Minnesota State ...
Minnesota Juvenile Justice Advisory Committee - Minnesota State ...
Minnesota Juvenile Justice Advisory Committee - Minnesota State ...
You also want an ePaper? Increase the reach of your titles
YUMPU automatically turns print PDFs into web optimized ePapers that Google loves.
2 0 1 0 M I N N E S O T A J J A C A N N U A L R E P O R T 22<br />
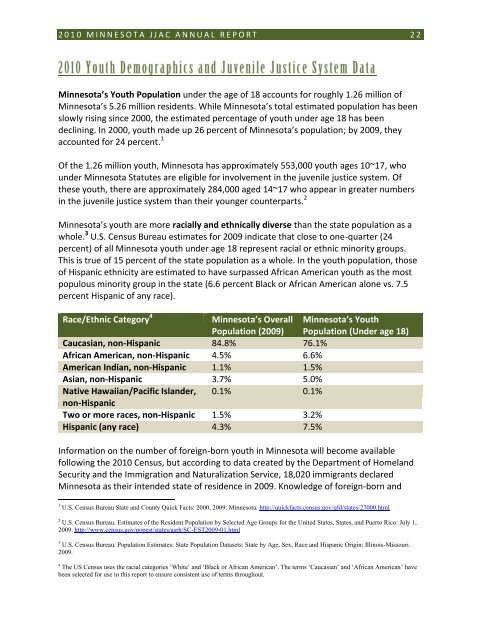
<strong>Minnesota</strong>’s Youth Population under the age of 18 accounts for roughly 1.26 million of<br />
<strong>Minnesota</strong>’s 5.26 million residents. While <strong>Minnesota</strong>’s total estimated population has been<br />
slowly rising since 2000, the estimated percentage of youth under age 18 has been<br />
declining. In 2000, youth made up 26 percent of <strong>Minnesota</strong>’s population; by 2009, they<br />
accounted for 24 percent. 1<br />
Of the 1.26 million youth, <strong>Minnesota</strong> has approximately 553,000 youth ages 10~17, who<br />
under <strong>Minnesota</strong> Statutes are eligible for involvement in the juvenile justice system. Of<br />
these youth, there are approximately 284,000 aged 14~17 who appear in greater numbers<br />
in the juvenile justice system than their younger counterparts. 2<br />
<strong>Minnesota</strong>’s youth are more racially and ethnically diverse than the state population as a<br />
whole. 3 U.S. Census Bureau estimates for 2009 indicate that close to one-quarter (24<br />
percent) of all <strong>Minnesota</strong> youth under age 18 represent racial or ethnic minority groups.<br />
This is true of 15 percent of the state population as a whole. In the youth population, those<br />
of Hispanic ethnicity are estimated to have surpassed African American youth as the most<br />
populous minority group in the state (6.6 percent Black or African American alone vs. 7.5<br />
percent Hispanic of any race).<br />
Race/Ethnic Category 4 <strong>Minnesota</strong>’s Overall <strong>Minnesota</strong>’s Youth<br />
Population (2009) Population (Under age 18)<br />
Caucasian, non-Hispanic 84.8% 76.1%<br />
African American, non-Hispanic 4.5% 6.6%<br />
American Indian, non-Hispanic 1.1% 1.5%<br />
Asian, non-Hispanic 3.7% 5.0%<br />
Native Hawaiian/Pacific Islander, 0.1% 0.1%<br />
non-Hispanic<br />
Two or more races, non-Hispanic 1.5% 3.2%<br />
Hispanic (any race) 4.3% 7.5%<br />
Information on the number of foreign-born youth in <strong>Minnesota</strong> will become available<br />
following the 2010 Census, but according to data created by the Department of Homeland<br />
Security and the Immigration and Naturalization Service, 18,020 immigrants declared<br />
<strong>Minnesota</strong> as their intended state of residence in 2009. Knowledge of foreign-born and<br />
1 U.S. Census Bureau <strong>State</strong> and County Quick Facts: 2000, 2009: <strong>Minnesota</strong>. http://quickfacts.census.gov/qfd/states/27000.html<br />
2 U.S. Census Bureau. Estimates of the Resident Population by Selected Age Groups for the United <strong>State</strong>s, <strong>State</strong>s, and Puerto Rico: July 1,<br />
2009. http://www.census.gov/popest/states/asrh/SC-EST2009-01.html<br />
3 U.S. Census Bureau. Population Estimates: <strong>State</strong> Population Datasets: <strong>State</strong> by Age, Sex, Race and Hispanic Origin: Illinois-Missouri.<br />
2009.<br />
4 The US Census uses the racial categories „White‟ and „Black or African American‟. The terms „Caucasian‟ and „African American‟ have<br />
been selected for use in this report to ensure consistent use of terms throughout.


