Risk Assessment Methodologies of Soil Threats in Europe
Risk Assessment Methodologies of Soil Threats in Europe
Risk Assessment Methodologies of Soil Threats in Europe

Create successful ePaper yourself
Turn your PDF publications into a flip-book with our unique Google optimized e-Paper software.
Quantitative<br />
historical<br />
documents<br />
8%<br />
Quantitative expert<br />
analysis<br />
23%<br />
Quantitative<br />
process basedmodel<br />
23%<br />
33<br />
Other<br />
0%<br />
Qualitative expertbased<br />
23%<br />
Qualitative<br />
weight<strong>in</strong>g-rat<strong>in</strong>g<br />
8%<br />
Quantitative<br />
empirical model<br />
15%<br />
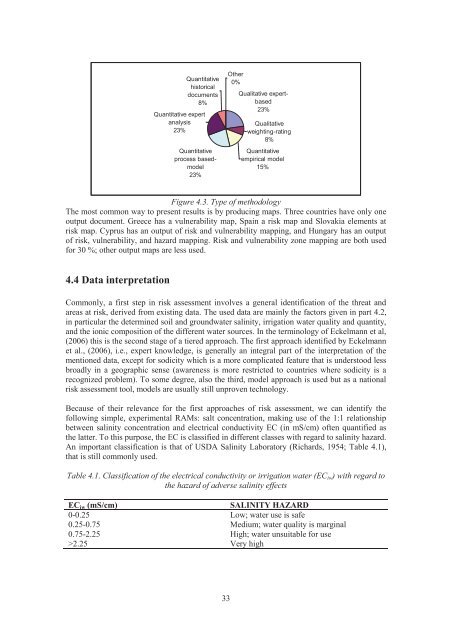
Figure 4.3. Type <strong>of</strong> methodology<br />
The most common way to present results is by produc<strong>in</strong>g maps. Three countries have only one<br />
output document. Greece has a vulnerability map, Spa<strong>in</strong> a risk map and Slovakia elements at<br />
risk map. Cyprus has an output <strong>of</strong> risk and vulnerability mapp<strong>in</strong>g, and Hungary has an output<br />
<strong>of</strong> risk, vulnerability, and hazard mapp<strong>in</strong>g. <strong>Risk</strong> and vulnerability zone mapp<strong>in</strong>g are both used<br />
for 30 %; other output maps are less used.<br />
4.4 Data <strong>in</strong>terpretation<br />
Commonly, a first step <strong>in</strong> risk assessment <strong>in</strong>volves a general identification <strong>of</strong> the threat and<br />
areas at risk, derived from exist<strong>in</strong>g data. The used data are ma<strong>in</strong>ly the factors given <strong>in</strong> part 4.2,<br />
<strong>in</strong> particular the determ<strong>in</strong>ed soil and groundwater sal<strong>in</strong>ity, irrigation water quality and quantity,<br />
and the ionic composition <strong>of</strong> the different water sources. In the term<strong>in</strong>ology <strong>of</strong> Eckelmann et al,<br />
(2006) this is the second stage <strong>of</strong> a tiered approach. The first approach identified by Eckelmann<br />
et al., (2006), i.e., expert knowledge, is generally an <strong>in</strong>tegral part <strong>of</strong> the <strong>in</strong>terpretation <strong>of</strong> the<br />
mentioned data, except for sodicity which is a more complicated feature that is understood less<br />
broadly <strong>in</strong> a geographic sense (awareness is more restricted to countries where sodicity is a<br />
recognized problem). To some degree, also the third, model approach is used but as a national<br />
risk assessment tool, models are usually still unproven technology.<br />
Because <strong>of</strong> their relevance for the first approaches <strong>of</strong> risk assessment, we can identify the<br />
follow<strong>in</strong>g simple, experimental RAMs: salt concentration, mak<strong>in</strong>g use <strong>of</strong> the 1:1 relationship<br />
between sal<strong>in</strong>ity concentration and electrical conductivity EC (<strong>in</strong> mS/cm) <strong>of</strong>ten quantified as<br />
the latter. To this purpose, the EC is classified <strong>in</strong> different classes with regard to sal<strong>in</strong>ity hazard.<br />
An important classification is that <strong>of</strong> USDA Sal<strong>in</strong>ity Laboratory (Richards, 1954; Table 4.1),<br />
that is still commonly used.<br />
Table 4.1. Classification <strong>of</strong> the electrical conductivity or irrigation water (ECiw) with regard to<br />
the hazard <strong>of</strong> adverse sal<strong>in</strong>ity effects<br />
ECiw (mS/cm) SALINITY HAZARD<br />
0-0.25 Low; water use is safe<br />
0.25-0.75 Medium; water quality is marg<strong>in</strong>al<br />
0.75-2.25 High; water unsuitable for use<br />
>2.25 Very high