Comparative movement of labelled nitrogen and zinc in 1 ... - INTA
Comparative movement of labelled nitrogen and zinc in 1 ... - INTA
Comparative movement of labelled nitrogen and zinc in 1 ... - INTA

You also want an ePaper? Increase the reach of your titles
YUMPU automatically turns print PDFs into web optimized ePapers that Google loves.
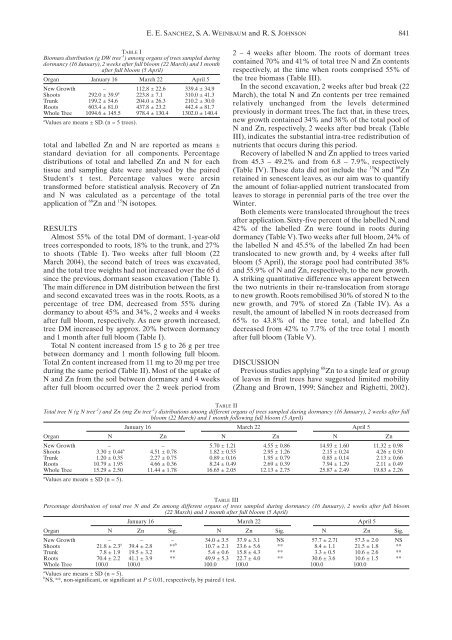
TABLE I<br />
Biomass distribution (g DW tree –1 ) among organs <strong>of</strong> trees sampled dur<strong>in</strong>g<br />
dormancy (16 January), 2 weeks after full bloom (22 March) <strong>and</strong> 1 month<br />
after full bloom (5 April)<br />
Organ January 16 March 22 April 5<br />
New Growth – 112.8 ± 22.6 339.4 ± 34.9<br />
Shoots 292.0 ± 39.9 a<br />
total <strong>and</strong> <strong>labelled</strong> Zn <strong>and</strong> N are reported as means ±<br />
st<strong>and</strong>ard deviation for all components. Percentage<br />
distributions <strong>of</strong> total <strong>and</strong> <strong>labelled</strong> Zn <strong>and</strong> N for each<br />
tissue <strong>and</strong> sampl<strong>in</strong>g date were analysed by the paired<br />
Student’s t test. Percentage values were arcs<strong>in</strong><br />
transformed before statistical analysis. Recovery <strong>of</strong> Zn<br />
<strong>and</strong> N was calculated as a percentage <strong>of</strong> the total<br />
application <strong>of</strong> 68 Zn <strong>and</strong> 15 N isotopes.<br />
RESULTS<br />
Almost 55% <strong>of</strong> the total DM <strong>of</strong> dormant, 1-year-old<br />
trees corresponded to roots, 18% to the trunk, <strong>and</strong> 27%<br />
to shoots (Table I). Two weeks after full bloom (22<br />
March 2004), the second batch <strong>of</strong> trees was excavated,<br />
<strong>and</strong> the total tree weights had not <strong>in</strong>creased over the 65 d<br />
s<strong>in</strong>ce the previous, dormant season excavation (Table I).<br />
The ma<strong>in</strong> difference <strong>in</strong> DM distribution between the first<br />
<strong>and</strong> second excavated trees was <strong>in</strong> the roots. Roots, as a<br />
percentage <strong>of</strong> tree DM, decreased from 55% dur<strong>in</strong>g<br />
dormancy to about 45% <strong>and</strong> 34%, 2 weeks <strong>and</strong> 4 weeks<br />
after full bloom, respectively. As new growth <strong>in</strong>creased,<br />
tree DM <strong>in</strong>creased by approx. 20% between dormancy<br />
<strong>and</strong> 1 month after full bloom (Table I).<br />
Total N content <strong>in</strong>creased from 15 g to 26 g per tree<br />
between dormancy <strong>and</strong> 1 month follow<strong>in</strong>g full bloom.<br />
Total Zn content <strong>in</strong>creased from 11 mg to 20 mg per tree<br />
dur<strong>in</strong>g the same period (Table II). Most <strong>of</strong> the uptake <strong>of</strong><br />
N <strong>and</strong> Zn from the soil between dormancy <strong>and</strong> 4 weeks<br />
after full bloom occurred over the 2 week period from<br />
E. E. SANCHEZ,S.A.WEINBAUM <strong>and</strong> R. S. JOHNSON<br />
223.8 ± 7.1 310.0 ± 41.3<br />
Trunk 199.2 ± 54.6 204.0 ± 26.3 210.2 ± 30.0<br />
Roots 603.4 ± 81.0 437.8 ± 23.2 442.4 ± 81.7<br />
Whole Tree 1094.6 ± 145.5 978.4 ± 130.4 1302.0 ± 140.4<br />
a<br />
Values are means ± SD. (n = 5 trees).<br />
841<br />
2 – 4 weeks after bloom. The roots <strong>of</strong> dormant trees<br />
conta<strong>in</strong>ed 70% <strong>and</strong> 41% <strong>of</strong> total tree N <strong>and</strong> Zn contents<br />
respectively, at the time when roots comprised 55% <strong>of</strong><br />
the tree biomass (Table III).<br />
In the second excavation, 2 weeks after bud break (22<br />
March), the total N <strong>and</strong> Zn contents per tree rema<strong>in</strong>ed<br />
relatively unchanged from the levels determ<strong>in</strong>ed<br />
previously <strong>in</strong> dormant trees. The fact that, <strong>in</strong> these trees,<br />
new growth conta<strong>in</strong>ed 34% <strong>and</strong> 38% <strong>of</strong> the total pool <strong>of</strong><br />
N <strong>and</strong> Zn, respectively, 2 weeks after bud break (Table<br />
III), <strong>in</strong>dicates the substantial <strong>in</strong>tra-tree redistribution <strong>of</strong><br />
nutrients that occurs dur<strong>in</strong>g this period.<br />
Recovery <strong>of</strong> <strong>labelled</strong> N <strong>and</strong> Zn applied to trees varied<br />
from 45.3 – 49.2% <strong>and</strong> from 6.8 – 7.9%, respectively<br />
(Table IV). These data did not <strong>in</strong>clude the 15 N <strong>and</strong> 68 Zn<br />
reta<strong>in</strong>ed <strong>in</strong> senescent leaves, as our aim was to quantify<br />
the amount <strong>of</strong> foliar-applied nutrient translocated from<br />
leaves to storage <strong>in</strong> perennial parts <strong>of</strong> the tree over the<br />
W<strong>in</strong>ter.<br />
Both elements were translocated throughout the trees<br />
after application. Sixty-five percent <strong>of</strong> the <strong>labelled</strong> N, <strong>and</strong><br />
42% <strong>of</strong> the <strong>labelled</strong> Zn were found <strong>in</strong> roots dur<strong>in</strong>g<br />
dormancy (Table V). Two weeks after full bloom, 24% <strong>of</strong><br />
the <strong>labelled</strong> N <strong>and</strong> 45.5% <strong>of</strong> the <strong>labelled</strong> Zn had been<br />
translocated to new growth <strong>and</strong>, by 4 weeks after full<br />
bloom (5 April), the storage pool had contributed 38%<br />
<strong>and</strong> 55.9% <strong>of</strong> N <strong>and</strong> Zn, respectively, to the new growth.<br />
A strik<strong>in</strong>g quantitative difference was apparent between<br />
the two nutrients <strong>in</strong> their re-translocation from storage<br />
to new growth. Roots remobilised 30% <strong>of</strong> stored N to the<br />
new growth, <strong>and</strong> 79% <strong>of</strong> stored Zn (Table IV). As a<br />
result, the amount <strong>of</strong> <strong>labelled</strong> N <strong>in</strong> roots decreased from<br />
65% to 43.8% <strong>of</strong> the tree total, <strong>and</strong> <strong>labelled</strong> Zn<br />
decreased from 42% to 7.7% <strong>of</strong> the tree total 1 month<br />
after full bloom (Table V).<br />
DISCUSSION<br />
Previous studies apply<strong>in</strong>g 68 Zn to a s<strong>in</strong>gle leaf or group<br />
<strong>of</strong> leaves <strong>in</strong> fruit trees have suggested limited mobility<br />
(Zhang <strong>and</strong> Brown, 1999; Sánchez <strong>and</strong> Righetti, 2002).<br />
TABLE II<br />
Total tree N (g N tree –1 ) <strong>and</strong> Zn (mg Zn tree –1 ) distributions among different organs <strong>of</strong> trees sampled dur<strong>in</strong>g dormancy (16 January), 2 weeks after full<br />
bloom (22 March) <strong>and</strong> 1 month follow<strong>in</strong>g full bloom (5 April)<br />
January 16 March 22 April 5<br />
Organ N Zn N Zn N Zn<br />
New Growth – – 5.70 ± 1.21 4.55 ± 0.86 14.93 ± 1.60 11.32 ± 0.98<br />
Shoots 3.30 ± 0.44 a<br />
4.51 ± 0.78 1.82 ± 0.55 2.95 ± 1.26 2.15 ± 0.24 4.26 ± 0.50<br />
Trunk 1.20 ± 0.35 2.27 ± 0.75 0.89 ± 0.16 1.95 ± 0.79 0.85 ± 0.14 2.13 ± 0.66<br />
Roots 10.79 ± 1.95 4.66 ± 0.36 8.24 ± 0.49 2.69 ± 0.39 7.94 ± 1.29 2.11 ± 0.49<br />
Whole Tree 15.29 ± 2.50 11.44 ± 1.78 16.65 ± 2.05 12.13 ± 2.75 25.87 ± 2.49 19.83 ± 2.26<br />
a<br />
Values are means ± SD (n = 5).<br />
TABLE III<br />
Percentage distribution <strong>of</strong> total tree N <strong>and</strong> Zn among different organs <strong>of</strong> trees sampled dur<strong>in</strong>g dormancy (16 January), 2 weeks after full bloom<br />
(22 March) <strong>and</strong> 1 month after full bloom (5 April)<br />
January 16 March 22 April 5<br />
Organ N Zn Sig. N Zn Sig. N Zn Sig.<br />
New Growth – – – 34.0 ± 3.5 37.9 ± 3.1 NS 57.7 ± 2.71 57.3 ± 2.0 NS<br />
Shoots 21.8 ± 2.3 a<br />
39.4 ± 2.8 ** b<br />
10.7 ± 2.1 23.6 ± 5.6 ** 8.4 ± 1.1 21.5 ± 1.8 **<br />
Trunk 7.8 ± 1.9 19.5 ± 3.2 ** 5.4 ± 0.6 15.8 ± 4.3 ** 3.3 ± 0.5 10.6 ± 2.6 **<br />
Roots 70.4 ± 2.2 41.1 ± 3.9 ** 49.9 ± 5.3 22.7 ± 4.0 ** 30.6 ± 3.6 10.6 ± 1.5 **<br />
Whole Tree 100.0 100.0 100.0 100.0 100.0 100.0<br />
a<br />
Values are means ± SD (n = 5).<br />
b<br />
NS, **, non-significant, or significant at P ≤ 0.01, respectively, by paired t test.