Assessment of shark sighting rates by aerial ... - Fisheries Reports
Assessment of shark sighting rates by aerial ... - Fisheries Reports
Assessment of shark sighting rates by aerial ... - Fisheries Reports

You also want an ePaper? Increase the reach of your titles
YUMPU automatically turns print PDFs into web optimized ePapers that Google loves.
<strong>Assessment</strong> <strong>of</strong> <strong>shark</strong> <strong>sighting</strong> <strong>rates</strong> <strong>by</strong> <strong>aerial</strong> beach patrols<br />
William D. Robbins, Victor M. Peddemors and Steven J. Kennelly<br />
NSW Department <strong>of</strong> Primary Industries<br />
Cronulla <strong>Fisheries</strong> Research Centre <strong>of</strong> Excellence<br />
PO Box 21, Cronulla, NSW, 2230<br />
Australia<br />
March 2012<br />
<strong>Fisheries</strong> Final Report Series<br />
No. 132<br />
ISSN 1837-2112
<strong>Assessment</strong> <strong>of</strong> <strong>shark</strong> <strong>sighting</strong> <strong>rates</strong> <strong>by</strong> <strong>aerial</strong> beach patrols<br />
March 2012<br />
Authors: William D. Robbins, Victor M. Peddemors and Steven J. Kennelly<br />
Published By: NSW Department <strong>of</strong> Primary Industries<br />
Postal Address: Cronulla <strong>Fisheries</strong> Research Centre <strong>of</strong> Excellence, PO Box 21, Cronulla, NSW, 2230<br />
Internet: www.dpi.nsw.gov.au<br />
© Department <strong>of</strong> Primary Industries<br />
This work is copyright. Except as permitted under the Copyright Act, no part <strong>of</strong> this reproduction may be<br />
reproduced <strong>by</strong> any process, electronic or otherwise, without the specific written permission <strong>of</strong> the copyright<br />
owners. Neither may information be stored electronically in any form whatsoever without such permission.<br />
DISCLAIMER<br />
The publishers do not warrant that the information in this report is free from errors or omissions. The publishers do<br />
not accept any form <strong>of</strong> liability, be it contractual, tortuous or otherwise, for the contents <strong>of</strong> this report for any<br />
consequences arising from its use or any reliance placed on it. The information, opinions and advice contained in<br />
this report may not relate to, or be relevant to, a reader’s particular circumstance.<br />
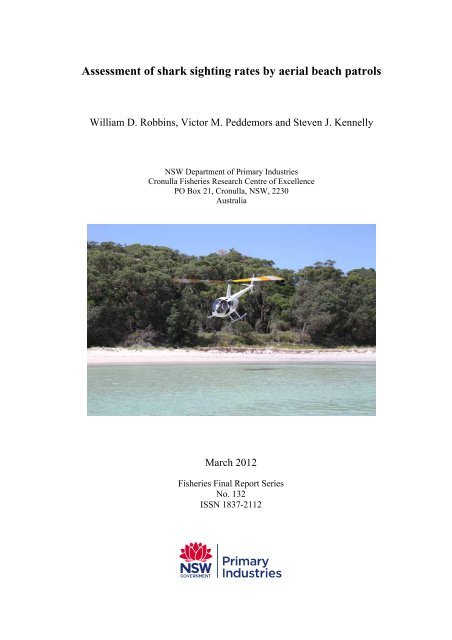
Cover photograph <strong>by</strong> W.D. Robbins<br />
ISSN 1837-2112<br />
Note: Previous issues <strong>of</strong> the ‘<strong>Fisheries</strong> Final Report Series’ (ISSN 1837-2112) have been published as follows:<br />
(i) No.’s 1 – 66: ‘NSW <strong>Fisheries</strong> Final Report Series’ (ISSN 1440-3544); (ii) No.’s 67 – 110: ‘NSW Department <strong>of</strong><br />
Primary Industries – <strong>Fisheries</strong> Final Report Series’ (ISSN 1449-9967); (iii) No.’s 111 – 129: ‘Industry &<br />
Investment NSW – <strong>Fisheries</strong> Final Report Series’ (ISSN 1837-2112).
Contents i<br />
TABLE OF CONTENTS<br />
TABLE OF CONTENTS.................................................................................................................................I<br />
LIST OF FIGURES........................................................................................................................................ II<br />
LIST OF TABLES.......................................................................................................................................... II<br />
ACKNOWLEDGEMENTS..........................................................................................................................III<br />
EXECUTIVE SUMMARY ...........................................................................................................................IV<br />
1. BACKGROUND ..................................................................................................................................... 5<br />
1.1. AERIAL SIGHTINGS OF SHARKS........................................................................................ 5<br />
1.2. OBJECTIVES OF THE RESEARCH...................................................................................... 6<br />
2. METHODS .............................................................................................................................................. 7<br />
2.1. STUDY LOCATION ............................................................................................................... 7<br />
2.2. EQUIPMENT ......................................................................................................................... 7<br />
2.3. DEPTH TRIAL ....................................................................................................................... 7<br />
2.4. DISTANCE TRIAL.................................................................................................................. 8<br />
2.5. ENVIRONMENTAL CORRELATIONS ................................................................................ 12<br />
2.6. COASTAL AERIAL PATROLS ............................................................................................. 12<br />
3. RESULTS ............................................................................................................................................. 13<br />
3.1. DEPTH EXPERIMENT........................................................................................................ 13<br />
3.2. DISTANCE EXPERIMENT .................................................................................................. 15<br />
3.3. ENVIRONMENTAL CORRELATIONS ................................................................................ 20<br />
3.4. COASTAL AERIAL PATROLS ............................................................................................. 23<br />
4. DISCUSSION ........................................................................................................................................ 26<br />
4.1. AERIAL SHARK DETECTION............................................................................................. 26<br />
4.2. ALTERNATIVES TO AERIAL BEACH PATROLS ............................................................... 28<br />
4.3. CONCLUSION ..................................................................................................................... 29<br />
5. REFERENCES...................................................................................................................................... 30<br />
<strong>Assessment</strong> <strong>of</strong> <strong>shark</strong> <strong>sighting</strong> <strong>rates</strong> <strong>by</strong> <strong>aerial</strong> beach patrols Robbins et al.
ii Contents<br />
LIST OF FIGURES<br />
Figure 1. (A) Tracing the white <strong>shark</strong> outline for all analogues. (B) An in-situ hammerhead<br />
<strong>shark</strong> analogue with snorkeller alongside...................................................................... 8<br />
Figure 2. (A) Study location on the NSW coast. (B) Representation <strong>of</strong> the deployment grid<br />
showing the six 5 km-long transects flown <strong>by</strong> each aircraft per trial ............................ 9<br />
Figure 3. (A) Google Earth image <strong>of</strong> 30º quadrilaterals accounting for likely errors in <strong>shark</strong><br />
analogue <strong>sighting</strong>s. (B) Quadrilaterals also showing reduced 15º and 22.5º leeways. 11<br />
Figure 4. Depths at which <strong>shark</strong> analogues were sighted <strong>by</strong> fixed-wing and helicopter<br />
observers maintaining their position at 500 ft (~150 m).............................................. 14<br />
Figure 5. Percentage <strong>of</strong> validated analogue <strong>sighting</strong>s with cumulative distances....................... 16<br />
Figure 6. Percentage <strong>of</strong> validated analogue <strong>sighting</strong>s per aircraft with relative contribution <strong>of</strong><br />
different trial treatments............................................................................................... 17<br />
Figure 7. Number <strong>of</strong> validated <strong>shark</strong> analogue <strong>sighting</strong>s with three levels <strong>of</strong> <strong>sighting</strong> angle<br />
leeway for each aircraft................................................................................................ 19<br />
Figure 8. Proportion <strong>of</strong> validated <strong>shark</strong> analogue <strong>sighting</strong>s per aircraft per day, with secchi<br />
disk measurements overlayed.. .................................................................................... 20<br />
Figure 9. Proportion <strong>of</strong> validated analogue <strong>sighting</strong>s per aircraft per day, with wind, sea state<br />
and cloud cover overlayed. .......................................................................................... 22<br />
Figure 10. Nnumbers <strong>of</strong> <strong>sighting</strong>s per 100 kms during coastal patrols <strong>of</strong> NSW beaches ............. 25<br />
LIST OF TABLES<br />
Table 1. Analysis <strong>of</strong> variance examining the effects <strong>of</strong> aircraft type, substrate depth and<br />
<strong>shark</strong> analogue type on <strong>sighting</strong> depth......................................................................... 14<br />
Table 2. Percentage <strong>of</strong> validated <strong>shark</strong> analogue <strong>sighting</strong>s with cumulative distance............... 15<br />
Table 3. Regression analysis <strong>of</strong> environmental factors on fixed-wing and helicopter<br />
observer <strong>sighting</strong> <strong>rates</strong>. ................................................................................................ 21<br />
Table 4. Analysis <strong>of</strong> variance examining the effects <strong>of</strong> aircraft type and flight direction on<br />
coastal <strong>sighting</strong>s........................................................................................................... 23<br />
Table 5. Number <strong>of</strong> reported <strong>sighting</strong>s <strong>by</strong> fixed-wing and helicopter crews during 10 days <strong>of</strong><br />
coastal patrols. ............................................................................................................. 24<br />
Robbins et al. <strong>Assessment</strong> <strong>of</strong> <strong>shark</strong> <strong>sighting</strong> <strong>rates</strong> <strong>by</strong> <strong>aerial</strong> beach patrols
Acknowledgements iii<br />
ACKNOWLEDGEMENTS<br />
We wish to thank both the fixed-wing and helicopter staff and crews for their generous assistance<br />
with this project. We also thank P. O’Connor and A. Genders for logistical support, D. Collins for<br />
valuable statistical advice and S. McGreal for entry <strong>of</strong> the <strong>aerial</strong> patrol data. LCDR R. J. Kyle and<br />
CPO G. Jesser <strong>of</strong> the Royal Australian Navy and M. Carr <strong>of</strong> the Jervis Bay Marine Park are<br />
thanked for their support <strong>of</strong> this project. This project was funded through NSW Department <strong>of</strong><br />
Primary Industries Shark Meshing (Bather Protection) Program.<br />
<strong>Assessment</strong> <strong>of</strong> <strong>shark</strong> <strong>sighting</strong> <strong>rates</strong> <strong>by</strong> <strong>aerial</strong> beach patrols Robbins et al.
iv Summary<br />
EXECUTIVE SUMMARY<br />
Aerial surveys are a recognised technique to identify the presence and abundance <strong>of</strong> marine<br />
animals. However, the capability <strong>of</strong> <strong>aerial</strong> observers to reliably sight coastal <strong>shark</strong>s has not been<br />
assessed, nor have differences in <strong>sighting</strong> <strong>rates</strong> between aircraft types been examined. In this study<br />
we assessed the ability <strong>of</strong> fixed-wing and helicopter observers to sight 2.5 m artificial <strong>shark</strong><br />
analogues constructed <strong>of</strong> marine ply. The use <strong>of</strong> artificial analogues allowed us to control the depth<br />
and spatial distribution <strong>of</strong> potential <strong>sighting</strong>s while providing a realistic visual image for aircrew<br />
observers. Analogues were traced from the silhouette <strong>of</strong> a white <strong>shark</strong>, with some <strong>of</strong> the heads<br />
modified to represent tiger <strong>shark</strong>s and hammerhead <strong>shark</strong>s. The depth at which the <strong>shark</strong> analogues<br />
could be seen was very shallow, averaging only 2.5 m and 2.7 m below the water surface for fixedwing<br />
and helicopter observers, respectively. Substratum depth and analogue head type did not<br />
affect <strong>sighting</strong> <strong>rates</strong>. A succession <strong>of</strong> <strong>shark</strong> analogues was then deployed at ~2 m depth in a 5 km<br />
grid, and their sightability to observers in both aircraft assessed through a series <strong>of</strong> transects flown<br />
up to 500 m distant. Low overall <strong>sighting</strong> <strong>rates</strong> <strong>of</strong> only 12.5% and 17.1% were recorded for fixedwing<br />
and helicopter observers, respectively. Helicopter observers had consistently higher success<br />
<strong>rates</strong> at <strong>sighting</strong> analogues up to a distance <strong>of</strong> 250 m, however neither aircraft observers sighted<br />
more than nine percent <strong>of</strong> analogues deployed greater than 300 m from their flight paths.<br />
Environmental observations showed that the helicopter observations were more affected <strong>by</strong> air and<br />
sea conditions, while the range <strong>of</strong> water turbidities recorded during the study had no effect on<br />
<strong>sighting</strong> <strong>rates</strong> <strong>of</strong> either aircraft observers. We conclude that <strong>aerial</strong> observers have limited ability to<br />
detect the presence <strong>of</strong> submerged animals such as <strong>shark</strong>s, especially when the <strong>shark</strong>s are deeper<br />
than 2.5 m, or more than 300 m distant from the aircraft’s flight path. This raises serious concerns<br />
about the utility <strong>of</strong> programs such as <strong>aerial</strong> beach patrols as a warning system for <strong>shark</strong>s.<br />
Examination <strong>of</strong> <strong>sighting</strong> records from 20 actual coastal <strong>aerial</strong> patrols confirmed this concern, with<br />
very low <strong>shark</strong> <strong>sighting</strong> <strong>rates</strong> (0.69 – 1.18 <strong>shark</strong>s 100 km -1 ), likely underestimating the presence <strong>of</strong><br />
many <strong>shark</strong> species known to occur in the area.<br />
Robbins et al. <strong>Assessment</strong> <strong>of</strong> <strong>shark</strong> <strong>sighting</strong> <strong>rates</strong> <strong>by</strong> <strong>aerial</strong> beach patrols
NSW DPI 5<br />
1. BACKGROUND<br />
1.1. Aerial <strong>sighting</strong>s <strong>of</strong> <strong>shark</strong>s<br />
Aerial surveys using helicopter and fixed-wing aircraft have been used to estimate the presence and<br />
abundance <strong>of</strong> terrestrial and marine animals for many years. Terrestrial surveys have focused on<br />
large quadrupeds such as moose, oryx, elk, deer, horses and zebras (Anderson & Lindzey 1996,<br />
Freddy et al. 2004, Krueger et al. 2007, Dawson & Miller 2008, Gilbert & Moeller 2008, Parker et<br />
al. 2011), although abundances <strong>of</strong> kangaroos, goats, emus and smaller birds have also been<br />
assessed (Hone & Short 1988, Ayers & Anderson 1999, Cairns et al. 2008, Rice et al. 2009,<br />
Vrtiska & Powell 2011). Numerous factors affect the ability <strong>of</strong> observers to sight terrestrial species,<br />
including group size, individual activity and the frequency at which animals are obscured <strong>by</strong><br />
vegetation (Graham & Bell 1989, Anderson & Lindzey 1996, McIntosh et al. 2009).<br />
Although not affected <strong>by</strong> vegetation cover, <strong>aerial</strong> <strong>sighting</strong> <strong>rates</strong> <strong>of</strong> marine animals are influenced <strong>by</strong><br />
environmental and biological factors. Water turbidity, wind strength and sea chop can all reduce<br />
<strong>sighting</strong> <strong>rates</strong> (Ross et al. 1989, Pollock et al. 2006), as can the size and behaviour <strong>of</strong> the animals.<br />
Marine <strong>aerial</strong> surveys have therefore focussed primarily on the abundance <strong>of</strong> air-breathing animals,<br />
such as bottlenose dolphins, right whales, sea lions, harbour seals, dugongs, turtles, sea otters and<br />
penguins (Marsh & Sinclair 1989b, Cockcr<strong>of</strong>t et al. 1992, Bodkin & Udevitz 1999, Gales et al.<br />
2004, Cardona et al. 2005, Lowry & Forney 2005, Southwell et al. 2008, Clark et al. 2010,<br />
Cunningham et al. 2010). Sightings <strong>of</strong> such air-breathing marine species are easier than for<br />
submerged species, as they are more visible on the water surface (Ross et al. 1989). Moreover,<br />
<strong>sighting</strong> animals as they surface to breathe removes the obscuring effects <strong>of</strong> turbidity, and creates<br />
additional <strong>sighting</strong> cues such as a high-contrast wake as individuals break the surface. This effect is<br />
enhanced when surveying species such as dolphins travelling in pods, where up to 300 individuals<br />
may be present in a single group (Ross et al. 1989).<br />
Targeted <strong>aerial</strong> surveys <strong>of</strong> <strong>shark</strong>s have focused mostly on large (>10 m) species, such as whale<br />
<strong>shark</strong>s (Rhincodon typus) and basking <strong>shark</strong>s (Cetorhinus maximus) (Wilson 2004, Burks et al.<br />
2005, Cliff et al. 2007, Rowat et al. 2009). These species frequent the surface for feeding and<br />
courtship (Harvey-Clark et al. 1999, Motta et al. 2010), allowing groups <strong>of</strong> individuals to be<br />
readily detected. Smaller (
6 NSW DPI<br />
<strong>of</strong> their time close to the substratum (Holland et al. 1999, Bonfil et al. 2005), the reported <strong>sighting</strong>s<br />
may represent only a small proportion <strong>of</strong> <strong>shark</strong>s present.<br />
The NSW government withdrew its support for the use <strong>of</strong> <strong>aerial</strong> patrols as a preventative measure<br />
against <strong>shark</strong> attack in 2007 following a negative assessment <strong>of</strong> their suitability in the 2006 NSW<br />
Scientific Shark Protection Summit (Anon 2006). However, over the summers <strong>of</strong> 2009/10 and<br />
2010/11, the government agreed to review their suitability through sponsored <strong>aerial</strong> beach patrols.<br />
Helicopter surveys were undertaken in 2009/10, but few <strong>shark</strong>s were sighted (Anon 2010b). A lack<br />
<strong>of</strong> confidence due to potential under-reporting <strong>of</strong> <strong>shark</strong>s led to a review <strong>of</strong> the data required to more<br />
accurately assess the suitability <strong>of</strong> <strong>aerial</strong> surveys to <strong>of</strong>fer protection to bathers in NSW. The<br />
summer <strong>of</strong> 2010/11 therefore included further surveys, and a series <strong>of</strong> conjunctive scientific trials<br />
assessing <strong>shark</strong> <strong>sighting</strong> <strong>rates</strong> <strong>by</strong> helicopter and fixed-wing observers.<br />
1.2. Objectives <strong>of</strong> the research<br />
This report outlines the findings <strong>of</strong> the 2010/11 NSW <strong>aerial</strong> patrols, beginning with the structured<br />
assessment <strong>of</strong> <strong>shark</strong> <strong>sighting</strong> <strong>rates</strong> from observers in two aircraft types. As the real-time tracking <strong>of</strong><br />
live <strong>shark</strong>s was logistically and economically impractical, we assessed <strong>aerial</strong> <strong>sighting</strong> effectiveness<br />
using life-sized <strong>shark</strong> analogues. Artificial animal analogues have been successfully used for this<br />
purpose during <strong>aerial</strong> surveys <strong>of</strong> dugong (Dugong dugong) in Queensland (Pollock et al. 2006), and<br />
allow control over deployment depth and distance from the aircraft. The depths at which large (2.5<br />
m) plywood <strong>shark</strong> analogues were sighted <strong>by</strong> fixed-wing and helicopter observers was assessed<br />
first, and using this information, the effects <strong>of</strong> horizontal distance on <strong>sighting</strong> <strong>rates</strong> subsequently<br />
determined. These findings were then contrasted with genuine coastal <strong>aerial</strong> patrols undertaken <strong>by</strong><br />
both aircraft.<br />
Robbins et al. <strong>Assessment</strong> <strong>of</strong> <strong>shark</strong> <strong>sighting</strong> <strong>rates</strong> <strong>by</strong> <strong>aerial</strong> beach patrols
NSW DPI 7<br />
2. METHODS<br />
2.1. Study location<br />
The study was conducted at the northern side <strong>of</strong> Jervis Bay, NSW (35.0167ºS, 150.7311ºE). This is<br />
a large embayment (~112 km 2 ) with a substratum consisting primarily <strong>of</strong> sand and seagrass, and a<br />
topography <strong>of</strong>fering protection from winds and swells. The bay was located within a 30 min flight<br />
to the Albion Park airbase near Wollongong.<br />
2.2. Equipment<br />
Two aircraft were used in this study: A Cessna 182 fixed-wing aeroplane and a Robinson R44<br />
Clipper II helicopter. The fixed-wing company had considerable experience with <strong>aerial</strong> <strong>shark</strong><br />
detection, while the helicopter company had no prior experience. The aircrews <strong>of</strong> both aircraft<br />
consisted <strong>of</strong> a pilot, an observer to sight the <strong>shark</strong> analogues and a data recorder. Due to cockpit<br />
configurations, the observer looked out to the right in the fixed-wing aircraft and to the left in the<br />
helicopter.<br />
The artificial <strong>shark</strong> analogues consisted <strong>of</strong> 2.5 m (total length) plywood cutouts, painted a similar<br />
shade <strong>of</strong> grey to that <strong>of</strong> large <strong>shark</strong>s. The analogue shape was traced from a white <strong>shark</strong><br />
(Carcharodon carcharias) incidentally captured through the NSW DPI Shark Meshing (Bather<br />
Protection) Program. The head morphology was altered in a number <strong>of</strong> analogues to mimic bluntheaded<br />
tiger <strong>shark</strong>s (Galeocerdo cuvier) and hammerhead <strong>shark</strong>s (Sphyrna sp.) (Fig. 1). The<br />
hammerhead outline was traced from a stored head at the Cronulla <strong>Fisheries</strong> Research Centre <strong>of</strong><br />
Excellence, while the tiger <strong>shark</strong> head outline was drawn from a photograph taken <strong>by</strong> the lead<br />
author. Wire cables <strong>of</strong> sufficient length to allow the analogues to sit approximately horizontal in the<br />
water were attached to each corner, terminating in a single metal ring to which an anchor rope was<br />
attached. The analogues were inherently buoyant, although a small (3 cm) grey/yellow surface float<br />
was attached via a string to aid the boat crew in relocating submerged analogues. These floats were<br />
not visible to the aircraft observers.<br />
2.3. Depth trial<br />
A series <strong>of</strong> stations consisting <strong>of</strong> a small galvanised pulley attached to 28 kg <strong>of</strong> coal chain as an<br />
anchor were deployed in 6 m and 12 m water depths. A 6 mm rope was threaded through the<br />
pulley, with one end attached to a <strong>shark</strong> analogue, and the other end held taut <strong>by</strong> a crewmember on<br />
a 5.7 m runabout vessel anchored ~20 m away. Each analogue was initially sunk to a depth <strong>of</strong> 5 – 6<br />
m, where<strong>by</strong> an aircraft would then orbit (fixed-wing) or hover (helicopter) at 500 ft (~150 m) above<br />
the position <strong>of</strong> the analogue while it was slowly raised towards the surface <strong>by</strong> the boat crew<br />
member releasing the rope. The aircrew radioed the boat once the analogue was seen, at which time<br />
the depth <strong>of</strong> the analogue below the water surface was digitally measured. The boat crew member<br />
randomly changed the speed <strong>of</strong> the surfacing analogue to prevent it becoming visible to the<br />
aircrews after a predictable period. Each analogue type (white <strong>shark</strong>, tiger <strong>shark</strong> and hammerhead<br />
<strong>shark</strong>) was tested three times in each <strong>of</strong> the two water depths for each aircraft. Water turbidity was<br />
established using a 25 cm secchi disk deployed in the shade <strong>of</strong> the boat throughout the day. Data<br />
was log(x+1) transformed to reduce variance homogeneity, and analysed using ANOVA in SPSS<br />
17. Aircraft, depth and analogue type were treated as fixed factors, and day as a random factor.<br />
<strong>Assessment</strong> <strong>of</strong> <strong>shark</strong> <strong>sighting</strong> <strong>rates</strong> <strong>by</strong> <strong>aerial</strong> beach patrols Robbins et al.
8 NSW DPI<br />
A B<br />
Figure 1. (A) Tracing the white <strong>shark</strong> outline for all analogues. (B) An in-situ hammerhead<br />
<strong>shark</strong> analogue with snorkeller alongside.<br />
2.4. Distance trial<br />
A 5 km x 0.25 km grid was established using a hand-held Garmin GPS (Fig. 2A). Analogues were<br />
anchored at pre-determined positions within the grid, using 14 kg <strong>of</strong> coal chain anchor attached to a<br />
6 mm rope. Following the results <strong>of</strong> the depth trial, all analogues were deployed at 1.8 – 2.2 m<br />
below the water surface, depending on the state <strong>of</strong> the tide. This ensured that all analogues were<br />
potentially visible to aircraft observers.<br />
Three separate trials were conducted <strong>by</strong> each aircraft each day. Each trial consisted <strong>of</strong> the aircraft<br />
flying a set <strong>of</strong> six 5 km-long transects as determined <strong>by</strong> GPS, with observers looking for the <strong>shark</strong><br />
analogues. Between three and nine analogues were deployed for each trial, with analogues<br />
added/removed <strong>by</strong> the boat crew between trials once the aircraft left the area. Analogues were<br />
placed at least 500 m apart, giving a minimum <strong>of</strong> ~10 sec between potential <strong>sighting</strong>s while flying<br />
at 100 kts. The same analogue configurations were employed for both aircraft each day, although in<br />
reverse order. This ensured direct comparison between aircraft <strong>sighting</strong>s. An additional single <strong>shark</strong><br />
analogue with a visible yellow float was deployed on the surface for 12 trials per aircraft. These<br />
surface deployments were not included in analyses, but were used to provide a consistent <strong>sighting</strong><br />
event to calibrate observer distance estimates.<br />
Each day, each aircraft conducted two <strong>of</strong> their trials at their cruising speed (100 kts for fixed-wing,<br />
60 kts for helicopter), without stopping or deviating from their flightpath. The third trial allowed<br />
the fixed-wing aircrew to orbit to confirm <strong>sighting</strong>s if desired, which is the normal procedure<br />
during NSW <strong>aerial</strong> beach patrols. The third helicopter trial was conducted at an increased speed <strong>of</strong><br />
100 kts without stopping or deviating from their flightpath to allow direct comparison with the<br />
fixed-wing aircraft. The order in which the trials were undertaken changed each day, and the order<br />
in which each aircraft flew alternated each day. The order in which transects were flown was also<br />
varied between trials.<br />
Robbins et al. <strong>Assessment</strong> <strong>of</strong> <strong>shark</strong> <strong>sighting</strong> <strong>rates</strong> <strong>by</strong> <strong>aerial</strong> beach patrols
NSW DPI 9<br />
The six flight transects lay 150 m apart, running in an east-west orientation to minimise sun glare to<br />
the sideways-looking observers. Two transects (E-F and G-H) lay within the deployment grid,<br />
while the other four lay outside (Fig. 2B). For each trial, the aircraft flew all six transects at 500 ft<br />
(~150 m), in the directions that ensured the observer was always facing towards the centre <strong>of</strong> the<br />
grid. When a <strong>shark</strong> analogue was sighted, the observer would notify the rest <strong>of</strong> the aircrew,<br />
signalling the pilot to mark a GPS waypoint, and the recorder to note both the GPS waypoint<br />
number and the observer’s estimate <strong>of</strong> the angle relative to the aircraft and distance to the analogue.<br />
Unless permitted, the aircraft would not deviate from its flightpath. Pilots would radio the number<br />
<strong>of</strong> analogues seen at the end <strong>of</strong> each transect, which was later verified against the datasheets.<br />
Datasheets were faxed <strong>by</strong> aircrew at the end <strong>of</strong> each day, with the latitude and longitude <strong>of</strong> each<br />
GPS waypoint included.<br />
On a number <strong>of</strong> occasions, analogues were deployed on the far northern or southern edge <strong>of</strong> the<br />
grid. In these cases, the individual analogues were outside the viewing area <strong>of</strong> observers on<br />
transects E-F or G-H, respectively (Fig. 2B). These analogues were therefore not included when<br />
calculating <strong>sighting</strong> <strong>rates</strong> <strong>of</strong> those transects.<br />
A<br />
C<br />
E<br />
G<br />
I<br />
K<br />
B<br />
X<br />
A<br />
X<br />
Jervis Bay,<br />
NSW<br />
X<br />
Figure 2. (A) Study location on the NSW coast showing the position <strong>of</strong> the survey grid in<br />
Jervis Bay. (B) Representation <strong>of</strong> the deployment grid (grey shading) showing the<br />
six 5 km-long transects flown <strong>by</strong> each aircraft per trial (not to scale). Letters<br />
represent transect coding given to aircrews. “X”s represent hypothetical analogue<br />
deployments. Observers faced southwards in transects A-B, C-D and E-F, and<br />
northwards in G-H, I-J and K-L. In this example, the circled analogue could not be<br />
seen on transect E-F and would not be included in that transect’s calculations. All<br />
other analogues could potentially be seen during each transect (up to six <strong>sighting</strong>s<br />
per trial).<br />
<strong>Assessment</strong> <strong>of</strong> <strong>shark</strong> <strong>sighting</strong> <strong>rates</strong> <strong>by</strong> <strong>aerial</strong> beach patrols Robbins et al.<br />
X<br />
5 km<br />
N<br />
X<br />
X<br />
B<br />
D<br />
F<br />
H<br />
J<br />
L
10 NSW DPI<br />
To allow for human errors and aircraft yaw during analogue <strong>sighting</strong>s, three additional positions<br />
were calculated for each given GPS waypoint:<br />
a) the position at the far side <strong>of</strong> the deployment grid using the angle the observer recorded,<br />
with a 30º leeway;<br />
b) the position <strong>of</strong> the aircraft a maximum <strong>of</strong> 2 sec prior to the GPS waypoint. This allowed for<br />
delays in the pilot responding and marking the point; and<br />
c) the position at the far side <strong>of</strong> the deployment grid 2 sec prior to the GPS waypoint using the<br />
angle the observer recorded, with a 30º leeway.<br />
This produced the coordinates for a four-sided quadrilateral, the boundary <strong>of</strong> which accounted for<br />
any likely errors in marking the position or estimating the angle to a sighted analogue (Fig. 3A).<br />
Using Earth Point online s<strong>of</strong>tware (https://www.earthpoint.us), the quadrilateral coordinates for<br />
each reported <strong>sighting</strong> were uploaded in Google Earth, along with the position <strong>of</strong> each deployed<br />
analogue. If an analogue lay within the area bounded <strong>by</strong> the quadrilateral, it was counted as a<br />
genuine <strong>sighting</strong>. If not, it was counted as a false <strong>sighting</strong>. This procedure was repeated for leeways<br />
<strong>of</strong> 15º and 22.5º to examine the accuracy <strong>of</strong> the observers’ angle estimates (Fig. 3B). Straight-line<br />
distance from the aircraft to each validated analogue <strong>sighting</strong> was then calculated. Here, half the<br />
maximum delay (1 sec) was subtracted from each given GPS position to allow for the delay in the<br />
pilot reacting, locating and pressing the GPS button following the observer’s announcement <strong>of</strong> a<br />
<strong>sighting</strong>.<br />
The proportion <strong>of</strong> deployed analogues sighted was calculated in MS Excel. To calculate the<br />
number <strong>of</strong> potential <strong>sighting</strong>s at each distance, the minimum distance the aircraft passed <strong>by</strong> the<br />
analogue was used if the analogue was not seen, while the straight-line distance from the analogue<br />
to the aircraft was used if the analogue was sighted. For example, if the aircraft flew within 100 m<br />
<strong>of</strong> an analogue without it being seen, it was counted as a potential 100 m <strong>sighting</strong>. However, if the<br />
same analogue was sighted from 130 m distance, it was counted as a 130 m <strong>sighting</strong>. Results were<br />
binned into 50 m categories (0 – 49 m, 50 – 99 m, etc.) for analysis and plotting. Standard errors <strong>of</strong><br />
<strong>sighting</strong> <strong>rates</strong> were calculated using the formula:<br />
SE = p × ( 1−<br />
p)<br />
where:<br />
n<br />
p is the proportion <strong>of</strong> analogues sighted; and<br />
n is the number <strong>of</strong> analogues deployed (Zar 1996).<br />
Robbins et al. <strong>Assessment</strong> <strong>of</strong> <strong>shark</strong> <strong>sighting</strong> <strong>rates</strong> <strong>by</strong> <strong>aerial</strong> beach patrols
NSW DPI 11<br />
A<br />
B<br />
Figure 3. (A) Google Earth image <strong>of</strong> 30º quadrilaterals accounting for likely errors in <strong>shark</strong><br />
analogue <strong>sighting</strong>s. Parallel lines indicate the six transects flown per trials. Circles<br />
indicate deployed <strong>shark</strong> analogues. Aeroplane symbol marks the GPS position<br />
given. (B). The same <strong>sighting</strong>s as (A), with additional quadrilaterals showing<br />
reduced 15º and 22.5º leeways.<br />
<strong>Assessment</strong> <strong>of</strong> <strong>shark</strong> <strong>sighting</strong> <strong>rates</strong> <strong>by</strong> <strong>aerial</strong> beach patrols Robbins et al.
12 NSW DPI<br />
2.5. Environmental correlations<br />
Aircrew and boatcrew would estimate the wind speed, sea state (Beaufort scale) and cloud cover<br />
when possible for each trial, with the average <strong>of</strong> both crews’ readings used in analyses. Water<br />
turbidity was also measured <strong>by</strong> the boat crew deploying a secchi disk in the shade <strong>of</strong> the boat at the<br />
start, middle and end <strong>of</strong> each day’s sampling, at both ends and in the middle <strong>of</strong> the grid. These<br />
values were averaged to provide a daily water turbidity estimate.<br />
2.6. Coastal <strong>aerial</strong> patrols<br />
Both aircraft undertook a series <strong>of</strong> genuine beach patrols as part <strong>of</strong> this study. Aircraft flew<br />
between South Wollongong (34.4240ºS, 150.9103ºE) and Stockton Beach (32.9074ºS,<br />
151.7956ºE), surveying the region encompassed <strong>by</strong> the NSW DPI Shark Meshing (Bather<br />
Protection) Program. Each flying day consisted <strong>of</strong> a north-bound and south-bound flight, resulting<br />
in the area being surveyed twice. Each flight was considered to be 225 km long, calculated <strong>by</strong><br />
measuring the coastal distance between the start and end beaches using a GPS mapping program.<br />
Flights searched the area approximately 500 m seaward <strong>of</strong> the rear <strong>of</strong> the surf zone (surf backline),<br />
recording all <strong>shark</strong>s and other marine life seen. The helicopter flew behind the fixed-wing aircraft<br />
to allow direct comparisons <strong>of</strong> <strong>sighting</strong>s. Both aircraft flew at their cruising speeds <strong>of</strong> 100 knots<br />
and 60 knots, respectively, with the fixed-wing aircraft periodically orbiting out to sea to allow the<br />
helicopter to catch up. Aircrews did not contact each other during flights, nor was the fixed-wing<br />
aircraft permitted to orbit to verify <strong>sighting</strong>s. This prevented the helicopter aircrew from being<br />
alerted that an object had been seen <strong>by</strong> the fixed-wing observers. Aircraft refuelled at separate<br />
aerodromes between north- and south-bound surveys due to logistical reasons, however this also<br />
ensured no discussion <strong>of</strong> <strong>sighting</strong> records could take place. Results <strong>of</strong> each day’s flights were faxed<br />
immediately upon return to the contracting company bases. Data analysis was conducted using<br />
ANOVA in SPSS 17. Data were log(x+1) transformed when necessary prior to analyses. Direction<br />
and aircraft type were treated as fixed factors, with day included as a random factor.<br />
Robbins et al. <strong>Assessment</strong> <strong>of</strong> <strong>shark</strong> <strong>sighting</strong> <strong>rates</strong> <strong>by</strong> <strong>aerial</strong> beach patrols
NSW DPI 13<br />
3. RESULTS<br />
3.1. Depth experiment<br />
Depth trials were conducted between 0800 hr and 1600 hr over two days, encompassing an equal<br />
proportion <strong>of</strong> sunny and overcast conditions. The order <strong>of</strong> aircraft participation alternated between<br />
the two days, with equal replicates conducted each day. Water clarity as measured <strong>by</strong> secchi disk<br />
fadeout was good, with turbidities <strong>of</strong> 2.9 – 3.5 m (day 1) and 4.5 – 6.1 m (day 2). Wind strength<br />
was under 10 kts each day.<br />
No significant differences were found between aircraft types, indicating that observers in each<br />
aircraft had comparable ability to sight the <strong>shark</strong> analogues (Table 1). The maximum depth at<br />
which the 2.5 m-long analogues were observed was shallow, averaging 2.5 + 0.1 m (SE) for the<br />
fixed-wing aircraft, and 2.7 + 0.1 m (SE) for the helicopter (Fig. 4). The maximum depth <strong>of</strong> any<br />
individual <strong>sighting</strong> was 4.3 m (fixed-wing) and 3.7 m (helicopter). Although the deeper water at the<br />
12 m stations created a darker background, this had no significant effect on analogue <strong>sighting</strong><br />
depths (Table 1, Fig. 4). Observers therefore appeared to be <strong>sighting</strong> the analogues based on their<br />
appearance below the water surface, rather than through secondary effects such as shadows cast<br />
onto the substratum, or increased silhouetting <strong>of</strong> the analogues in shallower depths. The lack <strong>of</strong><br />
effect <strong>of</strong> water depth on analogue sightability allowed the subsequent distance trial to be<br />
undertaken across the width <strong>of</strong> northern Jervis Bay, including varying (9 – 15 m) substratum<br />
depths.<br />
Changes in the head shape <strong>of</strong> analogues also had no significant effect on their sightability (Table 1,<br />
Fig. 4). The increased surface area visible on the hammerhead analogues did not increase their<br />
<strong>sighting</strong> depth, nor did the decreased surface pr<strong>of</strong>ile <strong>of</strong> the white <strong>shark</strong> make them more difficult to<br />
detect. Equal vertical detection probabilities enabled deployment <strong>of</strong> all three analogue types in the<br />
subsequent distance trial.<br />
<strong>Assessment</strong> <strong>of</strong> <strong>shark</strong> <strong>sighting</strong> <strong>rates</strong> <strong>by</strong> <strong>aerial</strong> beach patrols Robbins et al.
14 NSW DPI<br />
Table 1. Analysis <strong>of</strong> variance examining the effects <strong>of</strong> aircraft type, substrate depth and<br />
<strong>shark</strong> analogue type on <strong>sighting</strong> depth.<br />
Depth analogues sighted + SE (m)<br />
3.5<br />
3.0<br />
2.5<br />
2.0<br />
1.5<br />
1.0<br />
0.5<br />
0.0<br />
Factor SS df F P<br />
Aircraft 0.009 1 1.921 0.40<br />
Depth 0.016 1 9.561 0.20<br />
Analogue 0.003 2 0.610 0.62<br />
Aircraft x Depth 0.000 1 0.010 0.94<br />
Aircraft x Analogue 0.002 2 2.271 0.31<br />
Depth x Analogue 0.008 2 2.341 0.30<br />
Aircraft x Depth x Analogue 0.008 2 0.434 0.70<br />
Shallow Deep Shallow Deep Shallow Deep<br />
Hammerhead <strong>shark</strong> Tiger <strong>shark</strong> White <strong>shark</strong><br />
Analogue type and depth<br />
Figure 4. Depths at which <strong>shark</strong> analogues were sighted <strong>by</strong> fixed-wing and helicopter<br />
observers maintaining their position at 500 ft (~150 m) around a known position.<br />
Open (white) bars indicate fixed-wing <strong>sighting</strong>s, closed (grey) bars indicate<br />
helicopter <strong>sighting</strong>s.<br />
Robbins et al. <strong>Assessment</strong> <strong>of</strong> <strong>shark</strong> <strong>sighting</strong> <strong>rates</strong> <strong>by</strong> <strong>aerial</strong> beach patrols
NSW DPI 15<br />
3.2. Distance experiment<br />
Distance trials were conducted between 0940 hr and 1605 hr over six non-consecutive days. Each<br />
aircraft undertook three trials per day, with the exception <strong>of</strong> two fixed-wing trials being cancelled<br />
due to adverse weather on the first day. A total <strong>of</strong> 96 fixed-wing transects (66 transects at 100 kts<br />
plus 30 transects at 100 kts with orbiting permitted), and 108 helicopter transects (72 transects at 60<br />
kts plus 36 transects at 100 kts) were flown. There were 230 analogue deployments (107 during<br />
fixed-wing trials, 123 during helicopter trials) positioned 0 – 500 m from the transect paths. These<br />
provided 617 potential <strong>sighting</strong> opportunities for fixed-wing aircraft observers and 709<br />
opportunities for helicopter observers.<br />
Overall <strong>sighting</strong> <strong>rates</strong> were quite low, with only 12.5% and 17.1% <strong>of</strong> all deployments detected <strong>by</strong><br />
the fixed-wing and helicopter observers, respectively (Table 2). These <strong>rates</strong> declined sharply with<br />
distances greater than 150 m (Table 2, Fig. 5). Although a proportional increase in <strong>sighting</strong>s was<br />
apparent at distances over 450 m (Table 2, Fig. 5), this was an artefact <strong>of</strong> the relatively low number<br />
<strong>of</strong> deployments at this distance. Validated analogue <strong>sighting</strong>s were identified at distances up to 506<br />
m (fixed-wing) and 755 m (helicopter). Of the 305 <strong>sighting</strong> events reported, 198 were validated<br />
analogue <strong>sighting</strong>s (77 fixed-wing, 121 helicopter), 50 were <strong>sighting</strong>s <strong>of</strong> the floating analogue used<br />
for comparing distance estimates, 10 were reports <strong>of</strong> real <strong>shark</strong>s and dolphins and 47 were cases <strong>of</strong><br />
false <strong>sighting</strong>s. Although they had only 15% more analogues deployed, the helicopter aircrew<br />
recorded 57% more validated analogue <strong>sighting</strong>s than the fixed-wing aircrew.<br />
Table 2. Percentage <strong>of</strong> validated <strong>shark</strong> analogue <strong>sighting</strong>s with cumulative distance.<br />
Number <strong>of</strong> analogue deployments shown in parentheses.<br />
Percentage <strong>of</strong> analogues sighted<br />
Distance Fixed-wing Helicopter<br />
All 12.5 (617) 17.1 (709)<br />
>50 m 13.2 (583) 17.7 (672)<br />
>100 m 13.9 (533) 17.0 (268)<br />
>150 m 11.5 (459) 11.8 (542)<br />
>200 m 7.9 (392) 8.5 (469)<br />
>250 m 6.8 (325) 4.3 (373)<br />
>300 m 4.8 (251) 2.8 (287)<br />
>350 m 3.3 (181) 1.9 (209)<br />
>400 m 3.6 (111) 1.6 (124)<br />
>450 m 1.7 (60) 2.9 (70)<br />
>500 m 3.8 (26) 6.3 (32)<br />
<strong>Assessment</strong> <strong>of</strong> <strong>shark</strong> <strong>sighting</strong> <strong>rates</strong> <strong>by</strong> <strong>aerial</strong> beach patrols Robbins et al.
16 NSW DPI<br />
Percentage <strong>of</strong> analogues sighted + SE<br />
20<br />
15<br />
10<br />
5<br />
0<br />
All<br />
>50 m<br />
>100 m<br />
>150 m<br />
>200 m<br />
>250 m<br />
>300 m<br />
Distance from aircraft (m)<br />
Figure 5. Percentage <strong>of</strong> validated analogue <strong>sighting</strong>s with cumulative distances. Solid line<br />
(∆) represents fixed-wing aircraft <strong>sighting</strong>s, dashed line (●) represents helicopter<br />
<strong>sighting</strong>s. Data points are <strong>of</strong>fset for clarity.<br />
The breakdown <strong>of</strong> <strong>sighting</strong> <strong>rates</strong> <strong>by</strong> individual distance reveal that the fixed-wing observers had the<br />
greatest success at <strong>sighting</strong> analogues deployed 100 – 200 m from their flightpath (Fig. 6). Here,<br />
they successfully sighted up to 33% <strong>of</strong> deployed analogues. This rate reduced to 13 – 14% at<br />
distances <strong>of</strong> 200 – 300 m from the aircraft. All analogues deployed outside these ranges were<br />
sighted less than 9% <strong>of</strong> the time.<br />
Helicopter observers consistently saw a greater proportion <strong>of</strong> deployed analogues than the fixedwing<br />
observers at distances up to 250 m from the aircraft (Fig. 6). The optimal <strong>sighting</strong> range for<br />
the helicopter was 100 m from the flight path, at which half the deployed analogues were sighted.<br />
However at least 25% <strong>of</strong> analogues were sighted at each distance between 50 – 250 m from the<br />
flight path. The higher visibility <strong>of</strong> the helicopter cockpit also enabled observers to see analogues<br />
within 50 m <strong>of</strong> their flight path. Similar to the fixed-wing observer <strong>sighting</strong>s, distant analogue<br />
deployments (more than 250 m from the flight path) were sighted less than 10% <strong>of</strong> the time<br />
(Fig. 6).<br />
Robbins et al. <strong>Assessment</strong> <strong>of</strong> <strong>shark</strong> <strong>sighting</strong> <strong>rates</strong> <strong>by</strong> <strong>aerial</strong> beach patrols<br />
>350 m<br />
>400 m<br />
>450 m<br />
>500 m
NSW DPI 17<br />
Percentage <strong>of</strong> analogues sighted + SE<br />
60<br />
50<br />
40<br />
30<br />
20<br />
10<br />
0<br />
0 m<br />
50 m<br />
100 m<br />
150 m<br />
200 m<br />
250 m<br />
300 m<br />
350 m<br />
Minimum distance from aircraft<br />
Figure 6. Percentage <strong>of</strong> validated analogue <strong>sighting</strong>s per aircraft with relative contribution <strong>of</strong><br />
different trial treatments. Open bars indicate fixed-wing data, closed bars indicate<br />
helicopter <strong>sighting</strong>s. Hashed bars indicates contribution <strong>of</strong> trials undertaken using<br />
standard methodology (cruising speed, no orbiting), non-hashed bars indicates<br />
contribution <strong>of</strong> alternative trials (orbiting permitted (fixed-wing), 100 kts airspeed<br />
(helicopter)). Contribution <strong>of</strong> each treatment type has been scaled to account for<br />
differences in sample size.<br />
Minimal differences were seen in fixed-wing <strong>sighting</strong> <strong>rates</strong> for trials where the pilots were<br />
permitted to orbit to verify <strong>sighting</strong>s, compared with non-orbiting flights (Fig. 6). In fact, more<br />
<strong>sighting</strong>s occurred on flights where circling was not permitted. Although the predisposition <strong>of</strong> the<br />
observers to expect large <strong>shark</strong>-like objects in the deployment grid may have contributed to their<br />
rapid identification, the <strong>sighting</strong> cue to perform the verification check (i.e. the decision that a<br />
submerged object is likely to be a <strong>shark</strong>) was sufficient in itself to successfully identify deployed<br />
analogues. This suggests there was no ambiguity in the identification <strong>of</strong> <strong>shark</strong> analogues during<br />
these experiments, nor any disadvantage to the fixed-wing aircrew when not permitting them to<br />
orbit suspected <strong>sighting</strong>s as per the normal routine on <strong>aerial</strong> beach patrols.<br />
Airspeed made minimal difference to the <strong>sighting</strong> ability <strong>of</strong> helicopter observers when flying<br />
within 250 m <strong>of</strong> deployed analogues (Fig. 6). However, trials conducted at the faster airspeed (100<br />
kts) failed to produce detected analogues at distances over 300 m from the helicopter flight path.<br />
Sighting <strong>rates</strong> over 300 m were however, comparable between helicopter observers flying at 60 kts<br />
and the fixed-wing observers at 100 kts once sample size was accounted for (Fig. 6). This indicates<br />
that the helicopter observers had equivalent, albeit low, capacity to detect distant analogues when<br />
their aircraft was travelling at cruising speed.<br />
<strong>Assessment</strong> <strong>of</strong> <strong>shark</strong> <strong>sighting</strong> <strong>rates</strong> <strong>by</strong> <strong>aerial</strong> beach patrols Robbins et al.<br />
400 m<br />
450 m<br />
500+ m
18 NSW DPI<br />
Observers were requested to identify the deployed analogues to body-type (white <strong>shark</strong>, tiger <strong>shark</strong><br />
or hammerhead <strong>shark</strong>) for all <strong>sighting</strong>s during the last four days <strong>of</strong> the trials. However,<br />
identifications were made for only 34% and 55% <strong>of</strong> <strong>sighting</strong>s for the fixed-wing and helicopter<br />
observers, respectively. Although the accuracy <strong>of</strong> identified analogues was relatively high (77%<br />
and 98%), the low rate <strong>of</strong> attempts meant that overall only 26% and 55% <strong>of</strong> deployments were<br />
correctly identified to ‘species’ for the fixed-wing and helicopter observers, respectively.<br />
Importantly, none <strong>of</strong> the 38 white <strong>shark</strong> or tiger <strong>shark</strong> deployments were successfully identified,<br />
with only hammerhead <strong>shark</strong> analogues correctly identified as such.<br />
Estimates <strong>of</strong> distance to the high-visibility surface <strong>shark</strong> analogues showed no correlation with the<br />
actual deployment distance for fixed-wing observers (regression analysis: n = 23, slope = 0.05,<br />
F = 0.45, p = 0.51). A significant relationship was found between the helicopter observer distance<br />
estimates and actual deployment distances (regression analysis: n = 26, slope = 0.48, F = 41.67,<br />
p < 0.001), however estimates were 52% lower than the real distances. Both aircraft maintained<br />
altitudes <strong>of</strong> 500 ft (~150 m) throughout the experiments, eliminating vertical variations as a<br />
confounding effect. Instead, it appears that reliable distance estimates are extremely difficult to<br />
obtain while travelling <strong>aerial</strong>ly at speed.<br />
The accuracy <strong>of</strong> the observers’ angle estimates was relatively high for both aircraft. There was only<br />
a 5% decrease in the number <strong>of</strong> validated analogue <strong>sighting</strong>s if the leeway was reduced to 22.5º,<br />
and 14% less <strong>sighting</strong>s if only 15º leeway was given (Fig. 7). Neither angle change significantly<br />
altered the <strong>sighting</strong> <strong>rates</strong> <strong>of</strong> either the fixed-wing (k-s tests; z = 0.426, p = 0.993; z = 0.426,<br />
p = 0.993, respectively) or helicopter observers (k-s tests; z = 0.213, p = 1.000; z = 0.426,<br />
p = 0.993, respectively).<br />
Robbins et al. <strong>Assessment</strong> <strong>of</strong> <strong>shark</strong> <strong>sighting</strong> <strong>rates</strong> <strong>by</strong> <strong>aerial</strong> beach patrols
NSW DPI 19<br />
Number <strong>of</strong> analogues sighted<br />
Number <strong>of</strong> analogues sighted<br />
80 Fixed-wing<br />
60<br />
40<br />
20<br />
0<br />
100<br />
80<br />
60<br />
40<br />
20<br />
0<br />
0 m<br />
0 m<br />
50 m<br />
Helicopter<br />
50 m<br />
100 m<br />
100 m<br />
150 m<br />
150 m<br />
200 m<br />
200 m<br />
250 m<br />
250 m<br />
300 m<br />
300 m<br />
Distance to analogue (m)<br />
350 m<br />
350 m<br />
400 m<br />
400 m<br />
450 m<br />
450 m<br />
500+ m<br />
15 deg leeway<br />
22.5 deg leeway<br />
30 deg leeway<br />
Figure 7. Number <strong>of</strong> validated <strong>shark</strong> analogue <strong>sighting</strong>s with three levels <strong>of</strong> <strong>sighting</strong> angle<br />
leeway across all trials for each aircraft (closed bars). The total number <strong>of</strong><br />
analogues deployed at each distance from the flight paths is indicated <strong>by</strong> open bars.<br />
<strong>Assessment</strong> <strong>of</strong> <strong>shark</strong> <strong>sighting</strong> <strong>rates</strong> <strong>by</strong> <strong>aerial</strong> beach patrols Robbins et al.<br />
500+ m
20 NSW DPI<br />
3.3. Environmental correlations<br />
Water clarity increased during each day <strong>of</strong> sampling, however there was no correlation with<br />
analogue <strong>sighting</strong> <strong>rates</strong> for either aircraft type (Fig. 8). The 2.5 m <strong>shark</strong> analogues were deployed in<br />
much shallower depths than those in which the 25 cm secchi disk faded out. Thus it is possible that<br />
further sampling in more turbid waters may alter this finding.<br />
Proportion <strong>of</strong> analogues seen + SE<br />
0.4<br />
0.3<br />
0.2<br />
0.1<br />
0.0<br />
1 2 3 4 5 6<br />
Day<br />
Figure 8. Proportion <strong>of</strong> validated <strong>shark</strong> analogue <strong>sighting</strong>s per aircraft per day, with secchi<br />
disk measurements overlayed. Open bars indicate fixed-wing <strong>sighting</strong>s, closed bars<br />
indicate helicopter <strong>sighting</strong>s.<br />
Environmental factors were compared with analogue <strong>sighting</strong> <strong>rates</strong> for each trial, and the results<br />
pooled <strong>by</strong> day for plotting. The <strong>sighting</strong> ability <strong>of</strong> helicopter observers was significantly correlated<br />
with sea surface conditions (Table 3, Figs. 9A & B). Higher sea states were recorded in conjunction<br />
with increased wind strengths, with a reduced proportion <strong>of</strong> analogues seen as these two<br />
environmental parameters increased. The magnitude <strong>of</strong> this relationship was stronger with respect<br />
to sea surface conditions than for actual wind speed (Table 3), however neither relationship was<br />
predictable with different proportions <strong>of</strong> analogues sighted among days with comparable wind or<br />
sea conditions (Figs. 9A & B). Correlations between environmental factors and analogue <strong>sighting</strong>s<br />
were confounded <strong>by</strong> variations in the distance at which analogues were deployed from the transect<br />
lines among trials. This no doubt increased the variability in these results. The proportion <strong>of</strong><br />
analogues sighted <strong>by</strong> the fixed-wing observers showed no significant correlation with wind and sea<br />
surface conditions (Table 3, Figs. 9A & B). This may reflect the lower overall rate <strong>of</strong> analogue<br />
<strong>sighting</strong>s <strong>by</strong> the fixed-wing observers, suggesting they had more difficulty <strong>sighting</strong> analogues, even<br />
in better sea conditions.<br />
Robbins et al. <strong>Assessment</strong> <strong>of</strong> <strong>shark</strong> <strong>sighting</strong> <strong>rates</strong> <strong>by</strong> <strong>aerial</strong> beach patrols<br />
7<br />
6<br />
5<br />
4<br />
3<br />
2<br />
1<br />
Depth secchi disk seen + SE (m)
NSW DPI 21<br />
Table 3. Regression analysis <strong>of</strong> environmental factors on fixed-wing and helicopter<br />
observer <strong>sighting</strong> <strong>rates</strong>.<br />
Aircraft Factor MS r 2<br />
F P<br />
Fixed-wing Wind speed 0.015 0.10 1.314 0.274<br />
Fixed-wing Sea state 0.015 0.09 1.283 0.278<br />
Fixed-wing Cloud cover 0.008 0.05 0.659 0.432<br />
Helicopter Wind speed 0.127 0.47 14.057 0.002<br />
Helicopter Sea state 0.175 0.64 28.723
22 NSW DPI<br />
Proportion <strong>of</strong> analogues seen + SE<br />
Proportion <strong>of</strong> analogues seen + SE<br />
Proportion <strong>of</strong> analogues seen + SE<br />
0.4<br />
0.3<br />
0.2<br />
0.1<br />
0.0<br />
0.4<br />
0.3<br />
0.2<br />
0.1<br />
0.0<br />
0.4<br />
0.3<br />
0.2<br />
0.1<br />
0.0<br />
A<br />
B<br />
C<br />
1 2 3 4 5 6<br />
Sampling day<br />
Figure 9. Proportion <strong>of</strong> validated analogue <strong>sighting</strong>s per aircraft per day, with wind, sea state<br />
and cloud cover overlayed. Open bars indicate fixed-wing <strong>sighting</strong>s, closed bars<br />
indicate helicopter <strong>sighting</strong>s. Solid lines indicate environmental parameters during<br />
fixed-wing flights, dashed lines indicate those experienced during helicopter<br />
flights.<br />
Robbins et al. <strong>Assessment</strong> <strong>of</strong> <strong>shark</strong> <strong>sighting</strong> <strong>rates</strong> <strong>by</strong> <strong>aerial</strong> beach patrols<br />
20<br />
18<br />
16<br />
14<br />
12<br />
10<br />
8<br />
6<br />
4<br />
2<br />
0<br />
3.5<br />
3.0<br />
2.5<br />
2.0<br />
1.5<br />
1.0<br />
0.5<br />
0.0<br />
120<br />
100<br />
80<br />
60<br />
40<br />
20<br />
0<br />
Estimated wind strength + SE (kts)<br />
Sea state (Beaufort scale) + SE<br />
Percentage cloud cover + SE
NSW DPI 23<br />
3.4. Coastal <strong>aerial</strong> patrols<br />
Coastal <strong>aerial</strong> patrol flights were conducted between the 22 nd Dec 2010 and 30 th Jan 2011, between<br />
0725 hr and 1456 hr. Flights were undertaken between South Wollongong and Stockton Beach,<br />
encompassing the area covered <strong>by</strong> the NSW DPI Beach Protection (Shark Meshing) Program. Due<br />
to inclement weather, the fixed-wing aircraft flew on 13 days, and the helicopter on 11 days. To<br />
allow direct comparisons, data analysis was only undertaken on the 10 shared flying days.<br />
Each aircraft flew a northwards flight first, covering the same area on their return flight. As such,<br />
the fixed-wing observers always faced east (into the sun) on the first flight <strong>of</strong> each day. However,<br />
flight direction had no effect on the number <strong>of</strong> <strong>sighting</strong>s reported <strong>by</strong> either the fixed-wing or<br />
helicopter observers (Table 4). Having risen hours earlier, it appears that the Austral summer sun<br />
was sufficiently high so as to not disadvantage the fixed-wing observers on these early morning<br />
flights.<br />
Table 4. Analysis <strong>of</strong> variance examining the effects <strong>of</strong> aircraft type and flight direction on<br />
coastal <strong>sighting</strong>s.<br />
Factor SS MS F P<br />
Aircraft 0.342 0.342 3.023 0.12<br />
Direction 0.027 0.027 0.276 0.61<br />
Aircraft x Direction 0.009 0.009 0.053 0.82<br />
There were 84 reported <strong>shark</strong> <strong>sighting</strong>s across all shared flying days (Table 5). Fixed-wing<br />
observers reported 31 <strong>shark</strong>s, while helicopter observers reported 53 <strong>shark</strong>s. The majority <strong>of</strong> <strong>shark</strong><br />
<strong>sighting</strong>s were hammerhead <strong>shark</strong>s (83%), which are not regarded as dangerous. Two individuals<br />
were thought to be whaler (carcharhinid) <strong>shark</strong>s, while the identities <strong>of</strong> the remaining 12 <strong>shark</strong>s<br />
were unknown. Because our Jervis Bay experiments showed observers were unable to identify the<br />
‘species’ <strong>of</strong> non-hammerhead silhouettes in the water, the two whaler <strong>shark</strong>s were grouped with the<br />
“unidentified” <strong>shark</strong>s for analyses. Sightings <strong>of</strong> rays (17) exceeded the number <strong>of</strong> unidentified<br />
<strong>shark</strong> <strong>sighting</strong>s, with almost 65% <strong>of</strong> ray <strong>sighting</strong>s identified as manta rays. There were 13 reports <strong>of</strong><br />
“other” <strong>sighting</strong>s, the identity <strong>of</strong> which could not be determined <strong>by</strong> observers. <strong>Reports</strong> <strong>of</strong> fish<br />
schools and dolphins far exceeded the total <strong>shark</strong> <strong>sighting</strong>s, with 149 schools and 783 individuals<br />
sighted, respectively.<br />
<strong>Assessment</strong> <strong>of</strong> <strong>shark</strong> <strong>sighting</strong> <strong>rates</strong> <strong>by</strong> <strong>aerial</strong> beach patrols Robbins et al.
24 NSW DPI<br />
Table 5. Number <strong>of</strong> reported <strong>sighting</strong>s <strong>by</strong> fixed-wing and helicopter crews during 10 days <strong>of</strong><br />
joint coastal patrols. North-bound and south-bound flights have been pooled for<br />
each day. “Other” category comprises rays and unidentified objects.<br />
Date Aircraft Total<br />
<strong>shark</strong><br />
Hammer<br />
head <strong>shark</strong><br />
Unidentified<br />
<strong>shark</strong><br />
Fish<br />
school<br />
Dolphin Other<br />
22/12/2010 Fixed-wing 0 0 0 4 4 0<br />
Helicopter 0 0 0 2 30 0<br />
25/12/2010 Fixed-wing 8 5 3 14 39 1<br />
Helicopter 1 1 0 19 67 1<br />
28/12/2010 Fixed-wing 1 0 1 1 18 0<br />
Helicopter 1 1 0 5 2 3<br />
29/12/2010 Fixed-wing 0 0 0 6 0 6<br />
Helicopter 2 2 0 15 22 3<br />
01/01/2011 Fixed-wing 16 13 3 2 14 5<br />
Helicopter 24 23 1 3 20 1<br />
05/01/2011 Fixed-wing 0 0 0 8 45 0<br />
Helicopter 5 5 0 9 65 3<br />
08/01/2011 Fixed-wing 6 2 4 5 101 0<br />
Helicopter 8 8 0 28 68 1<br />
15/01/2011 Fixed-wing 0 0 0 2 63 0<br />
Helicopter 0 0 0 2 106 0<br />
22/01/2011 Fixed-wing 0 0 0 11 47 0<br />
Helicopter 8 8 0 3 14 1<br />
29/01/2011 Fixed-wing 0 0 0 1 15 0<br />
Helicopter 4 2 2 9 43 5<br />
Total 84 70 14 149 783 30<br />
Larger groups <strong>of</strong> animals were sighted at the most frequent rate. Surface-oriented pods <strong>of</strong> dolphins<br />
were sighted most <strong>of</strong>ten, followed <strong>by</strong> fish schools (Fig. 10). Sightings <strong>of</strong> individual animals<br />
however, were extremely low. On average, a total <strong>of</strong> only 0.69 <strong>shark</strong>s were seen per 100 km flown<br />
<strong>by</strong> fixed-wing observers, and 1.18 <strong>shark</strong>s <strong>by</strong> helicopter observers covering the same area (Fig. 10).<br />
The fixed-wing observers did see three times as many unidentified <strong>shark</strong>s as the helicopter<br />
observers, although this was the lowest category <strong>of</strong> <strong>sighting</strong>s.<br />
Robbins et al. <strong>Assessment</strong> <strong>of</strong> <strong>shark</strong> <strong>sighting</strong> <strong>rates</strong> <strong>by</strong> <strong>aerial</strong> beach patrols
NSW DPI 25<br />
Number <strong>of</strong> <strong>sighting</strong>s per 100 kms + SE<br />
14<br />
12<br />
10<br />
8<br />
6<br />
4<br />
2<br />
0<br />
Total <strong>shark</strong> Hammerhead Unidentified Fish school Dolphin Other<br />
<strong>shark</strong> <strong>shark</strong><br />
Sighting category<br />
Figure 10. Reported numbers <strong>of</strong> <strong>sighting</strong>s per 100 kms during coastal patrols <strong>of</strong> NSW<br />
beaches. Open bars represent fixed-wing <strong>sighting</strong>s, closed bars represent helicopter<br />
<strong>sighting</strong>s. “Other” category comprises rays and unidentified objects.<br />
Only three <strong>of</strong> the 149 fish schools were identified as having <strong>shark</strong>s associated with them.<br />
Furthermore, on only 14 occasions were <strong>shark</strong>s recorded within two minutes flying time (~6.2 kms<br />
travelled for the fixed-wing aircraft and ~3.7 kms for the helicopter) <strong>of</strong> a fish school <strong>sighting</strong><br />
(5 fixed-wing <strong>sighting</strong>s, 9 helicopter). It is clear from these results that the presence <strong>of</strong> a fish school<br />
is not indicative <strong>of</strong> <strong>shark</strong>s present in the area.<br />
<strong>Assessment</strong> <strong>of</strong> <strong>shark</strong> <strong>sighting</strong> <strong>rates</strong> <strong>by</strong> <strong>aerial</strong> beach patrols Robbins et al.
26 NSW DPI<br />
4. DISCUSSION<br />
4.1. Aerial <strong>shark</strong> detection<br />
Aerial beach patrols are <strong>of</strong>ten presented as an effective preventative measure against <strong>shark</strong> attack.<br />
They receive considerable public support in Australia, but until now their efficacy in <strong>sighting</strong><br />
potentially dangerous <strong>shark</strong>s has not been tested. Undercounting is one <strong>of</strong> the biggest problems<br />
associated with <strong>aerial</strong> surveys, with considerable effort taken to convert the numbers <strong>of</strong> animals<br />
sighted to realistic abundance estimates (Marsh & Sinclair 1989a, Cockcr<strong>of</strong>t et al. 1992, Vrtiska &<br />
Powell 2011). Although <strong>aerial</strong> beach patrols are not formal surveys for quantifying the abundance<br />
<strong>of</strong> <strong>shark</strong>s, they are meant to successfully detect a high proportion <strong>of</strong> <strong>shark</strong>s present in the area<br />
surveyed. Operators cite themselves as having high <strong>sighting</strong> abilities, as they have “developed and<br />
proven and (sic) accurate system for predicting and monitoring the movement <strong>of</strong> dangerous <strong>shark</strong>s<br />
along our beaches” (www.surfwatchaustralia.com; accessed 03.11.2011). However, the overall<br />
<strong>sighting</strong> <strong>rates</strong> quantified in the present study <strong>of</strong> 12.5% and 17.1% for fixed-wing and helicopter<br />
observers, respectively, suggests that the actual <strong>rates</strong> <strong>of</strong> <strong>aerial</strong> <strong>shark</strong> <strong>sighting</strong>s falls well short <strong>of</strong> this<br />
claim.<br />
The size <strong>of</strong> the <strong>shark</strong> analogues used in this study (2.5 m) were the approximate size at which white<br />
<strong>shark</strong>s change their diet from teleosts to larger prey such as other <strong>shark</strong>s and mammals (Bruce<br />
1992). Sharks <strong>of</strong> this size can be a threat to humans (West 2011), thus our findings estimated the<br />
<strong>sighting</strong> ability <strong>of</strong> <strong>aerial</strong> patrols for potentially-dangerous <strong>shark</strong>s. We had expected that the greater<br />
experience <strong>of</strong> the fixed-wing aircrew would have resulted in them achieving better <strong>sighting</strong> <strong>rates</strong>,<br />
but this was not the case. Although observer experience can influence terrestrial <strong>aerial</strong> <strong>sighting</strong><br />
<strong>rates</strong> <strong>by</strong> as much as 9% (Ayers & Anderson 1999), no such advantage was apparent for the<br />
aircrews in this study. It is possible that an experience effect may have become apparent had we<br />
deployed smaller, less-visible analogues, however this was not examined due to the low (
NSW DPI 27<br />
too deep, or are in water conditions which mask their presence. Potentially dangerous species such<br />
as white <strong>shark</strong>s and tiger <strong>shark</strong>s <strong>of</strong>ten orient themselves close to the substratum when inshore<br />
(Holland et al. 1999, Bonfil et al. 2005). Considering the shallow detection depths found in this<br />
study (2.5 – 2.7 m from the water surface), such <strong>shark</strong>s may be well inshore <strong>of</strong> the surf backline<br />
before being detectable <strong>aerial</strong>ly. With inshore white <strong>shark</strong>s preferentially inhabiting water depths<br />
shallower than 15 m deep (Bruce 1992), individuals could remain undetectable to <strong>aerial</strong> surveys<br />
when in close proximity to surfers and swimmers at many <strong>of</strong> the beaches in NSW.<br />
The high rate <strong>of</strong> hammerhead <strong>sighting</strong>s found on commissioned coastal <strong>aerial</strong> beach patrols<br />
supports the hypothesis that deeper <strong>shark</strong> species are being overlooked. Hammerhead <strong>shark</strong>s<br />
comprise the largest catch <strong>of</strong> the NSW Shark Meshing (Bather Protection) Program, contributing<br />
35% <strong>of</strong> total <strong>shark</strong> catch during the last decade (Reid et al. 2011). However, they comprised 83%<br />
<strong>of</strong> <strong>shark</strong> <strong>sighting</strong>s <strong>by</strong> <strong>aerial</strong> beach patrols in this study. Hammerhead <strong>shark</strong>s spend time close to the<br />
substratum (Clarke 1971, Holland et al. 1993), although they are also found on the water surface.<br />
Hence they are represented in both the benthic <strong>shark</strong> meshing nets and <strong>aerial</strong> beach patrols. The<br />
disproportionately high abundance <strong>of</strong> hammerhead <strong>shark</strong>s in <strong>aerial</strong> patrol <strong>sighting</strong>s suggests a<br />
substantial number <strong>of</strong> other <strong>shark</strong>s (including potentially-dangerous species) are being overlooked.<br />
Indeed, even if all unspecified <strong>shark</strong>s and unidentified objects seen on this study’s <strong>aerial</strong> patrols<br />
were assumed to be non-hammerhead <strong>shark</strong>s, this still represents only 27% <strong>of</strong> <strong>sighting</strong>s (compared<br />
with non-hammerhead <strong>shark</strong>s comprising 65% <strong>of</strong> the <strong>shark</strong> catch in NSW <strong>shark</strong> meshing nets).<br />
Superficially, helicopters were more effective at <strong>sighting</strong> <strong>shark</strong>s than fixed-wing aircraft, even<br />
when using aircrew inexperienced in marine surveys. However there are a number <strong>of</strong> issues which<br />
must be considered when determining the usefulness <strong>of</strong> either aircraft for <strong>aerial</strong> beach patrols. Most<br />
importantly, neither aircrew sighted high proportions <strong>of</strong> deployed analogues, even at shallower<br />
depths than those at which potentially-dangerous <strong>shark</strong>s may inhabit (Holland et al. 1999, Bonfil et<br />
al. 2005). This is a clear concern when the purpose <strong>of</strong> these patrols is to provide a warning <strong>of</strong> <strong>shark</strong><br />
presence to the beach-going public. Identifying larger, more visible targets such as baitfish schools<br />
did not provide any correlation with <strong>shark</strong> abundance, hence their <strong>sighting</strong> cannot be used as a<br />
proxy for <strong>shark</strong>s being in the area. Distance estimates <strong>of</strong> <strong>sighting</strong>s were also highly inaccurate,<br />
making reported positions <strong>of</strong> <strong>shark</strong>s during such patrols potentially erroneous. Identification <strong>of</strong><br />
<strong>shark</strong> type was also found to be inaccurate for any <strong>shark</strong> type except hammerhead <strong>shark</strong> analogues.<br />
Although any large <strong>shark</strong> close to swimmers should be treated seriously, accurate <strong>aerial</strong><br />
identification <strong>of</strong> proximate <strong>shark</strong>s is important to allow accurate risk assessments <strong>by</strong> beach-based<br />
surf lifesavers.<br />
The current NSW fixed-wing <strong>aerial</strong> patrols survey long distances (~285 km) on their regular flights<br />
(www.<strong>aerial</strong>patrol.com.au). This, plus their average cruising speed <strong>of</strong> 100 knots, results in their<br />
ability to survey any individual beach for only a very limited period <strong>of</strong> time per day (minutes only).<br />
Although the public may feel safer knowing that aircraft are in the air, the tangible difference these<br />
flights make to an individual’s safety from <strong>shark</strong> attack at any one <strong>of</strong> these beaches is likely to be<br />
small. While the use <strong>of</strong> coastal <strong>aerial</strong> patrols can provide benefits in terms <strong>of</strong> other surveillance,<br />
such as locating vessels in distress, these benefits remain secondary to their primary task <strong>of</strong> <strong>shark</strong><br />
detection.<br />
The risk <strong>of</strong> <strong>shark</strong> attack is thought to be heightened during conditions <strong>of</strong> low visibility, such as at<br />
dawn and dusk. During these times, the low angle <strong>of</strong> the sun can increase sun glare, which can<br />
significantly reduce marine <strong>aerial</strong> <strong>sighting</strong>s (Lowry & Forney 2005). Observers in our study<br />
reported sun glare sometimes being an issue in this study, even during the middle <strong>of</strong> the day. Low<br />
sun angle also limits light penetration into the water, which is likely to further reduce the visibility<br />
<strong>of</strong> sub-surface <strong>shark</strong>s to aircraft.<br />
<strong>Assessment</strong> <strong>of</strong> <strong>shark</strong> <strong>sighting</strong> <strong>rates</strong> <strong>by</strong> <strong>aerial</strong> beach patrols Robbins et al.
28 NSW DPI<br />
In addition to favourable light levels, <strong>aerial</strong> patrols depend on suitable weather conditions to fly.<br />
Environmental conditions affected helicopter <strong>sighting</strong>s more than fixed-wing <strong>sighting</strong>s, although<br />
the helicopter observers still saw a greater proportion <strong>of</strong> deployed analogues. The dependence on<br />
favourable weather for <strong>aerial</strong> patrols can also severely affect their efficacy <strong>by</strong> reducing the number<br />
<strong>of</strong> days flown. This was particularly apparent during the summer <strong>of</strong> 2010/11 when 33% <strong>of</strong><br />
scheduled flights were cancelled due to inclement weather conditions. Such environmental<br />
conditions are unlikely to reduce predatory <strong>shark</strong> behaviours, although inclement weather may<br />
coincide with a reduced number <strong>of</strong> beach users. If however, environmental conditions such as fog<br />
lift during the course <strong>of</strong> the day, this may result in perfect beach weather yet <strong>aerial</strong> observers will<br />
not have flown.<br />
4.2. Alternatives to <strong>aerial</strong> beach patrols<br />
Arguably the best alternative to <strong>aerial</strong> beach patrols is to bolster existing beach surveillance<br />
programs. Alongside the NSW Shark Meshing (Bather Protection) Program, the primary NSW<br />
beach safety programs are operated <strong>by</strong> members <strong>of</strong> the Australian Lifeguard Service and Surf Life<br />
Saving Australia. Collectively they patrol hundreds <strong>of</strong> NSW beaches each year, performing<br />
thousands <strong>of</strong> rescues per year (Anon 2010a). An alternative option to increase bather safety may<br />
therefore be to increase funding to such organisations to assist with equipment such as observation<br />
towers, binoculars and jet skis to investigate and deter <strong>shark</strong>s sighted <strong>by</strong> patrolling staff and<br />
beachgoers.<br />
The utility <strong>of</strong> lifeguards in <strong>sighting</strong> <strong>shark</strong>s has been demonstrated internationally with <strong>shark</strong>s<br />
identified up to 300 m <strong>of</strong>fshore <strong>by</strong> lifeguards atop 3 m beach towers around Oahu, Hawaii (Parrish<br />
& Goto 1997). Similarly, a very successful <strong>shark</strong> detection program has been developed in Cape<br />
Town to sight and immediately report the presence <strong>of</strong> potentially dangerous <strong>shark</strong>s approaching<br />
local beaches (Kock et al. 2012). The “Shark Spotters” program uses trained observers on<br />
vertically-elevated structures such as surrounding cliffs and buildings to alert the public when a<br />
<strong>shark</strong> is seen. The higher elevation increases <strong>sighting</strong> <strong>rates</strong>, and the observers can also give the “all<br />
clear” signal once the <strong>shark</strong> has left the area (Kock et al. 2012). With nearly 40 coastal drownings<br />
per year in NSW, compared with 2 <strong>shark</strong> fatalities over the last 35 years (Green et al. 2009, Anon<br />
2010a), directing funding towards existing lifesaving programs may ultimately reduce fatalities<br />
from both sources. Increased funding for such organisations will further assist with the treatment <strong>of</strong><br />
non <strong>shark</strong>-related injuries and medical emergencies on beaches, neither <strong>of</strong> which can be aided <strong>by</strong><br />
<strong>aerial</strong> beach patrols.<br />
Within NSW, expansion <strong>of</strong> the existing State Government <strong>shark</strong> awareness program, Shark Smart<br />
(www.dpi.nsw.gov.au/fisheries/info/<strong>shark</strong>smart) should also be given a high priority. This program<br />
provides beachgoers with information such as the times <strong>of</strong> day, types <strong>of</strong> habitat, weather conditions<br />
etc. which can increase risk from <strong>shark</strong> attack. Although primarily a web-based information site,<br />
information packages could be distributed <strong>by</strong> NSW lifesavers and life guards, surf shops and tourist<br />
information centres. Aiding this program would be preferable to alternatives such as erecting <strong>shark</strong><br />
advisory signs on NSW beaches as no NSW beach is an acknowledged ‘hotspot’ for <strong>shark</strong> attack<br />
(Green et al. 2009), thus any signage would rapidly lose impact with a gradual waning <strong>of</strong> public<br />
awareness.<br />
Robbins et al. <strong>Assessment</strong> <strong>of</strong> <strong>shark</strong> <strong>sighting</strong> <strong>rates</strong> <strong>by</strong> <strong>aerial</strong> beach patrols
NSW DPI 29<br />
4.3. Conclusion<br />
Severe limitations were found in the ability <strong>of</strong> <strong>aerial</strong> observers in fixed-wing planes and helicopters<br />
to sight <strong>shark</strong> analogues, both in terms <strong>of</strong> depth and distance from the aircraft. Although it is<br />
acknowledged that <strong>aerial</strong> patrols will detect some coastal <strong>shark</strong>s, the <strong>rates</strong> <strong>of</strong> such detections are<br />
inconsistent with that required for an effective early detection system. Overall, the results from<br />
these experiments suggest that <strong>aerial</strong> patrols are extremely limited in detecting <strong>shark</strong>s in coastal<br />
NSW waters, while giving the public an inflated sense <strong>of</strong> protection against <strong>shark</strong> attack.<br />
<strong>Assessment</strong> <strong>of</strong> <strong>shark</strong> <strong>sighting</strong> <strong>rates</strong> <strong>by</strong> <strong>aerial</strong> beach patrols Robbins et al.
30 NSW DPI<br />
5. REFERENCES<br />
Anderson CR, Lindzey FG (1996) Moose sightability model developed from helicopter surveys.<br />
Wildl Soc Bull 24:247–259.<br />
Anon (2006) Proceedings <strong>of</strong> the Scientific Shark Protection Summit, 10 April 2006, hosted <strong>by</strong> DPI<br />
and the Sydney Aquarium at the Medina Grand Harbourside Hotel. NSW Department <strong>of</strong><br />
Primary Industries. 104 pp.<br />
Anon (2010a) Preventing coastal drowning deaths in Australia. 2010 National Coastal Safety<br />
Report., Surf Life Saving Australia. 21 pp.<br />
Anon (2010b) Shark Meshing (Bather Protection) Program 2009-10. Annual performance report.<br />
Industry & Investment NSW. 58 pp.<br />
Ayers LW, Anderson SH (1999) An <strong>aerial</strong> sightability model for estimating ferruginous hawk<br />
population size. J Wildl Manage 63:85–97.<br />
Barlow J, Oliver CW, Jackson TD, Taylor BL (1988) Harbor porpoise, Phocoena phocoena,<br />
abundance estimation for California, Oregon, and Washington: II. Aerial surveys. Fish<br />
Bull 86:433–444.<br />
Blackweir DG, Beckley LE (2004) Beach usage patterns along the Perth metropolitan coastline<br />
during <strong>shark</strong> surveillance flights in summer 2003/04. Report <strong>by</strong> the School <strong>of</strong><br />
Environmental Science, Murdoch University. 122 pp.<br />
Bodkin JL, Udevitz MS (1999) An <strong>aerial</strong> survey method to estimate sea otter abundance. In:<br />
Garner GW, Amstrup SC, Laake JL, Manly BFJ, McDonald LL, Robertson DG (eds)<br />
Marine Mammal Survey and <strong>Assessment</strong> Methods. A.A. Balkema, Rotterdam,<br />
Netherlands. p 13–26.<br />
Bonfil R, Meyer M, Scholl MC, Johnson R, O’Brien S, Oosthuizen H, Swanson S, Kotze D,<br />
Paterson M (2005) Transoceanic migration, spatial dynamics, and population linkages <strong>of</strong><br />
white <strong>shark</strong>s. Science 310:100–103.<br />
Bruce BD (1992) Preliminary observations on the biology <strong>of</strong> the White Shark, Carcharodon<br />
carcharias, in South Australian waters. Mar Freshw Res 43:1–11.<br />
Burks CM, Driggers III WB, Mullin KD (2005) Abundance and distribution <strong>of</strong> whale <strong>shark</strong>s<br />
(Rhinocodon typus) in the northern Gulf <strong>of</strong> Mexico. Fish Bull 104:579–584.<br />
Cairns SC, Lollback GW, Payne N (2008) Design <strong>of</strong> <strong>aerial</strong> surveys for population estimation and<br />
the management <strong>of</strong> macropods in the Northern Tablelands <strong>of</strong> New South Wales,<br />
Australia. Wildl Res 35:331–339.<br />
Cardona L, Revelles M, Carreras C, San Felix M, Gazo M, Aguilar A (2005) Western<br />
Mediterranean immature loggerhead turtles: Habitat use in spring and summer assessed<br />
through satellite tracking and <strong>aerial</strong> surveys. Mar Biol 147:583–591.<br />
Chapman DD, Pikitch EK, Babcock EA, Shivji MS (2007) Deep-diving and diel changes in<br />
vertical habitat use <strong>by</strong> Caribbean reef <strong>shark</strong>s Carcharhinus perezi. Mar Ecol Prog Ser<br />
344:271–275.<br />
Robbins et al. <strong>Assessment</strong> <strong>of</strong> <strong>shark</strong> <strong>sighting</strong> <strong>rates</strong> <strong>by</strong> <strong>aerial</strong> beach patrols
NSW DPI 31<br />
Clark CW, Brown MW, Corkeron P (2010) Visual and acoustic surveys for North Atlantic right<br />
whales, Eubalaena glacialis, in Cape Cod Bay, Massachusetts, 2001 – 2005:<br />
Management implications. Mar Mamm Sci 26:837–854.<br />
Clarke TA (1971) The ecology <strong>of</strong> the scalloped hammerhead <strong>shark</strong>, Sphyrna lewini in Hawaii. Pac<br />
Sci 25:133–144.<br />
Cliff G, Anderson-Reade MD, Aitken AP, Charter GE, Peddemors VM (2007) Aerial census <strong>of</strong><br />
whale <strong>shark</strong>s (Rhincodon typus) on the northern KwaZulu-Natal coast, South Africa. Fish<br />
Res 84:41–46.<br />
Cockcr<strong>of</strong>t VG, Ross GJB, Peddemors VM, Borchers DL (1992) Estimates <strong>of</strong> abundance and<br />
undercounting <strong>of</strong> bottlenose dolphins <strong>of</strong>f northern Natal, South Africa. S Afr J Wildl Res<br />
22:102–109.<br />
Cunningham L, Baxter JM, Boyd IL (2010) Variation in harbour seal counts obtained using <strong>aerial</strong><br />
surveys. J Mar Biol Ass UK 90:1659–1666.<br />
Dawson MJ, Miller C (2008) Aerial mark-recapture estimates <strong>of</strong> wild horses using natural<br />
markings. Wildl Res 35:365–370.<br />
Freddy DJ, White GC, Kneeland MC, Kahn RH, Unsworth JW, deVergie WJ, Graham VK,<br />
Ellenberger JR, Wagner CH (2004) How many mule deer are there? Challenges <strong>of</strong><br />
credibility in Colorado. Wildl Soc Bull 32:916–927.<br />
Gales N, McCauley RD, Lanyon J, Holley D (2004) Change in abundance <strong>of</strong> dugongs in Shark<br />
Bay, Ningaloo and Exmouth Gulf, Western Australia: Evidence for large-scale migration.<br />
Wildl Res 31:283–290.<br />
Gilbert BA, Moeller BJ (2008) Modeling elk sightability bias <strong>of</strong> <strong>aerial</strong> surveys during winter in the<br />
central Cascades. Northwest Sci 82:222–228.<br />
Graham A, Bell R (1989) Investigating observer bias in <strong>aerial</strong> survey <strong>by</strong> simultaneous doublecounts.<br />
J Wildl Manage 53:1009–1016.<br />
Green M, Ganassin C, Reid DD (2009) Report into the NSW <strong>shark</strong> meshing (bather protection)<br />
program. NSW Department <strong>of</strong> Primary Industries. 134 pp.<br />
Gruber SH, Nelson DR, Morrissey JF (1988) Patterns <strong>of</strong> activity and space utilization <strong>of</strong> lemon<br />
<strong>shark</strong>s, Negaprion brevirostris, in a shallow Bahamian lagoon. Bull Mar Sci 43:61–76.<br />
Harvey-Clark CJ, Stobo WT, Helle E, Mattson M (1999) Putative mating behavior in basking<br />
<strong>shark</strong>s <strong>of</strong>f the Nova Scotia coast. Copeia 1999:780–782.<br />
Holland KN, Wetherbee BM, Lowe CG, Meyer CG (1999) Movements <strong>of</strong> tiger <strong>shark</strong>s (Galeocerdo<br />
cuvier) in coastal Hawaiian waters. Mar Biol 134:665–673.<br />
Holland KN, Wetherbee BM, Peterson JD, Lowe CG (1993) Movements and distribution <strong>of</strong><br />
hammerhead <strong>shark</strong> pups on their natal grounds. Copeia 1993:495–502.<br />
Hone J, Short J (1988) A note on the sightability <strong>of</strong> emus during an <strong>aerial</strong> survey. Aust Wildl Res<br />
15:647–649.<br />
Kenney RD, Owen RE, Winn HE (1985) Shark distributions <strong>of</strong>f the Northeast United States from<br />
marine mammal surveys. Copeia 1985:220–223.<br />
<strong>Assessment</strong> <strong>of</strong> <strong>shark</strong> <strong>sighting</strong> <strong>rates</strong> <strong>by</strong> <strong>aerial</strong> beach patrols Robbins et al.
32 NSW DPI<br />
Kock AA, Titley S, Petersen W, Sikweyiya M, Tsotsobe S, Colenbrander D, Gold H, Oel<strong>of</strong>se G<br />
(2012) Shark Spotters: A pioneering <strong>shark</strong> safety programme in Cape Town, South<br />
Africa. In: Domeier ML (ed) Global perspectives on the biology and life history <strong>of</strong> the<br />
great white <strong>shark</strong>. CRC Press, p 447–466.<br />
Krueger B, Bender LC, Gould WR, Morrow PC (2007) A fixed-wing sightability model for oryx in<br />
desert habitats. S Afr J Wildl Res 37:133–142.<br />
Lowry MS, Forney KA (2005) Abundance and distribution <strong>of</strong> California sea lions (Zalophus<br />
californianus) in central and northern California during 1998 and summer 1999. Fish Bull<br />
103:331–343.<br />
Marsh H, Sinclair DF (1989a) Correcting for visibility bias in strip transect <strong>aerial</strong> surveys <strong>of</strong><br />
aquatic fauna. J Wildl Manage 53:1017–1024.<br />
Marsh H, Sinclair DF (1989b) An experimental evaluation <strong>of</strong> dugong and sea turtle <strong>aerial</strong> survey<br />
techniques. Aust Wildl Res 16:639–650.<br />
McIntosh TE, Rosatte RC, Hamr J, Murray DL (2009) Development <strong>of</strong> a sightability model for<br />
low-density elk populations in Ontario, Canada. J Wildl Manage 73:580–585.<br />
Motta PJ, Maslanka M, Hueter RE, Davis RL, de la Parra R, Mulvany SL, Habegger ML, Strother<br />
JA, Mara KR, Gardiner JM, Tyminski JP, Zeigler LD (2010) Feeding anatomy, filterfeeding<br />
rate, and diet <strong>of</strong> whale <strong>shark</strong>s Rhincodon typus during surface ram filter feeding<br />
<strong>of</strong>f the Yucatan Peninsula, Mexico. Zoology 113:199–212.<br />
Nakamura I, Watanabe YY, Papastamatiou YP, Sato K, Meyer CG (2011) Yo-yo vertical<br />
movements suggest a foraging strategy for tiger <strong>shark</strong>s Galeocerdo cuvier. Mar Ecol Prog<br />
Ser 424:237–246.<br />
Nakano H, Matsunaga H, Okamoto H, Okazaki M (2003) Acoustic tracking <strong>of</strong> bigeye thresher<br />
<strong>shark</strong> Alopias superciliosus in the eastern Pacific Ocean. Mar Ecol Prog Ser 265:255–<br />
261.<br />
O’Donoghue SH, Drapeau L, Peddemors VM (2010) Broad-scale distribution patterns <strong>of</strong> sardine<br />
and their predators in relation to remotely sensed environmental conditions during the<br />
KwaZulu-Natal sardine run. Afr J Mar Sci 32:279–291.<br />
Parker G, Sundaresan S, Chege G, O'Brien T (2011) Using sample <strong>aerial</strong> surveys to estimate the<br />
abundance <strong>of</strong> the endangered Grevy's zebra in northern Kenya. Afr J Ecol 49:56–61.<br />
Parrish FA, Goto RS (1997) Patterns <strong>of</strong> insular <strong>shark</strong> dynamics based on fishery <strong>by</strong>catch and<br />
lifeguard surveillance at Oahu, Hawaii, 1983 – 1992. Bull Mar Sci 61:763–777.<br />
Pollock KH, Marsh HD, Lawler IR, Alldredge MW (2006) Estimating animal abundance in<br />
heterogeneous environments: An application to <strong>aerial</strong> surveys for dugongs. J Wildl<br />
Manage 70:255–262.<br />
Reid DD, Robbins WD, Peddemors VM (2011) Decadal trends in <strong>shark</strong> catches and effort from the<br />
New South Wales, Australia Shark Meshing Program 1950 to 2010. Mar Freshw Res<br />
62:676–693.<br />
Rice CG, Jenkins KJ, Chang WY (2009) A sightability model for mountain goats. J Wildl Manage<br />
73:468–478.<br />
Ross GJB, Cockcr<strong>of</strong>t VG, Melton DA, Butterworth DS (1989) Population estimates for bottlenose<br />
dolphins Tursiops truncatus in Natal and Transkei waters. S Afr J Mar Sci 8:119–129.<br />
Robbins et al. <strong>Assessment</strong> <strong>of</strong> <strong>shark</strong> <strong>sighting</strong> <strong>rates</strong> <strong>by</strong> <strong>aerial</strong> beach patrols
NSW DPI 33<br />
Rowat D, Gore M, Meekan MG, Lawler IR, Bradshaw CJA (2009) Aerial survey as a tool to<br />
estimate whale <strong>shark</strong> abundance trends. J Exp Mar Biol Ecol 368:1–8.<br />
Southwell C, Paxton CGM, Borchers DL (2008) Detectability <strong>of</strong> penguins in <strong>aerial</strong> surveys over<br />
the pack-ice <strong>of</strong>f Antarctica. Wildl Res 35:349–357.<br />
Sundstrom LF, Gruber SH (1998) Using speed-sensing transmitters to construct a bioenergetics<br />
model for subadult lemon <strong>shark</strong>s, Negaprion brevirostris (Poey), in the field.<br />
Hydrobiologia 372:241–247.<br />
Vrtiska MP, Powell LA (2011) Estimates <strong>of</strong> duck breeding populations in the Nebraska dandhills<br />
using double observer methodology. Waterbirds 34:96–101.<br />
West J (2011) Changing patterns <strong>of</strong> <strong>shark</strong> attacks in Australian waters. Mar Freshw Res 62:744–<br />
754.<br />
Wilson SG (2004) Basking <strong>shark</strong>s (Cetorhinus maximus) schooling in the southern Gulf <strong>of</strong> Maine.<br />
Fish Oceanogr 13:283–286.<br />
Zar JH (1996) Biostatistical analysis. Third edition., Vol. Prentice-Hall, Inc., New Jersey<br />
<strong>Assessment</strong> <strong>of</strong> <strong>shark</strong> <strong>sighting</strong> <strong>rates</strong> <strong>by</strong> <strong>aerial</strong> beach patrols Robbins et al.
34 NSW DPI<br />
Other titles in this series:<br />
ISSN 1440-3544 (NSW <strong>Fisheries</strong> Final Report Series)<br />
No. 1 Andrew, N.L., Graham, K.J., Hodgson, K.E. and Gordon, G.N.G., 1998. Changes after 20 years in relative<br />
abundance and size composition <strong>of</strong> commercial fishes caught during fishery independent surveys on SEF<br />
trawl grounds.<br />
No. 2 Virgona, J.L., Deguara, K.L., Sullings, D.J., Halliday, I. and Kelly, K., 1998. <strong>Assessment</strong> <strong>of</strong> the stocks <strong>of</strong> sea<br />
mullet in New South Wales and Queensland waters.<br />
No. 3 Stewart, J., Ferrell, D.J. and Andrew, N.L., 1998. Ageing Yellowtail (Trachurus novaezelandiae) and Blue<br />
Mackerel (Scomber australasicus) in New South Wales.<br />
No. 4 Pethebridge, R., Lugg, A. and Harris, J., 1998. Obstructions to fish passage in New South Wales South Coast<br />
streams. 70pp.<br />
No. 5 Kennelly, S.J. and Broadhurst, M.K., 1998. Development <strong>of</strong> <strong>by</strong>-catch reducing prawn-trawls and fishing<br />
practices in NSW's prawn-trawl fisheries (and incorporating an assessment <strong>of</strong> the effect <strong>of</strong> increasing mesh<br />
size in fish trawl gear). 18pp + appendices.<br />
No. 6 Allan, G.L. and Rowland, S.J., 1998. Fish meal replacement in aquaculture feeds for silver perch. 237pp +<br />
appendices.<br />
No. 7 Allan, G.L., 1998. Fish meal replacement in aquaculture feeds: subprogram administration. 54pp +<br />
appendices.<br />
No. 8 Heasman, M.P., O'Connor, W.A. and O'Connor, S.J., 1998. Enhancement and farming <strong>of</strong> scallops in NSW<br />
using hatchery produced seedstock. 146pp.<br />
No. 9 Nell, J.A., McMahon, G.A. and Hand, R.E., 1998. Tetraploidy induction in Sydney rock oysters. 25pp.<br />
No. 10 Nell, J.A. and Maguire, G.B., 1998. Commercialisation <strong>of</strong> triploid Sydney rock and Pacific oysters. Part 1:<br />
Sydney rock oysters. 122pp.<br />
No. 11 Watford, F.A. and Williams, R.J., 1998. Inventory <strong>of</strong> estuarine vegetation in Botany Bay, with special<br />
reference to changes in the distribution <strong>of</strong> seagrass. 51pp.<br />
No. 12 Andrew, N.L., Worthington D.G., Brett, P.A. and Bentley N., 1998. Interactions between the abalone fishery<br />
and sea urchins in New South Wales.<br />
No. 13 Jackson, K.L. and Ogburn, D.M., 1999. Review <strong>of</strong> depuration and its role in shellfish quality assurance. 77pp.<br />
No. 14 Fielder, D.S., Bardsley, W.J. and Allan, G.L., 1999. Enhancement <strong>of</strong> Mulloway (Argyrosomus japonicus) in<br />
intermittently opening lagoons. 50pp + appendices.<br />
No. 15 Otway, N.M. and Macbeth, W.G., 1999. The physical effects <strong>of</strong> hauling on seagrass beds. 86pp.<br />
No. 16 Gibbs, P., McVea, T. and Louden, B., 1999. Utilisation <strong>of</strong> restored wetlands <strong>by</strong> fish and inverteb<strong>rates</strong>. 142pp.<br />
No. 17 Ogburn, D. and Ruello, N., 1999. Waterpro<strong>of</strong> labelling and identification systems suitable for shellfish and<br />
other seafood and aquaculture products. Whose oyster is that? 50pp.<br />
No. 18 Gray, C.A., Pease, B.C., Stringfellow, S.L., Raines, L.P. and Walford, T.R., 2000. Sampling estuarine fish<br />
species for stock assessment. Includes appendices <strong>by</strong> D.J. Ferrell, B.C. Pease, T.R. Walford, G.N.G. Gordon,<br />
C.A. Gray and G.W. Liggins. 194pp.<br />
No. 19 Otway, N.M. and Parker, P.C., 2000. The biology, ecology, distribution, abundance and identification <strong>of</strong><br />
marine protected areas for the conservation <strong>of</strong> threatened Grey Nurse Sharks in south east Australian waters.<br />
101pp.<br />
No. 20 Allan, G.L. and Rowland, S.J., 2000. Consumer sensory evaluation <strong>of</strong> silver perch cultured in ponds on meat<br />
meal based diets. 21pp + appendices.<br />
No. 21 Kennelly, S.J. and Scandol, J. P., 2000. Relative abundances <strong>of</strong> spanner crabs and the development <strong>of</strong> a<br />
population model for managing the NSW spanner crab fishery. 43pp + appendices.<br />
No. 22 Williams, R.J., Watford, F.A. and Balashov, V., 2000. Kooragang Wetland Rehabilitation Project: History <strong>of</strong><br />
changes to estuarine wetlands <strong>of</strong> the lower Hunter River. 82pp.<br />
No. 23 Survey Development Working Group, 2000. Development <strong>of</strong> the National Recreational and Indigenous<br />
Fishing Survey. Final Report to <strong>Fisheries</strong> Research and Development Corporation. (Volume 1 – 36pp +<br />
Volume 2 – attachments).<br />
No.24 Rowling, K.R and Raines, L.P., 2000. Description <strong>of</strong> the biology and an assessment <strong>of</strong> the fishery <strong>of</strong> Silver<br />
Trevally Pseudocaranx dentex <strong>of</strong>f New South Wales. 69pp.<br />
No. 25 Allan, G.L., Jantrarotai, W., Rowland, S., Kosuturak, P. and Booth, M., 2000. Replacing fishmeal in<br />
aquaculture diets. 13pp.<br />
No. 26 Gehrke, P.C., Gilligan, D.M. and Barwick, M., 2001. Fish communities and migration in the Shoalhaven<br />
River – Before construction <strong>of</strong> a fishway. 126pp.<br />
Robbins et al. <strong>Assessment</strong> <strong>of</strong> <strong>shark</strong> <strong>sighting</strong> <strong>rates</strong> <strong>by</strong> <strong>aerial</strong> beach patrols
NSW DPI 35<br />
No. 27 Rowling, K.R. and Makin, D.L., 2001. Monitoring <strong>of</strong> the fishery for Gemfish Rexea solandri, 1996 to 2000.<br />
44pp.<br />
No. 28 Otway, N.M., 1999. Identification <strong>of</strong> candidate sites for declaration <strong>of</strong> aquatic reserves for the conservation <strong>of</strong><br />
rocky intertidal communities in the Hawkesbury Shelf and Batemans Shelf Bioregions. 88pp.<br />
No. 29 Heasman, M.P., Goard, L., Diemar, J. and Callinan, R., 2000. Improved Early Survival <strong>of</strong> Molluscs: Sydney<br />
Rock Oyster (Saccostrea glomerata). 63pp.<br />
No. 30 Allan, G.L., Dignam, A and Fielder, S., 2001. Developing Commercial Inland Saline Aquaculture in<br />
Australia: Part 1. R&D Plan.<br />
No. 31 Allan, G.L., Banens, B. and Fielder, S., 2001. Developing Commercial Inland Saline Aquaculture in<br />
Australia: Part 2. Resource Inventory and <strong>Assessment</strong>. 33pp.<br />
No. 32 Bruce, A., Growns, I. and Gehrke, P., 2001. Woronora River Macquarie Perch Survey. 116pp.<br />
No. 33 Morris, S.A., Pollard, D.A., Gehrke, P.C. and Pogonoski, J.J., 2001. Threatened and Potentially Threatened<br />
Freshwater Fishes <strong>of</strong> Coastal New South Wales and the Murray-Darling Basin. 177pp.<br />
No. 34 Heasman, M.P., Sushames, T.M., Diemar, J.A., O’Connor, W.A. and Foulkes, L.A., 2001. Production <strong>of</strong><br />
Micro-algal Concent<strong>rates</strong> for Aquaculture Part 2: Development and Evaluation <strong>of</strong> Harvesting, Preservation,<br />
Storage and Feeding Technology. 150pp + appendices.<br />
No. 35 Stewart, J. and Ferrell, D.J., 2001. Mesh selectivity in the NSW demersal trap fishery. 86pp.<br />
No. 36 Stewart, J., Ferrell, D.J., van der Walt, B., Johnson, D. and Lowry, M., 2001. <strong>Assessment</strong> <strong>of</strong> length and age<br />
composition <strong>of</strong> commercial kingfish landings. 49pp.<br />
No. 37 Gray, C.A. and Kennelly, S.J., 2001. Development <strong>of</strong> discard-reducing gears and practices in the estuarine<br />
prawn and fish haul fisheries <strong>of</strong> NSW. 151pp.<br />
No. 38 Murphy, J.J., Lowry, M.B., Henry, G.W. and Chapman, D., 2002. The Gamefish Tournament Monitoring<br />
Program – 1993 to 2000. 93pp.<br />
No. 39 Kennelly, S.J. and McVea, T.A. (Ed), 2002. Scientific reports on the recovery <strong>of</strong> the Richmond and Macleay<br />
Rivers following fish kills in February and March 2001. 325pp.<br />
No. 40 Pollard, D.A. and Pethebridge, R.L., 2002. Report on Port <strong>of</strong> Botany Bay Introduced Marine Pest Species<br />
Survey. 69pp.<br />
No. 41 Pollard, D.A. and Pethebridge, R.L., 2002. Report on Port Kembla Introduced Marine Pest Species Survey.<br />
72pp.<br />
No. 42 O’Connor, W.A, Lawler, N.F. and Heasman, M.P., 2003. Trial farming the akoya pearl oyster, Pinctada<br />
imbricata, in Port Stephens, NSW. 170pp.<br />
No. 43 Fielder, D.S. and Allan, G.L., 2003. Improving fingerling production and evaluating inland saline water<br />
culture <strong>of</strong> snapper, Pagrus auratus. 62pp.<br />
No. 44 Astles, K.L., Winstanley, R.K., Harris, J.H. and Gehrke, P.C., 2003. Experimental study <strong>of</strong> the effects <strong>of</strong> cold<br />
water pollution on native fish. 55pp.<br />
No. 45 Gilligan, D.M., Harris, J.H. and Mallen-Cooper, M., 2003. Monitoring changes in the Crawford River fish<br />
community following replacement <strong>of</strong> an effective fishway with a vertical-slot fishway design: Results <strong>of</strong> an<br />
eight year monitoring program. 80pp.<br />
No. 46 Pollard, D.A. and Rankin, B.K., 2003. Port <strong>of</strong> Eden Introduced Marine Pest Species Survey. 67pp.<br />
No. 47 Otway, N.M., Burke, A.L., Morrison, NS. and Parker, P.C., 2003. Monitoring and identification <strong>of</strong> NSW<br />
Critical Habitat Sites for conservation <strong>of</strong> Grey Nurse Sharks. 62pp.<br />
No. 48 Henry, G.W. and Lyle, J.M. (Ed), 2003. The National Recreational and Indigenous Fishing Survey. 188 pp.<br />
No. 49 Nell, J.A., 2003. Selective breeding for disease resistance and fast growth in Sydney rock oysters. 44pp. (Also<br />
available – a CD-Rom published in March 2004 containing a collection <strong>of</strong> selected manuscripts published<br />
over the last decade in peer-reviewed journals).<br />
No. 50 Gilligan, D. and Schiller, S., 2003. Downstream transport <strong>of</strong> larval and juvenile fish. 66pp.<br />
No. 51 Liggins, G.W., Scandol, J.P. and Kennelly, S.J., 2003. Recruitment <strong>of</strong> Population Dynamacist. 44pp.<br />
No. 52 Steffe, A.S. and Chapman, J.P., 2003. A survey <strong>of</strong> daytime recreational fishing during the annual period,<br />
March 1999 to February 2000, in Lake Macquarie, New South Wales. 124pp.<br />
No. 53 Barker, D. and Otway, N., 2003. Environmental assessment <strong>of</strong> zinc coated wire mesh sea cages in Botany<br />
Bay NSW. 36pp.<br />
No. 54 Growns, I., Astles, A. and Gehrke, P., 2003. Spatial and temporal variation in composition <strong>of</strong> riverine fish<br />
communities. 24pp.<br />
No. 55 Gray, C. A., Johnson, D.D., Young, D.J. and Broadhurst, M. K., 2003. Bycatch assessment <strong>of</strong> the Estuarine<br />
Commercial Gill Net Fishery in NSW. 58pp.<br />
<strong>Assessment</strong> <strong>of</strong> <strong>shark</strong> <strong>sighting</strong> <strong>rates</strong> <strong>by</strong> <strong>aerial</strong> beach patrols Robbins et al.
36 NSW DPI<br />
No. 56 Worthington, D.G. and Blount, C., 2003. Research to develop and manage the sea urchin fisheries <strong>of</strong> NSW<br />
and eastern Victoria. 182pp.<br />
No. 57 Baumgartner, L.J., 2003. Fish passage through a Deelder lock on the Murrumbidgee River, Australia. 34pp.<br />
No. 58 Allan, G.L., Booth, M.A., David A.J. Stone, D.A.J. and Anderson, A.J., 2004. Aquaculture Diet Development<br />
Subprogram: Ingredient Evaluation. 171pp.<br />
No. 59 Smith, D.M., Allan, G.L. and Booth, M.A., 2004. Aquaculture Diet Development Subprogram: Nutrient<br />
Requirements <strong>of</strong> Aquaculture Species. 220pp.<br />
No. 60 Barlow, C.G., Allan, G.L., Williams, K.C., Rowland, S.J. and Smith, D.M., 2004. Aquaculture Diet<br />
Development Subprogram: Diet Validation and Feeding Strategies. 197pp.<br />
No. 61 Heasman, M.H., 2004. Sydney Rock Oyster Hatchery Workshop 8 – 9 August 2002, Port Stephens, NSW.<br />
115pp.<br />
No. 62 Heasman, M., Chick, R., Savva, N., Worthington, D., Brand, C., Gibson, P. and Diemar, J., 2004.<br />
Enhancement <strong>of</strong> populations <strong>of</strong> abalone in NSW using hatchery-produced seed. 269pp.<br />
No. 63 Otway, N.M. and Burke, A.L., 2004. Mark-recapture population estimate and movements <strong>of</strong> Grey Nurse<br />
Sharks. 53pp.<br />
No. 64 Creese, R.G., Davis, A.R. and Glas<strong>by</strong>, T.M., 2004. Eradicating and preventing the spread <strong>of</strong> the invasive alga<br />
Caulerpa taxifolia in NSW. 110pp.<br />
No. 65 Baumgartner, L.J., 2004. The effects <strong>of</strong> Balranald Weir on spatial and temporal distributions <strong>of</strong> lower<br />
Murrumbidgee River fish assemblages. 30pp.<br />
No. 66 Heasman, M., Diggles, B.K., Hurwood, D., Mather, P., Pirozzi, I. and Dworjanyn, S., 2004. Paving the way<br />
for continued rapid development <strong>of</strong> the flat (angasi) oyster (Ostrea angasi) farming in New South Wales.<br />
40pp.<br />
ISSN 1449-9967 (NSW Department <strong>of</strong> Primary Industries – <strong>Fisheries</strong> Final Report Series)<br />
No. 67 Kroon, F.J., Bruce, A.M., Housefield, G.P. and Creese, R.G., 2004. Coastal floodplain management in eastern<br />
Australia: barriers to fish and invertebrate recruitment in acid sulphate soil catchments. 212pp.<br />
No. 68 Walsh, S., Copeland, C. and Westlake, M., 2004. Major fish kills in the northern rivers <strong>of</strong> NSW in 2001:<br />
Causes, Impacts & Responses. 55pp.<br />
No. 69 Pease, B.C. (Ed), 2004. Description <strong>of</strong> the biology and an assessment <strong>of</strong> the fishery for adult longfinned eels<br />
in NSW. 168pp.<br />
No. 70 West, G., Williams, R.J. and Laird, R., 2004. Distribution <strong>of</strong> estuarine vegetation in the Parramatta River and<br />
Sydney Harbour, 2000. 37pp.<br />
No. 71 Broadhurst, M.K., Macbeth, W.G. and Wooden, M.E.L., 2005. Reducing the discarding <strong>of</strong> small prawns in<br />
NSW's commercial and recreational prawn fisheries. 202pp.<br />
No. 72. Graham, K.J., Lowry, M.B. and Walford, T.R., 2005. Carp in NSW: <strong>Assessment</strong> <strong>of</strong> distribution, fishery and<br />
fishing methods. 88pp.<br />
No. 73 Stewart, J., Hughes, J.M., Gray, C.A. and Walsh, C., 2005. Life history, reproductive biology, habitat use and<br />
fishery status <strong>of</strong> eastern sea garfish (Hyporhamphus australis) and river garfish (H. regularis ardelio) in<br />
NSW waters. 180pp.<br />
No. 74 Growns, I. and Gehrke, P., 2005. Integrated Monitoring <strong>of</strong> Environmental Flows: <strong>Assessment</strong> <strong>of</strong> predictive<br />
modelling for river flows and fish. 33pp.<br />
No. 75 Gilligan, D., 2005. Fish communities <strong>of</strong> the Murrumbidgee catchment: Status and trends. 138pp.<br />
No. 76 Ferrell, D.J., 2005. Biological information for appropriate management <strong>of</strong> endemic fish species at Lord Howe<br />
Island. 18 pp.<br />
No. 77 Gilligan, D., Gehrke, P. and Schiller, C., 2005. Testing methods and ecological consequences <strong>of</strong> large-scale<br />
removal <strong>of</strong> common carp. 46pp.<br />
No. 78 Boys, C.A., Esslemont, G. and Thoms, M.C., 2005. Fish habitat and protection in the Barwon-Darling and<br />
Paroo Rivers. 118pp.<br />
No. 79 Steffe, A.S., Murphy, J.J., Chapman, D.J. and Gray, C.C., 2005. An assessment <strong>of</strong> changes in the daytime<br />
recreational fishery <strong>of</strong> Lake Macquarie following the establishment <strong>of</strong> a ‘Recreational Fishing Haven’. 103pp.<br />
No. 80 Gannassin, C. and Gibbs, P., 2005. Broad-Scale Interactions Between Fishing and Mammals, Reptiles and<br />
Birds in NSW Marine Waters. 171pp.<br />
No. 81 Steffe, A.S., Murphy, J.J., Chapman, D.J., Barrett, G.P. and Gray, C.A., 2005. An assessment <strong>of</strong> changes in<br />
the daytime, boat-based, recreational fishery <strong>of</strong> the Tuross Lake estuary following the establishment <strong>of</strong> a<br />
'Recreational Fishing Haven'. 70pp.<br />
Robbins et al. <strong>Assessment</strong> <strong>of</strong> <strong>shark</strong> <strong>sighting</strong> <strong>rates</strong> <strong>by</strong> <strong>aerial</strong> beach patrols
NSW DPI 37<br />
No. 82 Silberschnieder, V. and Gray, C.A., 2005. Arresting the decline <strong>of</strong> the commercial and recreational fisheries<br />
for mulloway (Argyrosomus japonicus). 71pp.<br />
No. 83 Gilligan, D., 2005. Fish communities <strong>of</strong> the Lower Murray-Darling catchment: Status and trends. 106pp.<br />
No. 84 Baumgartner, L.J., Reynoldson, N., Cameron, L. and Stanger, J., 2006. <strong>Assessment</strong> <strong>of</strong> a Dual-frequency<br />
Identification Sonar (DIDSON) for application in fish migration studies. 33pp.<br />
No. 85 Park, T., 2006. FishCare Volunteer Program Angling Survey: Summary <strong>of</strong> data collected and<br />
recommendations. 41pp.<br />
No. 86 Baumgartner, T., 2006. A preliminary assessment <strong>of</strong> fish passage through a Denil fishway on the Edward<br />
River, Australia. 23pp.<br />
No. 87 Stewart, J., 2007. Observer study in the Estuary General sea garfish haul net fishery in NSW. 23pp.<br />
No. 88 Faragher, R.A., Pogonoski, J.J., Cameron, L., Baumgartner, L. and van der Walt, B., 2007. <strong>Assessment</strong> <strong>of</strong> a<br />
stocking program: Findings and recommendations for the Snowy Lakes Trout Strategy. 46pp.<br />
No. 89 Gilligan, D., Rolls, R., Merrick, J., Lintermans, M., Duncan, P. and Kohen, J., 2007. Scoping knowledge<br />
requirements for Murray crayfish (Euastacus armatus). Final report to the Murray Darling Basin Commission<br />
for Project No. 05/1066 NSW 103pp.<br />
No. 90 Kelleway, J., Williams. R.J. and Allen, C.B., 2007. An assessment <strong>of</strong> the saltmarsh <strong>of</strong> the Parramatta River<br />
and Sydney Harbour. 100pp.<br />
No. 91 Williams, R.J. and Thiebaud, I., 2007. An analysis <strong>of</strong> changes to aquatic habitats and adjacent land-use in the<br />
downstream portion <strong>of</strong> the Hawkesbury Nepean River over the past sixty years. 97pp.<br />
No. 92 Baumgartner, L., Reynoldson, N., Cameron, L. and Stanger, J. The effects <strong>of</strong> selected irrigation practices on<br />
fish <strong>of</strong> the Murray-Darling Basin. 90pp.<br />
No. 93 Rowland, S.J., Landos, M., Callinan, R.B., Allan, G.L., Read, P., Mifsud, C., Nixon, M., Boyd, P. and Tally,<br />
P., 2007. Development <strong>of</strong> a health management strategy for the Silver Perch Aquaculture Industry. 219pp.<br />
No. 94 Park, T., 2007. NSW Gamefish Tournament Monitoring – Angling Research Monitoring Program. Final<br />
report to the NSW Recreational Fishing Trust. 142pp.<br />
No. 95 Heasman, M.P., Liu, W., Goodsell, P.J., Hurwood D.A. and Allan, G.L., 2007. Development and delivery <strong>of</strong><br />
technology for production, enhancement and aquaculture <strong>of</strong> blacklip abalone (Haliotis rubra) in New South<br />
Wales. 226pp.<br />
No. 96 Ganassin, C. and Gibbs, P.J., 2007. A review <strong>of</strong> seagrass planting as a means <strong>of</strong> habitat compensation<br />
following loss <strong>of</strong> seagrass meadow. 41pp.<br />
No. 97 Stewart, J. and Hughes, J., 2008. Determining appropriate harvest size at harvest for species shared <strong>by</strong> the<br />
commercial trap and recreational fisheries in New South Wales. 282pp.<br />
No. 98 West, G. and Williams, R.J., 2008. A preliminary assessment <strong>of</strong> the historical, current and future cover <strong>of</strong><br />
seagrass in the estuary <strong>of</strong> the Parramatta River. 61pp.<br />
No. 99 Williams, D.L. and Scandol, J.P., 2008. Review <strong>of</strong> NSW recreational fishing tournament-based monitoring<br />
methods and datasets. 83pp.<br />
No. 100 Allan, G.L., Heasman, H. and Bennison, S., 2008. Development <strong>of</strong> industrial-scale inland saline aquaculture:<br />
Coordination and communication <strong>of</strong> R&D in Australia. 245pp.<br />
No. 101 Gray, C.A and Barnes, L.M., 2008. Reproduction and growth <strong>of</strong> dusky flathead (Platycephalus fuscus) in<br />
NSW estuaries. 26pp.<br />
No. 102 Graham, K.J., 2008. The Sydney inshore trawl-whiting fishery: codend selectivity and fishery characteristics.<br />
153pp.<br />
No. 103 Macbeth, W.G., Johnson, D.D. and Gray, C.A., 2008. <strong>Assessment</strong> <strong>of</strong> a 35-mm square-mesh codend and<br />
composite square-mesh panel configuration in the ocean prawn-trawl fishery <strong>of</strong> northern New South Wales.<br />
104pp.<br />
No. 104 O’Connor, W.A., Dove, M. and Finn, B., 2008. Sydney rock oysters: Overcoming constraints to commercial<br />
scale hatchery and nursery production. 119pp.<br />
No. 105 Glas<strong>by</strong>, T.M. and Lobb, K., 2008. Assessing the likelihoods <strong>of</strong> marine pest introductions in Sydney estuaries:<br />
A transport vector approach. 84pp.<br />
No. 106 Rotherham, D., Gray, C.A., Underwood, A.J., Chapman, M.G. and Johnson, D.D., 2008. Developing fisheryindependent<br />
surveys for the adaptive management <strong>of</strong> NSW’s estuarine fisheries. 135pp.<br />
No. 107 Broadhurst, M., 2008. Maximising the survival <strong>of</strong> <strong>by</strong>catch discarded from commercial estuarine fishing gears<br />
in NSW. 192pp.<br />
No. 108 Gilligan, D., McLean, A. and Lugg, A., 2009. Murray Wetlands and Water Recovery Initiatives: Rapid<br />
assessment <strong>of</strong> fisheries values <strong>of</strong> wetlands prioritised for water recovery. 69pp.<br />
No. 109 Williams, R.J. and Thiebaud, I., 2009. Occurrence <strong>of</strong> freshwater macrophytes in the catchments <strong>of</strong> the<br />
Parramatta River, Lane Cove River and Middle Harbour Creek, 2007 – 2008. 75pp.<br />
<strong>Assessment</strong> <strong>of</strong> <strong>shark</strong> <strong>sighting</strong> <strong>rates</strong> <strong>by</strong> <strong>aerial</strong> beach patrols Robbins et al.
38 NSW DPI<br />
No. 110 Gilligan, D., Vey, A. and Asmus, M., 2009. Identifying drought refuges in the Wakool system and assessing<br />
status <strong>of</strong> fish populations and water quality before, during and after the provision <strong>of</strong> environmental, stock and<br />
domestic flows. 56pp.<br />
ISSN 1837-2112 (Industry & Investment NSW – <strong>Fisheries</strong> Final Report Series)<br />
No. 111 Gray, C.A., Scandol. J.P., Steffe, A.S. and Ferrell, D.J., 2009. Australian Society for Fish Biology Annual<br />
Conference & Workshop 2008: Assessing Recreational <strong>Fisheries</strong>; Current and Future Challenges. 54pp.<br />
No. 112 Otway, N.M. Storrie, M.T., Louden, B.M. and Gilligan, J.J., 2009. Documentation <strong>of</strong> depth-related migratory<br />
movements, localised movements at critical habitat sites and the effects <strong>of</strong> scuba diving for the east coast grey<br />
nurse <strong>shark</strong> population. 90pp.<br />
No. 113 Creese, R.G., Glas<strong>by</strong>, T.M., West, G. and Gallen, C., 2009. Mapping the habitats <strong>of</strong> NSW estuaries. 95pp.<br />
No. 114 Macbeth, W.G., Geraghty, P.T., Peddemors, V.M. and Gray, C.A., 2009. Observer-based study <strong>of</strong> targeted<br />
commercial fishing for large <strong>shark</strong> species in waters <strong>of</strong>f northern New South Wales. 82pp.<br />
No. 115 Scandol, J.P., Ives, M.C. and Lockett, M.M., 2009. Development <strong>of</strong> national guidelines to improve the<br />
application <strong>of</strong> risk-based methods in the scope, implementation and interpretation <strong>of</strong> stock assessments for<br />
data-poor species. 186pp.<br />
No. 116 Baumgartner, L., Bettanin, M., McPherson, J., Jones, M., Zampatti, B. and Kathleen Beyer., 2009.<br />
<strong>Assessment</strong> <strong>of</strong> an infrared fish counter (Vaki Riverwatcher) to quantify fish migrations in the Murray-Darling<br />
Basin. 47pp.<br />
No. 117 Astles, K., West, G., and Creese, R.G., 2010. Estuarine habitat mapping and geomorphic characterisation <strong>of</strong><br />
the Lower Hawkesbury river and Pittwater estuaries. 229pp.<br />
No. 118 Gilligan, D., Jess, L., McLean, G., Asmus, M., Wooden, I., Hartwell, D., McGregor, C., Stuart, I., Vey, A.,<br />
Jefferies, M., Lewis, B. and Bell, K., 2010. Identifying and implementing targeted carp control options for the<br />
Lower Lachlan Catchment. 126pp.<br />
No. 119 Montgomery, S.S., Walsh, C.T., Kes<strong>by</strong>, C.L and Johnson, D.D., 2010. Studies on the growth and mortality <strong>of</strong><br />
school prawns. 90pp.<br />
No. 120 Liggins, G.W. and Upston, J., 2010. Investigating and managing the Perkinsus-related mortality <strong>of</strong> blacklip<br />
abalone in NSW. 182pp.<br />
No. 121 Knight, J., 2010. The feasibility <strong>of</strong> excluding alien redfin perch from Macquarie perch habitat in the<br />
Hawkesbury-Nepean Catchment. 53pp.<br />
No. 122 Ghosn, D., Steffe, A., Murphy, J., 2010. An assessment <strong>of</strong> the effort and catch <strong>of</strong> shore and boat-based<br />
recreational fishers in the Sydney Harbour estuary over the 2007/08 summer period. 60pp.<br />
No. 123 Rourke, M. and Gilligan, D., 2010. Population genetic structure <strong>of</strong> freshwater catfish (Tandanus tandanus) in<br />
the Murray-Darling Basin and coastal catchments <strong>of</strong> New South Wales: Implications for future re-stocking<br />
programs. 74pp.<br />
No. 124 Tynan, R., Bunter, K. and O’Connor, W., 2010. Industry Management and Commercialisation <strong>of</strong> the Sydney<br />
Rock Oyster Breeding Program. 21pp.<br />
No. 125 Lowry, M., Folpp, H., Gregson, M. and McKenzie, R., 2010. <strong>Assessment</strong> <strong>of</strong> artificial reefs in Lake<br />
Macquarie NSW. 47pp.<br />
No. 126 Howell, T. and Creese, R., 2010. Freshwater fish communities <strong>of</strong> the Hunter, Manning, Karuah and<br />
Macquarie-Tuggerah catchments: a 2004 status report. 93pp.<br />
No. 127 Gilligan, D., Rodgers, M., McGarry, T., Asmus, M. and Pearce, L., 2010. The distribution and abundance <strong>of</strong><br />
two endangered fish species in the NSW Upper Murray Catchment. 34pp.<br />
No. 128 Gilligan, D., McGarry, T. and Carter, S., 2010. A scientific approach to developing habitat rehabilitation<br />
strategies in aquatic environments: A case study on the endangered Macquarie perch (Macquaria<br />
australasica) in the Lachlan catchment. 61pp.<br />
No. 129 Stewart, J., Hughes, J., McAllister, J., Lyle, J. and MacDonald, M., 2011. Australian salmon (Arripis trutta):<br />
Population structure, reproduction, diet and composition <strong>of</strong> commercial and recreational catches. 257 pp.<br />
ISSN 1837-2112 (<strong>Fisheries</strong> Final Report Series)<br />
No. 130 Boys, C., Glas<strong>by</strong>, T., Kroon, F., Baumgartner, L., Wilkinson, K., Reilly, G. and Fowler, T., 2011. Case<br />
studies in restoring connectivity <strong>of</strong> coastal aquatic habitats: floodgates, box culvert and rock-ramp fishway.<br />
75pp.<br />
No. 131 Steffe, A.S. and Murphy, J.J., 2011. Recreational fishing surveys in the Greater Sydney Region. 122pp.<br />
No. 132 Robbins, W.D., Peddemors, V.M. and Kennelly, S.J., 2012. <strong>Assessment</strong> <strong>of</strong> <strong>shark</strong> <strong>sighting</strong> <strong>rates</strong> <strong>by</strong> <strong>aerial</strong><br />
beach patrols. 38pp.<br />
Robbins et al. <strong>Assessment</strong> <strong>of</strong> <strong>shark</strong> <strong>sighting</strong> <strong>rates</strong> <strong>by</strong> <strong>aerial</strong> beach patrols