Assessment of shark sighting rates by aerial ... - Fisheries Reports
Assessment of shark sighting rates by aerial ... - Fisheries Reports
Assessment of shark sighting rates by aerial ... - Fisheries Reports

Create successful ePaper yourself
Turn your PDF publications into a flip-book with our unique Google optimized e-Paper software.
NSW DPI 11<br />
A<br />
B<br />
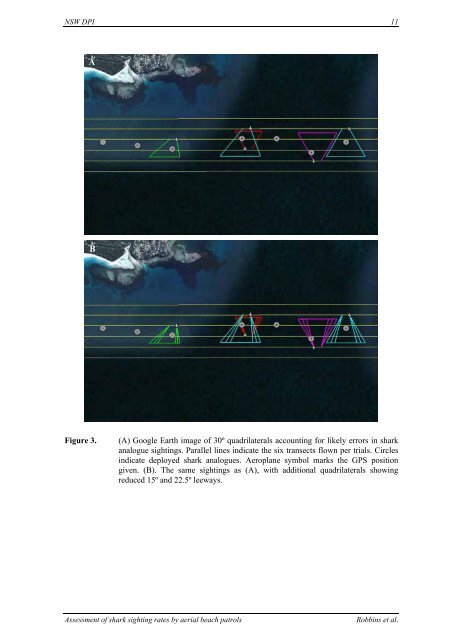
Figure 3. (A) Google Earth image <strong>of</strong> 30º quadrilaterals accounting for likely errors in <strong>shark</strong><br />
analogue <strong>sighting</strong>s. Parallel lines indicate the six transects flown per trials. Circles<br />
indicate deployed <strong>shark</strong> analogues. Aeroplane symbol marks the GPS position<br />
given. (B). The same <strong>sighting</strong>s as (A), with additional quadrilaterals showing<br />
reduced 15º and 22.5º leeways.<br />
<strong>Assessment</strong> <strong>of</strong> <strong>shark</strong> <strong>sighting</strong> <strong>rates</strong> <strong>by</strong> <strong>aerial</strong> beach patrols Robbins et al.