Ackerman_et_al. - MODIS Atmosphere - NASA
Ackerman_et_al. - MODIS Atmosphere - NASA
Ackerman_et_al. - MODIS Atmosphere - NASA

Create successful ePaper yourself
Turn your PDF publications into a flip-book with our unique Google optimized e-Paper software.
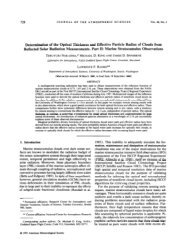
1082 JOURNAL OF ATMOSPHERIC AND OCEANIC TECHNOLOGY VOLUME 25<br />
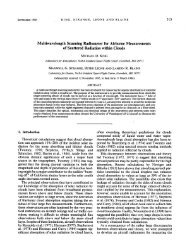
FIG. 14. (top) AHSRL cloud and aerosol backscatter and (bottom) depolarization ratio on 22 Aug<br />
2004 over Madison b<strong>et</strong>ween 0815 and 0905 UTC. The <strong>MODIS</strong> overpass at approximately 0839 UTC<br />
indicated a clear scene. The tot<strong>al</strong> cloud/aerosol optic<strong>al</strong> depth as measured by the AHSRL is approximately<br />
0.2.<br />
known, <strong>al</strong>lows the cloud extinction profile to be derived<br />
directly from the observations without assumptions.<br />
The HSRLs observe cloud extinction profiles with a<br />
high spati<strong>al</strong> and tempor<strong>al</strong> resolution, a capability that<br />
makes HSRL observations unique and very powerful<br />
for investigating the <strong>MODIS</strong> cloud mask sensitivity to<br />
cloud optic<strong>al</strong> depth. The University of Wisconsin—<br />
Madison has pioneered the advancement of HSRLs<br />
over the last three decades (e.g., Eloranta 2005). The<br />
current Arctic-HSRL (AHSRL) provides time histories<br />
of the following cloud and aerosol variables: 1) optic<strong>al</strong><br />
depth profiles as a function of <strong>al</strong>titude; 2) circular depolarization<br />
profiles as a function of <strong>al</strong>titude, which<br />
<strong>al</strong>lows discrimination b<strong>et</strong>ween ice cryst<strong>al</strong>s and water<br />
dropl<strong>et</strong>s; 3) backscatter cross section as a function of<br />
<strong>al</strong>titude; 4) cloud-base <strong>al</strong>titude; and 5) cloud-top <strong>al</strong>ti-<br />
tude for clouds of optic<strong>al</strong> depths less than approximately<br />
2.5. Raw data are acquired at 7.5-m range interv<strong>al</strong>s<br />
with 0.5-s time resolution. All vertic<strong>al</strong> profiles begin<br />
at an <strong>al</strong>titude of 100 m and extend to 30 km. A cloud<br />
is considered to occupy a layer when the aerosol backscatter<br />
cross section is greater than 1 10 6 (m sr) 1 .<br />
When dense clouds are present, useful data will be<br />
present up to an <strong>al</strong>titude where the optic<strong>al</strong> depth<br />
reaches approximately 2.5.<br />
The AHSRL was operated at Madison, Wisconsin, in<br />
an automated manner during January–September 2004.<br />
Table 3 shows the comparison b<strong>et</strong>ween <strong>MODIS</strong> cloud<br />
d<strong>et</strong>ection and the AHSRL, including day and night<br />
cases for both Terra and Aqua satellites. The two cloud<br />
d<strong>et</strong>ection m<strong>et</strong>hods agree approximately 70% of the<br />
time. Figure 13 is a scatter diagram of AHSRL optic<strong>al</strong>