Ackerman_et_al. - MODIS Atmosphere - NASA
Ackerman_et_al. - MODIS Atmosphere - NASA
Ackerman_et_al. - MODIS Atmosphere - NASA

You also want an ePaper? Increase the reach of your titles
YUMPU automatically turns print PDFs into web optimized ePapers that Google loves.
1076 JOURNAL OF ATMOSPHERIC AND OCEANIC TECHNOLOGY VOLUME 25<br />
3. Cloud d<strong>et</strong>ection<br />
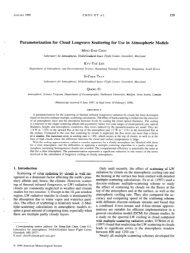
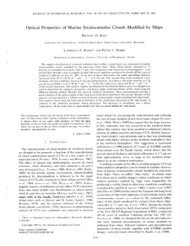
FIG. 3. Zon<strong>al</strong> mean frequencies of cloudy conditions for 16 Oct 2003, daytime ocean scenes as a<br />
function of three threshold cloud d<strong>et</strong>ection tests, and the combination of <strong>al</strong>l 16 tests from <strong>MODIS</strong>.<br />
Cloud d<strong>et</strong>ection is fundament<strong>al</strong>ly a function of the<br />
contrast b<strong>et</strong>ween the targ<strong>et</strong> (cloud) and background<br />
environment (e.g., ground or atmosphere). The <strong>MODIS</strong><br />
<strong>al</strong>gorithm relies heavily on contrast in sever<strong>al</strong> spectr<strong>al</strong><br />
bands, assigning confidence thresholds to a series of<br />
spectr<strong>al</strong> cloud tests (<strong>Ackerman</strong> <strong>et</strong> <strong>al</strong>. 1998; King <strong>et</strong> <strong>al</strong>.<br />
2003; Platnick <strong>et</strong> <strong>al</strong>. 2003). In this section, we explore<br />
the sensitivity of cloud d<strong>et</strong>ection to specific spectr<strong>al</strong><br />
tests and instrument characteristics.<br />
Figure 3 shows the zon<strong>al</strong> mean frequencies of cloud<br />
conditions in daytime ocean scenes on 16 October 2003<br />
as functions of three cloud d<strong>et</strong>ection tests and the combination<br />
of <strong>al</strong>l 16 tests from <strong>MODIS</strong>. Comparing the<br />
fin<strong>al</strong> results of the cloud mask with the individu<strong>al</strong> tests<br />
shows that for this scene type, a single spectr<strong>al</strong> test with<br />
the reflectance at 0.86 m does very well <strong>al</strong>one. The<br />
largest error, only a few percent, occurs around 10°N.<br />
This single test works because of the high contrast b<strong>et</strong>ween<br />
clear-sky and cloudy conditions and suggests that<br />
a comparison of different <strong>al</strong>gorithms should include a<br />
comparison of this reflectance test <strong>al</strong>one to b<strong>et</strong>ter understand<br />
any discrepancies among <strong>al</strong>gorithms. We will<br />
use this result later to explore the sensitivity of cloud<br />
d<strong>et</strong>ection to a specific threshold and viewing geom<strong>et</strong>ry.<br />
The BT 11 BT 3.9 difference test is not as sensitive to<br />
tot<strong>al</strong> cloud cover as the reflectance test. The daytime<br />
ocean threshold for assigning cloud to a pixel (outside<br />
sun glint) is BT 11 BT 3.9 80.0 K. During the daylight<br />
hours the difference b<strong>et</strong>ween BT 11 and BT 3.9 is<br />
large and negative because of reflection of solar energy<br />
at 3.9 m. This technique has proven useful for d<strong>et</strong>ecting<br />
low-level water clouds. In addition, moderate to<br />
large differences b<strong>et</strong>ween BT 11 and BT 3.9 result when a<br />
nonuniform scene (e.g., broken cloud) is observed.<br />
These differences are due to the differenti<strong>al</strong> spectr<strong>al</strong><br />
responses of the two bands to varying scene temperatures<br />
as a result of Planck’s law.<br />
As expected, the R 1.38 threshold test underestimates<br />
the zon<strong>al</strong> mean cloud amount. While cloud tests using<br />
this <strong>MODIS</strong> channel d<strong>et</strong>ect low-level clouds in dry atmospheres,<br />
it is primarily sensitive to thick upper-level<br />
clouds. The <strong>MODIS</strong> cloud mask <strong>al</strong>so has a thin cirrus<br />
d<strong>et</strong>ection <strong>al</strong>gorithm that is not included in the over<strong>al</strong>l<br />
results of the fin<strong>al</strong> cloud mask, but it is included as a<br />
separate result. The zon<strong>al</strong> fraction of thin cirrus d<strong>et</strong>ected<br />
by the R 1.38 channel, and not d<strong>et</strong>ected by any<br />
other tests, is shown in Fig. 4. This an<strong>al</strong>ysis indicates<br />
that very thin cirrus gener<strong>al</strong>ly occupy less than 2% of<br />
most zon<strong>al</strong> regions.<br />
The zon<strong>al</strong> mean frequencies of cloudy conditions for<br />
16 October 2003 for nighttime ocean scenes as a function<br />
of three cloud d<strong>et</strong>ection tests and the combination<br />
of <strong>al</strong>l nighttime tests from <strong>MODIS</strong> indicate that the<br />
multispectr<strong>al</strong> mask (Fig. 5) is more sensitive than a<br />
single cloud test. This results from the lower contrast<br />
b<strong>et</strong>ween cloud and clear sky at night. The best ap-