Download The Journal (PDF) - Division on Autism and ...
Download The Journal (PDF) - Division on Autism and ...
Download The Journal (PDF) - Division on Autism and ...

You also want an ePaper? Increase the reach of your titles
YUMPU automatically turns print PDFs into web optimized ePapers that Google loves.
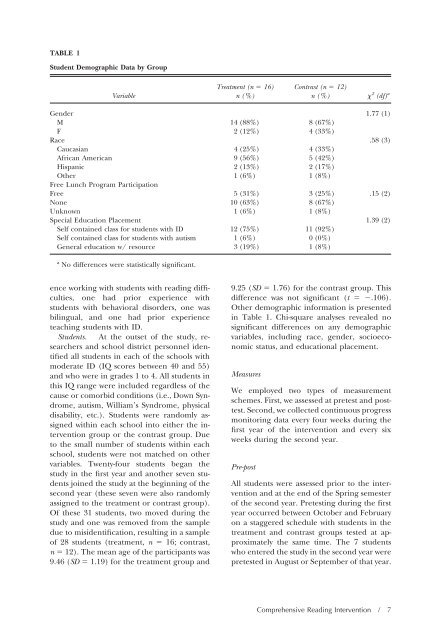
TABLE 1<br />
Student Demographic Data by Group<br />
Variable<br />
ence working with students with reading difficulties,<br />
<strong>on</strong>e had prior experience with<br />
students with behavioral disorders, <strong>on</strong>e was<br />
bilingual, <strong>and</strong> <strong>on</strong>e had prior experience<br />
teaching students with ID.<br />
Students. At the outset of the study, researchers<br />
<strong>and</strong> school district pers<strong>on</strong>nel identified<br />
all students in each of the schools with<br />
moderate ID (IQ scores between 40 <strong>and</strong> 55)<br />
<strong>and</strong> who were in grades 1 to 4. All students in<br />
this IQ range were included regardless of the<br />
cause or comorbid c<strong>on</strong>diti<strong>on</strong>s (i.e., Down Syndrome,<br />
autism, William’s Syndrome, physical<br />
disability, etc.). Students were r<strong>and</strong>omly assigned<br />
within each school into either the interventi<strong>on</strong><br />
group or the c<strong>on</strong>trast group. Due<br />
to the small number of students within each<br />
school, students were not matched <strong>on</strong> other<br />
variables. Twenty-four students began the<br />
study in the first year <strong>and</strong> another seven students<br />
joined the study at the beginning of the<br />
sec<strong>on</strong>d year (these seven were also r<strong>and</strong>omly<br />
assigned to the treatment or c<strong>on</strong>trast group).<br />
Of these 31 students, two moved during the<br />
study <strong>and</strong> <strong>on</strong>e was removed from the sample<br />
due to misidentificati<strong>on</strong>, resulting in a sample<br />
of 28 students (treatment, n 16; c<strong>on</strong>trast,<br />
n 12). <str<strong>on</strong>g>The</str<strong>on</strong>g> mean age of the participants was<br />
9.46 (SD 1.19) for the treatment group <strong>and</strong><br />
Treatment (n 16)<br />
n (%)<br />
9.25 (SD 1.76) for the c<strong>on</strong>trast group. This<br />
difference was not significant (t .106).<br />
Other demographic informati<strong>on</strong> is presented<br />
in Table 1. Chi-square analyses revealed no<br />
significant differences <strong>on</strong> any demographic<br />
variables, including race, gender, socioec<strong>on</strong>omic<br />
status, <strong>and</strong> educati<strong>on</strong>al placement.<br />
Measures<br />
We employed two types of measurement<br />
schemes. First, we assessed at pretest <strong>and</strong> posttest.<br />
Sec<strong>on</strong>d, we collected c<strong>on</strong>tinuous progress<br />
m<strong>on</strong>itoring data every four weeks during the<br />
first year of the interventi<strong>on</strong> <strong>and</strong> every six<br />
weeks during the sec<strong>on</strong>d year.<br />
Pre-post<br />
C<strong>on</strong>trast (n 12)<br />
n (%) 2 (df) a<br />
Gender 1.77 (1)<br />
M 14 (88%) 8 (67%)<br />
F 2 (12%) 4 (33%)<br />
Race .58 (3)<br />
Caucasian 4 (25%) 4 (33%)<br />
African American 9 (56%) 5 (42%)<br />
Hispanic 2 (13%) 2 (17%)<br />
Other 1 (6%) 1 (8%)<br />
Free Lunch Program Participati<strong>on</strong><br />
Free 5 (31%) 3 (25%) .15 (2)<br />
N<strong>on</strong>e 10 (63%) 8 (67%)<br />
Unknown 1 (6%) 1 (8%)<br />
Special Educati<strong>on</strong> Placement 1.39 (2)<br />
Self c<strong>on</strong>tained class for students with ID 12 (75%) 11 (92%)<br />
Self c<strong>on</strong>tained class for students with autism 1 (6%) 0 (0%)<br />
General educati<strong>on</strong> w/ resource 3 (19%) 1 (8%)<br />
a No differences were statistically significant.<br />
All students were assessed prior to the interventi<strong>on</strong><br />
<strong>and</strong> at the end of the Spring semester<br />
of the sec<strong>on</strong>d year. Pretesting during the first<br />
year occurred between October <strong>and</strong> February<br />
<strong>on</strong> a staggered schedule with students in the<br />
treatment <strong>and</strong> c<strong>on</strong>trast groups tested at approximately<br />
the same time. <str<strong>on</strong>g>The</str<strong>on</strong>g> 7 students<br />
who entered the study in the sec<strong>on</strong>d year were<br />
pretested in August or September of that year.<br />
Comprehensive Reading Interventi<strong>on</strong> / 7