Download The Journal (PDF) - Division on Autism and ...
Download The Journal (PDF) - Division on Autism and ...
Download The Journal (PDF) - Division on Autism and ...

Create successful ePaper yourself
Turn your PDF publications into a flip-book with our unique Google optimized e-Paper software.
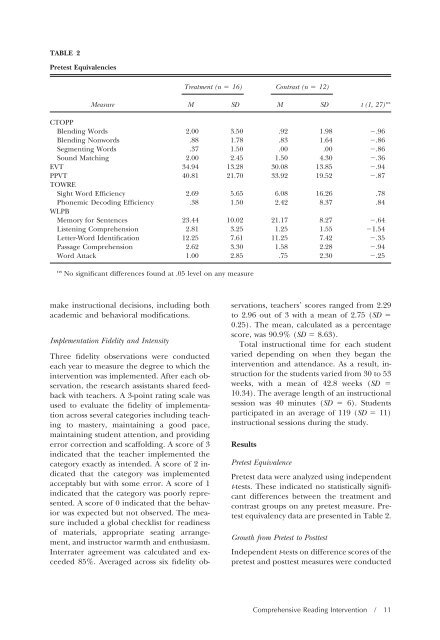
TABLE 2<br />
Pretest Equivalencies<br />
Measure<br />
make instructi<strong>on</strong>al decisi<strong>on</strong>s, including both<br />
academic <strong>and</strong> behavioral modificati<strong>on</strong>s.<br />
Implementati<strong>on</strong> Fidelity <strong>and</strong> Intensity<br />
Three fidelity observati<strong>on</strong>s were c<strong>on</strong>ducted<br />
each year to measure the degree to which the<br />
interventi<strong>on</strong> was implemented. After each observati<strong>on</strong>,<br />
the research assistants shared feedback<br />
with teachers. A 3-point rating scale was<br />
used to evaluate the fidelity of implementati<strong>on</strong><br />
across several categories including teaching<br />
to mastery, maintaining a good pace,<br />
maintaining student attenti<strong>on</strong>, <strong>and</strong> providing<br />
error correcti<strong>on</strong> <strong>and</strong> scaffolding. A score of 3<br />
indicated that the teacher implemented the<br />
category exactly as intended. A score of 2 indicated<br />
that the category was implemented<br />
acceptably but with some error. A score of 1<br />
indicated that the category was poorly represented.<br />
A score of 0 indicated that the behavior<br />
was expected but not observed. <str<strong>on</strong>g>The</str<strong>on</strong>g> measure<br />
included a global checklist for readiness<br />
of materials, appropriate seating arrangement,<br />
<strong>and</strong> instructor warmth <strong>and</strong> enthusiasm.<br />
Interrater agreement was calculated <strong>and</strong> exceeded<br />
85%. Averaged across six fidelity ob-<br />
Treatment (n 16) C<strong>on</strong>trast (n 12)<br />
M SD M SD<br />
servati<strong>on</strong>s, teachers’ scores ranged from 2.29<br />
to 2.96 out of 3 with a mean of 2.75 (SD <br />
0.25). <str<strong>on</strong>g>The</str<strong>on</strong>g> mean, calculated as a percentage<br />
score, was 90.9% (SD 8.63).<br />
Total instructi<strong>on</strong>al time for each student<br />
varied depending <strong>on</strong> when they began the<br />
interventi<strong>on</strong> <strong>and</strong> attendance. As a result, instructi<strong>on</strong><br />
for the students varied from 30 to 53<br />
weeks, with a mean of 42.8 weeks (SD <br />
10.34). <str<strong>on</strong>g>The</str<strong>on</strong>g> average length of an instructi<strong>on</strong>al<br />
sessi<strong>on</strong> was 40 minutes (SD 6). Students<br />
participated in an average of 119 (SD 11)<br />
instructi<strong>on</strong>al sessi<strong>on</strong>s during the study.<br />
Results<br />
t (1, 27) ns<br />
CTOPP<br />
Blending Words 2.00 3.50 .92 1.98 .96<br />
Blending N<strong>on</strong>words .88 1.78 .83 1.64 .86<br />
Segmenting Words .37 1.50 .00 .00 .86<br />
Sound Matching 2.00 2.45 1.50 4.30 .36<br />
EVT 34.94 13.28 30.08 13.85 .94<br />
PPVT 40.81 21.70 33.92 19.52 .87<br />
TOWRE<br />
Sight Word Efficiency 2.69 5.65 6.08 16.26 .78<br />
Ph<strong>on</strong>emic Decoding Efficiency .38 1.50 2.42 8.37 .84<br />
WLPB<br />
Memory for Sentences 23.44 10.02 21.17 8.27 .64<br />
Listening Comprehensi<strong>on</strong> 2.81 3.25 1.25 1.55 1.54<br />
Letter-Word Identificati<strong>on</strong> 12.25 7.61 11.25 7.42 .35<br />
Passage Comprehensi<strong>on</strong> 2.62 3.30 1.58 2.28 .94<br />
Word Attack 1.00 2.85 .75 2.30 .25<br />
ns No significant differences found at .05 level <strong>on</strong> any measure<br />
Pretest Equivalence<br />
Pretest data were analyzed using independent<br />
t-tests. <str<strong>on</strong>g>The</str<strong>on</strong>g>se indicated no statistically significant<br />
differences between the treatment <strong>and</strong><br />
c<strong>on</strong>trast groups <strong>on</strong> any pretest measure. Pretest<br />
equivalency data are presented in Table 2.<br />
Growth from Pretest to Posttest<br />
Independent t-tests <strong>on</strong> difference scores of the<br />
pretest <strong>and</strong> posttest measures were c<strong>on</strong>ducted<br />
Comprehensive Reading Interventi<strong>on</strong> / 11