Estonian EMEP Assessment Report
Estonian EMEP Assessment Report
Estonian EMEP Assessment Report

Create successful ePaper yourself
Turn your PDF publications into a flip-book with our unique Google optimized e-Paper software.
66<br />
<strong>EMEP</strong> <strong>Assessment</strong> <strong>Report</strong> – Part II<br />
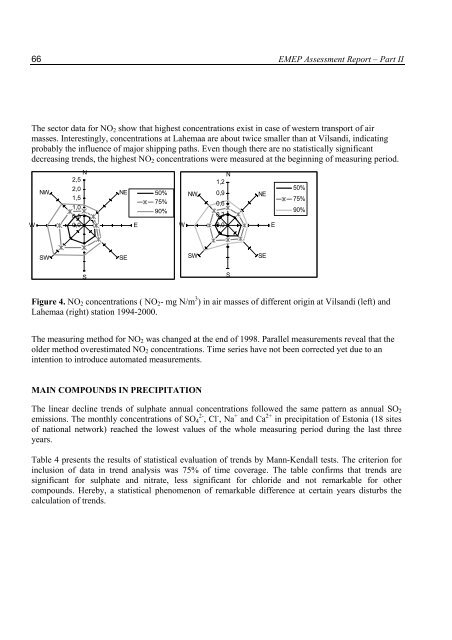
The sector data for NO2 show that highest concentrations exist in case of western transport of air<br />
masses. Interestingly, concentrations at Lahemaa are about twice smaller than at Vilsandi, indicating<br />
probably the influence of major shipping paths. Even though there are no statistically significant<br />
decreasing trends, the highest NO2 concentrations were measured at the beginning of measuring period.<br />
W<br />
N<br />
NW<br />
2,5<br />
2,0<br />
1,5<br />
1,0<br />
0,5<br />
NE 50%<br />
75%<br />
90%<br />
0,0<br />
E<br />
SW<br />
S<br />
Figure 4. NO2 concentrations ( NO2- mg N/m 3 ) in air masses of different origin at Vilsandi (left) and<br />
Lahemaa (right) station 1994-2000.<br />
The measuring method for NO2 was changed at the end of 1998. Parallel measurements reveal that the<br />
older method overestimated NO2 concentrations. Time series have not been corrected yet due to an<br />
intention to introduce automated measurements.<br />
MAIN COMPOUNDS IN PRECIPITATION<br />
SE<br />
W<br />
NW<br />
SW<br />
N<br />
1,2<br />
0,9<br />
0,6<br />
0,3<br />
0,0<br />
The linear decline trends of sulphate annual concentrations followed the same pattern as annual SO2<br />
emissions. The monthly concentrations of SO4 2- , Cl - , Na + and Ca 2+ in precipitation of Estonia (18 sites<br />
of national network) reached the lowest values of the whole measuring period during the last three<br />
years.<br />
Table 4 presents the results of statistical evaluation of trends by Mann-Kendall tests. The criterion for<br />
inclusion of data in trend analysis was 75% of time coverage. The table confirms that trends are<br />
significant for sulphate and nitrate, less significant for chloride and not remarkable for other<br />
compounds. Hereby, a statistical phenomenon of remarkable difference at certain years disturbs the<br />
calculation of trends.<br />
S<br />
NE<br />
SE<br />
E<br />
50%<br />
75%<br />
90%