Estonian EMEP Assessment Report
Estonian EMEP Assessment Report
Estonian EMEP Assessment Report

Create successful ePaper yourself
Turn your PDF publications into a flip-book with our unique Google optimized e-Paper software.
68<br />
<strong>EMEP</strong> <strong>Assessment</strong> <strong>Report</strong> – Part II<br />
It reveals from the meteorological data for the measurement period that, compared to the average of the<br />
period of 1961-2000, that the last 15 years have been relatively warm and rich in precipitation.<br />
Although the concentration of pollutants in precipitation depends on the amount of precipitation,<br />
precipitation load is heavier in years with bigger precipitation.<br />
Figure 7 shows that significant variations in precipitation amounts occurred within years under analysis.<br />
Thus, deposition trends were not analysed.<br />
900<br />
800<br />
700<br />
600<br />
500<br />
400<br />
300<br />
200<br />
Vilsandi Lahemaa<br />
1994 1995 1996 1997 1998 1999 2000<br />
Figure 7. Variation of precipitation amounts (mm) at <strong>EMEP</strong> stations of Estonia.<br />
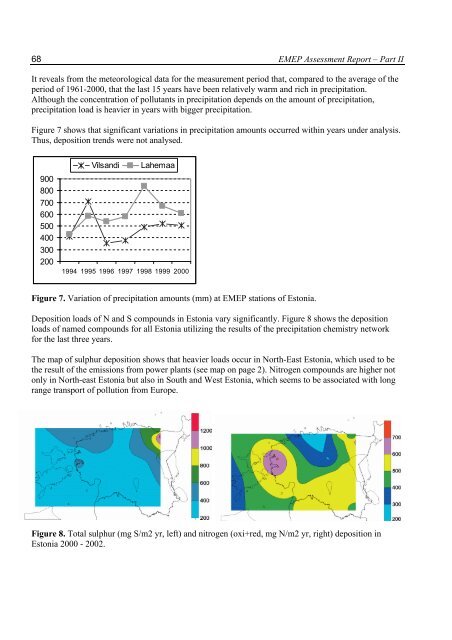
Deposition loads of N and S compounds in Estonia vary significantly. Figure 8 shows the deposition<br />
loads of named compounds for all Estonia utilizing the results of the precipitation chemistry network<br />
for the last three years.<br />
The map of sulphur deposition shows that heavier loads occur in North-East Estonia, which used to be<br />
the result of the emissions from power plants (see map on page 2). Nitrogen compounds are higher not<br />
only in North-east Estonia but also in South and West Estonia, which seems to be associated with long<br />
range transport of pollution from Europe.<br />
Figure 8. Total sulphur (mg S/m2 yr, left) and nitrogen (oxi+red, mg N/m2 yr, right) deposition in<br />
Estonia 2000 - 2002.