Estonian EMEP Assessment Report
Estonian EMEP Assessment Report
Estonian EMEP Assessment Report

You also want an ePaper? Increase the reach of your titles
YUMPU automatically turns print PDFs into web optimized ePapers that Google loves.
EMISSIONS<br />
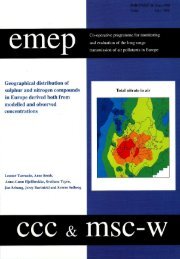
<strong>Estonian</strong> <strong>EMEP</strong> <strong>Assessment</strong> <strong>Report</strong><br />
Katrin Pajuste 1 , Veljo Kimmel 1 , Natalja Kohv 2 , Toivo Truuts 1<br />
1 <strong>Estonian</strong> Environmental Research Centre, 2 <strong>Estonian</strong> Environment Information Centre,<br />
Local. The <strong>Estonian</strong> Air Emissions database has been maintained since 1976. At the beginning, the<br />
database included data only for 5 largest <strong>Estonian</strong> towns: Tallinn, Tartu, Pärnu, Narva and Kohtla-<br />
Järve. Later on some industrial counties were added and from 1990 the inventory has been covering the<br />
whole <strong>Estonian</strong> territory. At present, some data are being recalculated for 1980 and 1985.<br />
The main branch of industry in Estonia is energy production. Approximately 89% of energy in Estonia<br />
is produced by combustion of fossil fuels. The remaining 11% comes from biomass.<br />
The energy sector, as well as chemical industry, is based on oil shale. In 1999, 92% of electricity was<br />
generated from oil shale, a fuel specific for Estonia, characterized by a high ash content (45-50%),<br />
moderate sulphur content (1.4-1.8%) and low net caloric value. Oil shale mining and combustion,<br />
accounting for about 81% of the total harmful emissions of Estonia has put a severe load on the<br />
environment.<br />
350<br />
300<br />
250<br />
200<br />
150<br />
100<br />
50<br />
0<br />
1980<br />
SO2 from manufacturing industry<br />
SO2 from energy and transformation industries<br />
total emission of SO2<br />
excavated oil shale<br />
1985<br />
1990<br />
1991<br />
1992<br />
1993<br />
1994<br />
1995<br />
1996<br />
1997<br />
1998<br />
1999<br />
2000<br />
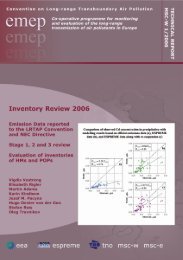
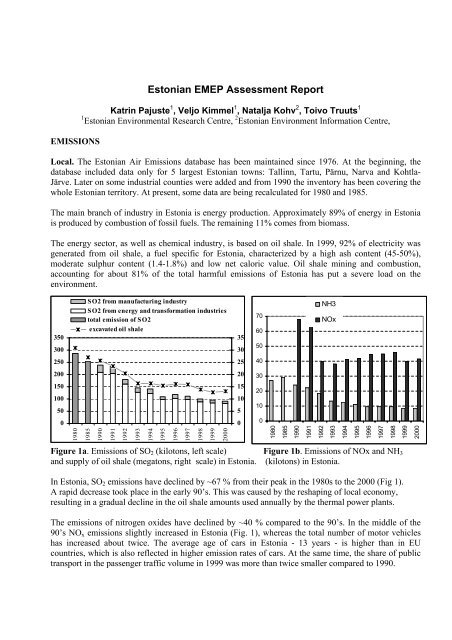
Figure 1a. Emissions of SO2 (kilotons, left scale) Figure 1b. Emissions of NOx and NH3<br />
and supply of oil shale (megatons, right scale) in Estonia. (kilotons) in Estonia.<br />
In Estonia, SO2 emissions have declined by ~67 % from their peak in the 1980s to the 2000 (Fig 1).<br />
A rapid decrease took place in the early 90’s. This was caused by the reshaping of local economy,<br />
resulting in a gradual decline in the oil shale amounts used annually by the thermal power plants.<br />
The emissions of nitrogen oxides have declined by ~40 % compared to the 90’s. In the middle of the<br />
90’s NOx emissions slightly increased in Estonia (Fig. 1), whereas the total number of motor vehicles<br />
has increased about twice. The average age of cars in Estonia - 13 years - is higher than in EU<br />
countries, which is also reflected in higher emission rates of cars. At the same time, the share of public<br />
transport in the passenger traffic volume in 1999 was more than twice smaller compared to 1990.<br />
35<br />
30<br />
25<br />
20<br />
15<br />
10<br />
5<br />
0<br />
70<br />
60<br />
50<br />
40<br />
30<br />
20<br />
10<br />
0<br />
1980<br />
1985<br />
1990<br />
1991<br />
1992<br />
NH3<br />
NOx<br />
1993<br />
1994<br />
1995<br />
1996<br />
1997<br />
1998<br />
1999<br />
2000
64<br />
<strong>EMEP</strong> <strong>Assessment</strong> <strong>Report</strong> – Part II<br />
The main sources of ammonia emission in Estonia are agriculture: manure management and fertilizer<br />
consumption. The emission of ammonia has reduced by 68% since 1980 due to the decrease in livestock<br />
numbers (especially dairy cows and cattle as the most significant sources of NH3 emission) and reduced<br />
use of mineral fertilizers.<br />
Transboundary fluxes. The <strong>EMEP</strong> database of source-receptor matrices for 1996 and 1998, and the<br />
paper <strong>EMEP</strong>/ MSC-W (2000) shows that polluted air was mostly imported to Estonia from Western and<br />
Central Europe and neighboring countries. The biggest part of incoming pollution originates in<br />
international shipping, Poland, Germany, Russia, Finland, and Latvia. All the named countries reduced<br />
their emissions of SO2 and NOx during the 90s. Thus if patterns of transport of air masses were<br />
throughout the study period similar to those in 1996 and 1998, the import of pollution to Estonia has<br />
reduced during the considered period.<br />
MONITORING STATIONS AND DATA QUALITY<br />
In Estonia, the first systematic measurements in background stations begun on the islands lying in west<br />
Estonia (Sõrve and Vilsandi stations) in the 80s and soon after in the Lahemaa National Park.<br />
At the beginning (1985-1991), <strong>Estonian</strong><br />
stations were operated by the<br />
Hydrometeorological Institute using<br />
measuring equipment and methods of the<br />
former USSR. Samples were analysed in<br />
different laboratories and unfortunately<br />
differences in test results arouse doubts<br />
concerning reliability of data. There are also<br />
many gaps in data series.<br />
After gaining independence in 1991, environmental monitoring underwent reorganization. This also<br />
explains the existence of gaps in data for the period 1992-1993. The collection of data on the state of<br />
the environment has been budgetary since 1994. The <strong>Estonian</strong> Environmental Research Centre (EERC)<br />
has been operating the monitoring stations from the same year. The CLRTAP and its first protocols<br />
were signed by Estonia as late as in 2000 and the <strong>EMEP</strong> financing protocol in 2001.<br />
The longest available data series exist for Lahemaa (SU09/EE09) station. The station at Sõrve (SU02)<br />
operated only until 1991. The station located on the island of Vilsandi (SU11/EE11) provided data<br />
occasionally in 1989-1990. Systematic data submission has been taken place since 1994. Improvements<br />
have been made in data quality for precipitation components (Table 3), which reach now the level A<br />
and B for most of compounds (Table 3).
W<br />
Contribution from: Estonia<br />
Table 2. Measurement programme<br />
Medium Type Sampling time Components<br />
Air Gas<br />
24 h SO2, NO2, SO4 (EE09)<br />
Precipitation<br />
1 h SO2, NO2 , O3 (EE11)<br />
Ions Weekly SO4 2- , NH4 + , NO3 - , Na + , Mg 2+ ,<br />
K + , Ca 2+ , Cl - , pH,<br />
conductivity, amount<br />
Heavy metals Monthly As, Cd, Cu, Hg, Pb, Zn<br />
Table 3. Overview of data uncertainty for precipitation and air quality measurements<br />
Air data quality SO2 NO2 SO4<br />
Lahemaa EE09
66<br />
<strong>EMEP</strong> <strong>Assessment</strong> <strong>Report</strong> – Part II<br />
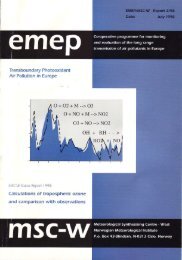
The sector data for NO2 show that highest concentrations exist in case of western transport of air<br />
masses. Interestingly, concentrations at Lahemaa are about twice smaller than at Vilsandi, indicating<br />
probably the influence of major shipping paths. Even though there are no statistically significant<br />
decreasing trends, the highest NO2 concentrations were measured at the beginning of measuring period.<br />
W<br />
N<br />
NW<br />
2,5<br />
2,0<br />
1,5<br />
1,0<br />
0,5<br />
NE 50%<br />
75%<br />
90%<br />
0,0<br />
E<br />
SW<br />
S<br />
Figure 4. NO2 concentrations ( NO2- mg N/m 3 ) in air masses of different origin at Vilsandi (left) and<br />
Lahemaa (right) station 1994-2000.<br />
The measuring method for NO2 was changed at the end of 1998. Parallel measurements reveal that the<br />
older method overestimated NO2 concentrations. Time series have not been corrected yet due to an<br />
intention to introduce automated measurements.<br />
MAIN COMPOUNDS IN PRECIPITATION<br />
SE<br />
W<br />
NW<br />
SW<br />
N<br />
1,2<br />
0,9<br />
0,6<br />
0,3<br />
0,0<br />
The linear decline trends of sulphate annual concentrations followed the same pattern as annual SO2<br />
emissions. The monthly concentrations of SO4 2- , Cl - , Na + and Ca 2+ in precipitation of Estonia (18 sites<br />
of national network) reached the lowest values of the whole measuring period during the last three<br />
years.<br />
Table 4 presents the results of statistical evaluation of trends by Mann-Kendall tests. The criterion for<br />
inclusion of data in trend analysis was 75% of time coverage. The table confirms that trends are<br />
significant for sulphate and nitrate, less significant for chloride and not remarkable for other<br />
compounds. Hereby, a statistical phenomenon of remarkable difference at certain years disturbs the<br />
calculation of trends.<br />
S<br />
NE<br />
SE<br />
E<br />
50%<br />
75%<br />
90%
Contribution from: Estonia<br />
Table 4. Significant downward trends in precipitation during the period of 1994-2000<br />
SO4 - S NH4 – N NO3 - N K Cl Na<br />
EE09-Lahemaa * + ** + * *<br />
EE11-Vilsandi ** * *<br />
** trend is significant at the level of 0.01<br />
* trend is significant at the level of 0.05<br />
+ trend is significant at the level of 0.1<br />
Figure 5 depicts the variation of S and N compounds at <strong>EMEP</strong> stations of Estonia.<br />
The trend is especially remarkable for sulphate where concentrations fall about twice at both stations.<br />
1,6<br />
1,4<br />
1,2<br />
1,0<br />
0,8<br />
0,6<br />
0,4<br />
0,2<br />
0,0<br />
Vilsandi SO4-S Sen's estimate<br />
LahemaaSO4-S Sen's estimate<br />
1994 1995 1996 1997 1998 1999 2000 2001<br />
Figure 5. Variation and trends (Sen’s estimate) in concentration of S (left) and N (right) compounds<br />
and at Lahemaa and Vilsandi.<br />
The trend of pH values is presented on Figure 6. When at Vilsandi pH is increasing, at Lahemaa we can<br />
observe a slightly opposite trend.<br />
5,2<br />
5,1<br />
5<br />
4,9<br />
4,8<br />
4,7<br />
4,6<br />
4,5<br />
4,4<br />
4,3<br />
4,2<br />
Vilsandi Sen's estimate<br />
Lahemaa Sen's estimate<br />
1994 1995 1996 1997 1998 1999 2000 2001<br />
0,6<br />
0,5<br />
0,4<br />
0,3<br />
0,2<br />
0,1<br />
0,0<br />
Vilsandi NH4-N Sen's estimate<br />
Vilsandi NO3-N Sen's estimate<br />
Lahemaa NH4-N Sen's estimate<br />
Lahemaa NO3-N Sen's estimate<br />
67<br />
1994 1995 1996 1997 1998 1999 2000 2001<br />
Figure 6. Variation and trends (Sen’s estimate)<br />
in pH of precipitation at <strong>EMEP</strong> stations.
68<br />
<strong>EMEP</strong> <strong>Assessment</strong> <strong>Report</strong> – Part II<br />
It reveals from the meteorological data for the measurement period that, compared to the average of the<br />
period of 1961-2000, that the last 15 years have been relatively warm and rich in precipitation.<br />
Although the concentration of pollutants in precipitation depends on the amount of precipitation,<br />
precipitation load is heavier in years with bigger precipitation.<br />
Figure 7 shows that significant variations in precipitation amounts occurred within years under analysis.<br />
Thus, deposition trends were not analysed.<br />
900<br />
800<br />
700<br />
600<br />
500<br />
400<br />
300<br />
200<br />
Vilsandi Lahemaa<br />
1994 1995 1996 1997 1998 1999 2000<br />
Figure 7. Variation of precipitation amounts (mm) at <strong>EMEP</strong> stations of Estonia.<br />
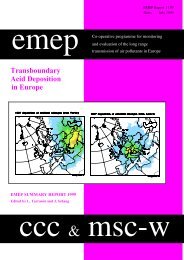
Deposition loads of N and S compounds in Estonia vary significantly. Figure 8 shows the deposition<br />
loads of named compounds for all Estonia utilizing the results of the precipitation chemistry network<br />
for the last three years.<br />
The map of sulphur deposition shows that heavier loads occur in North-East Estonia, which used to be<br />
the result of the emissions from power plants (see map on page 2). Nitrogen compounds are higher not<br />
only in North-east Estonia but also in South and West Estonia, which seems to be associated with long<br />
range transport of pollution from Europe.<br />
Figure 8. Total sulphur (mg S/m2 yr, left) and nitrogen (oxi+red, mg N/m2 yr, right) deposition in<br />
Estonia 2000 - 2002.
Contribution from: Estonia<br />
MAIN CONCLUSIONS<br />
During the last twenty years there have been a considerable decline in emissions in Estonia.<br />
The reduction equals to about 60% for sulphur compounds, about 40% for NOx and about 70% for<br />
ammonia.<br />
The drop in emissions is attributable to economic restructuring. We hope that the fact that Estonia is<br />
now a signatory to CLRTAP protocols (signed in 2000, 2001) as well as a continued economic<br />
development towards better technologies and adoption of renewable energy sources would lead to a<br />
further cut in emissions.<br />
The existing gaps and unknown quality of air and precipitation data does not allow to use the data on<br />
pollution levels generated before 1994.<br />
The fall in emissions in Estonia and incoming pollution was especially remarkable in the beginning of<br />
the 90’s. Unfortunately, there are no proven data about air and precipitation compounds. Sector analysis<br />
shows that pollution is mostly transport to Estonia from West and South.<br />
The analysis of precipitation data at Lahemaa shows that in contrast to the European trend there is an<br />
upward trend in values of hydrogen ions in Estonia. The reason for the measured upward trend is<br />
probably the reduction in emissions of alkaline dust from local power plants and a cement factory.<br />
However, the downward trend of pH is normalizing the ecological situation in bogs of North-East<br />
Estonia where earlier peat growth was stopped due to alkalization.<br />
The reduction in the concentrations of main compounds of precipitation is especially remarkable in case<br />
of sulphate where the concentration falls by factor of two. The variation of concentrations of nitrogen<br />
compounds shows a slight downward trend for oxides and almost stable level for ammmonia. Big<br />
variation in precipitation amounts during 1994-2000 does not allow calculating the trends for deposition<br />
loads of pollutants.<br />
69
70<br />
References:<br />
<strong>EMEP</strong> <strong>Assessment</strong> <strong>Report</strong> – Part II<br />
Estonia's third national communication: under the UN Framework Convention on Climate<br />
Change. Ministry of the Environment, Environment Information Centre, Institute of Ecology, Tallinn<br />
Pedagogical University. Tallinn 2001, pp. 79.<br />
pdf format: http://www.envir.ee/valisohukaitse/kliimaaruanne2001.pdf<br />
Kimmel, V., Tammet, H., Truuts, T. 2002. Variation of atmospheric air pollution under<br />
conditions of rapid economic change-Estonia 1994-1999. Atmospheric environment 36(25):4133-4144.<br />
Kohv, N., Laius, V., Liiv, S., Roots, O., Talkop, R., 2001. Atmospheric Air. State of<br />
Environment in Estonia on the threshold of XXI century. Ministry of the Environment of Estonia,<br />
Environment Information Centre, Tallinn, pp.17-24.<br />
pdf format: http://www.envir.ee/itk/eng/keskkond21_inglise.pdf<br />
Kohv, N., Mandel, E., Ljamtsev, A. 2002. Eesti paiksetest saasteallikatest õhku paisatud<br />
saasteainete statistiline aruanne 2001. (Statistical report on the pollutants emitted into air by <strong>Estonian</strong><br />
pollution sources 2001) Ministry of the Environment, Environment Information Centre, Tallinn, 91 pp.<br />
Roots, O., Saar, J., Saare, L., Kallaste, T. 1992. Air Pollution in Estonia 1985-1990.<br />
Environmental <strong>Report</strong> 3. Environmental Data Centre. National Board of Waters and the Environment.<br />
Helsinki. 61 pp.<br />
Roots, O. 1996. Main stationary and mobile air pollutants. In: Raukas, A (Ed.), <strong>Estonian</strong><br />
Environment: Past, present, Future. Ministry of the Environment, Environment Information Centre,<br />
Talinn, pp.123-127.