ccc & msc-w - EMEP
ccc & msc-w - EMEP
ccc & msc-w - EMEP

You also want an ePaper? Increase the reach of your titles
YUMPU automatically turns print PDFs into web optimized ePapers that Google loves.
emep Co-operative<br />
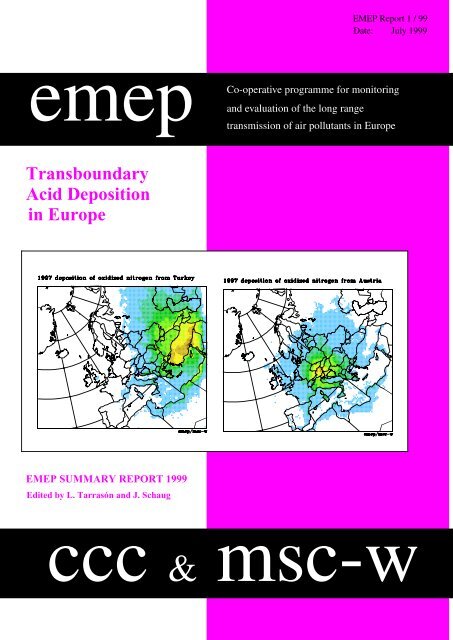
Transboundary<br />
Acid Deposition<br />
in Europe<br />
<strong>EMEP</strong> SUMMARY REPORT 1999<br />
Edited by L. Tarrasón and J. Schaug<br />
programme for monitoring<br />
and evaluation of the long range<br />
<strong>EMEP</strong> Report 1 / 99<br />
Date: July 1999<br />
transmission of air pollutants in Europe<br />
<strong>ccc</strong> <strong>msc</strong>-w<br />
MMM<br />
&
DET NORSKE METEOROLOGISKE INSTITUTT<br />
Norwegian Meteorological Institute<br />
Research Report no. 83<br />
TRANSBOUNDARY<br />
ACID DEPOSITION<br />
IN EUROPE<br />
<strong>EMEP</strong> SUMMARY REPORT<br />
1999<br />
Edited by<br />
Leonor Tarrasón and Jan Schaug<br />
ISSN 0332-9879<br />
<strong>EMEP</strong> Report 1/99<br />
Date: July 1999
Transboundary Acid Deposition in Europe<br />
Table of contents<br />
Preface 7<br />
1. Transboundary acid deposition in the <strong>EMEP</strong> area 13<br />
1.1. Trends of emission, deposition and critical load exceedances 13<br />
1.2. Geographical distribution of acidifying and eutrophying<br />
deposition and accidances 17<br />
1.3 Transboundary fluxes for 1997 22<br />
2. Overview of<strong>EMEP</strong> reported emission data 31<br />
2.1. Main objectives for the <strong>EMEP</strong> emission data 33<br />
2.2. <strong>EMEP</strong> emission reporting requirements 34<br />
2.3. Present status (1997 emission data) 36<br />
3. <strong>EMEP</strong> monitoring network for acidification and eutrophication 41<br />
3.1 Main objectives 41<br />
3.2 <strong>EMEP</strong> monitoring requirements 42<br />
3.3 Present status 44<br />
3.4 Suggestions for improvements 47<br />
4. The operative <strong>EMEP</strong> Eulerian acid deposition model 51<br />
4.1 Main objectives for <strong>EMEP</strong> acid deposition modelling 51<br />
4.2 Present status 52<br />
4.2.1. Evaluation of Eulerian model performance 53<br />
4.2.2. Evaluation of the Eulerian source-receptor matrices 56<br />
4.2.3. Statistical estimates of emissions using of source-receptor matrices 60<br />
4.3 Recommendations for future model development 61<br />
5. References 63<br />
Appendix: 1997Status Revieworganised by Country 66<br />
- National reported emissions<br />
- Overview of reported emissions data<br />
- Country/region contributions to acidifying and eutrophying pollution<br />
- Trends of emissions, depositions and exceedances to critical loads<br />
- Source-receptor analysis<br />
- Status of monitoring data
Contributors :<br />
Jerzy Bartnicki Krzysztof Olendrzynski<br />
Alf Grini Maximilian Posch<br />
David Hirst Arne Semb<br />
Anne-Gunn Hjellbrekke Egil Støren<br />
Kjetil Kåresen Svetlana Tsyro<br />
Sophia Mylona Wenche Aas<br />
Acknowledgements<br />
The work of <strong>EMEP</strong> is carried out in collaboration with a broad network of scientists at national level that<br />
contribute with the systematic collection, analysis and reporting of emission inventories and measurements from<br />
the <strong>EMEP</strong> monitoring networks. Without them this report would not have been possible.<br />
The scientific and technical teams at MSC-W and CCC are also grateful to Anton Eliassen and Øystein Hov for<br />
valuable suggestions and support. We would like to acknowledge our colleagues David Simpson, Jan Eiof Jonson,<br />
Sverre Solberg, Erik Berge, Frode Flatoy and Hugo Jakobsen, for their participation in scientific discussions and<br />
Dr. Steffen Unger, for useful comments and optimising the performance of the parallel model codes. Thanks are<br />
also due to the Coordinating Centre for Effects for providing the latest information on critical loads.<br />
The calculations presented in this report are based on meteorological data obtained from the Numerical Weather<br />
Prediction (NWP) model run at the Norwegian Meteorological Institute. We would specially like to thank Jan Erik<br />
Haugen and Dag Bjørge for their efforts in developing the new meteorological model HIRLAM-PS for use in<br />
MSC-W dispersion pollution models.<br />
The calculations were facilitated by access to a CRAY T3E supercomputer at the Norwegian University of<br />
Science and Technology (NTNU) in Trondheim, Norway. The invaluable assistance from the staff at NTNU is<br />
greatly acknowledged here.
Preface<br />
The Convention on Long Range Transboundary Air Pollution (LRTAP) provides a framework<br />
for international action to reduce the impact of air pollution. The work under the Convention<br />
has established a sound a process for negotiating concrete measures to control emissions of air<br />
pollutants through legally binding protocols. In this process, the main objective of the <strong>EMEP</strong><br />
programme (Co-operative Programme for Monitoring and Evaluation of the Long-Range<br />
Transmission of Air pollutants in Europe) is to regularly provide with qualified scientific<br />
information to support the review and further extension of the international protocols<br />
negotiated within the Convention.<br />
The main task of <strong>EMEP</strong> has been to provide the ECE Governments and the Convention on<br />
Long-range Transboundary Air Pollution with regular information on past and predicted<br />
emissions, concentrations and/or depositions of air pollutants in the <strong>EMEP</strong> region and, in<br />
particular, on the quantity and significance of their long-range transboundary transport. As the<br />
work of the Convention has advanced, the requirements on the information provided by <strong>EMEP</strong><br />
have also evolved. On the seventh phase of the programme, <strong>EMEP</strong> has been required to focus<br />
further in the evaluation of international abatement strategies and review the successes or<br />
failures of the existing Protocols. To satisfy these needs, the work of <strong>EMEP</strong> under the<br />
Convention has been formulated in five thematic areas (ref. EB.AIR/GE.1/1998.3):<br />
• Acid deposition and eutrophication<br />
• Photochemical oxidants<br />
• Heavy metals<br />
• Persistent organic pollutants<br />
• Aerosols<br />
This report focuses on the first of these areas: “Acid deposition and eutrophication” and has<br />
been prepared for presentation at the twenty third session of the Steering Body of <strong>EMEP</strong>.<br />
It summarises the 1997 European situation with respect to acidifying and eutrophying<br />
pollution transport across national boundaries and qualifies the assessment by reviewing the<br />
current achievements and limitations of the <strong>EMEP</strong> data. The analysis is intended to fulfil the<br />
main objectives for the acidification and eutrophication programme. Therefore, this report:<br />
a) presents a survey of the progress towards the reduction of emissions and depositions,<br />
in particular as it concerns exceedances of critical loads,<br />
b) quantifies transboundary fluxes allocating the sources of the estimated depositions,<br />
7
c) provides sulphur and nitrogen deposition values in a form useful for the assessment of<br />
effects, and<br />
d) reports progress in the development of tools to provide guidance on the most costeffective<br />
way of attaining environmental goals.<br />
Conclusions are presented both for the whole <strong>EMEP</strong> area and for each individual Party to the<br />
Convention.<br />
There are 44 Parties to the Convention to this date: 41 European countries, Canada, the United<br />
States and the European Community. Summary reports are presented in the Appendix, for all<br />
Parties except for Georgia and Malta. Georgia was not included in this year’s calculations<br />
because unfortunately the information that the country had ratified the CLRTAP on February<br />
2nd 1999 did not reach MSC-W in time for the model calculations. The reason not to include<br />
Malta is that there is no information available from the country. Malta has not reported<br />
emissions, does not participate in the <strong>EMEP</strong> monitoring programme and the estimated<br />
emissions from Malta are so low that its deposition is below the precision limits of the model<br />
calculation of transboundary fluxes.<br />
We have made an effort to present this information in a form useful for the Executive Body of<br />
the Convention on Long-Range Transboundary Air Pollution, its subsidiary bodies, and the<br />
Parties to Convention. It is anticipated that information on the relative importance of national<br />
and external emissions will help national authorities estimate their local and regional targets. It<br />
is also intended that <strong>EMEP</strong> results will be useful for the Working Group of Effects and the<br />
Working Group of Strategies and Review and thus form a basis for further evaluating<br />
international abatement strategies.<br />
The work of <strong>EMEP</strong> is carried out in collaboration with a broad network of scientists at national<br />
level that contribute with the systematic collection, analysis and reporting of emission<br />
inventories, measurements from the <strong>EMEP</strong> monitoring networks and results from modelling<br />
studies. These contributions are essential to <strong>EMEP</strong> and the success of the programme relies on<br />
this participation. The present report is intended to stimulate communication between the<br />
participants and users of <strong>EMEP</strong>, and facilitate the exchange of information by clarifying the<br />
operational objectives of the programme.<br />
This report consists of three parts. The first part (chapter 1) reviews the European situation<br />
with respect to acidifying and eutrophying air pollution since 1985 and presents updated 1997<br />
emissions, depositions, exceedances of critical loads and transboundary source-receptor<br />
matrices for the whole <strong>EMEP</strong> area.<br />
The second part (chapters 2-4) evaluates the requirements of the data used in the <strong>EMEP</strong><br />
program for acidification and provides suggestions for the future development of the program.<br />
Chapter 2 presents an overview of the requirements on <strong>EMEP</strong> emission data and discusses the<br />
completeness of the reported data in relation to these requirements. Chapter 3 evaluates the<br />
present status of <strong>EMEP</strong> monitoring network for acidification and eutrophication and gives<br />
recommendations for improvement. Chapter 4 reviews the progress with the <strong>EMEP</strong><br />
atmospheric dispersion models in terms of their performance and present recommendations for<br />
future model development. All three chapters have a similar structure, intended to clarify the<br />
requirements on data quality from <strong>EMEP</strong> and evaluate the 1997 status of the information<br />
compiled by the programme.<br />
8
The third part (appendix) presents the information compiled by <strong>EMEP</strong> in the form of a review<br />
organised by country. For each Party to the Convention, a detailed review of the evolution of<br />
the emissions, depositions and critical load exceedances is presented, together with the<br />
analysis of its transboundary pollution exchange. Specific comments and recommendations are<br />
given as necessary, on the status of the national <strong>EMEP</strong> monitoring network and of the reported<br />
emissions.<br />
The overall conclusion is that the <strong>EMEP</strong> programme has an impressive compilation of<br />
qualified data on transboundary acidifying pollution in Europe and, despite its limitations, is<br />
well in position to achieve its goals for the seventh phase.<br />
All data included is this report will be available via Internet after it is approved by the Steering<br />
Body of <strong>EMEP</strong>. Countries are encouraged to analyse the data and provide their own<br />
conclusions. Reactions and comments are both welcome and encouraged.<br />
http://www.emep.int<br />
9
Transboundary Acid Deposition<br />
in Europe in 1997<br />
11
1. Transboundary acid deposition in the <strong>EMEP</strong> area<br />
The international commitment to reducing acidification was the driving force behind the<br />
adoption of the Convention on Long Range Transboundary Air Pollution in 1979. At present, a<br />
substantial decrease on acid deposition has been recorded throughout Europe and both the<br />
actual exceedances and the area of ecosystems exposed to exceedance of critical load have<br />
been considerably reduced. Eutrophication, on the other hand, still remains a problem in most<br />
of the <strong>EMEP</strong> area.<br />
This chapter gives an overview of the 1997 status of transboundary acidifying and eutrophying<br />
pollution in Europe and traces the progress towards environmental improvements, measured in<br />
terms of exceedances to critical loads. To that purpose, trends in emissions, depositions,<br />
transboundary depositions and critical load exceedances since 1985 are presented and<br />
discussed. The European scale analysis performed here is complemented with a detailed<br />
analysis per country that is presented in the Appendix.<br />
Special attention is given to the quantification of transboundary depositions, which for the first<br />
time, are calculated with the 20-layer <strong>EMEP</strong> Eulerian Acid Deposition model. Updated 1997<br />
geographical distributions of depositions and conditional exceedances to critical loads are<br />
presented in the extended 50x50 km 2 <strong>EMEP</strong> grid.<br />
Measurements are not directly included in the present assessment, although it is intended to do<br />
so in future analysis. The study of trends in <strong>EMEP</strong> monitoring data demands a considerable<br />
quality control effort which has been initiated recently and will be reported in due time.<br />
1.1. Trends of emissions, depositions and critical load exceedances<br />
Since 1980, anthropogenic emissions of sulphur dioxide have been reduced in the whole<br />
<strong>EMEP</strong> area by 55%. According to MSC-W estimates, sulphur emissions in the <strong>EMEP</strong> area had<br />
decreased by 30% compared to 1980 levels already in 1989, thus meeting the requirements of<br />
the First Sulphur Protocol long before due in 1993. However, the emission reduction for the<br />
whole <strong>EMEP</strong> area is not representative for individual countries and, in 1993, officially reported<br />
emission data shows that 9 different countries did not meet the agreements from the First<br />
Sulphur Protocol (Mylona, 1999).<br />
The trend in the emission of NO x is characterised by relatively high releases in the late 1980s<br />
and a steady slow decrease during the 1990s. The 13% reduction in 1997 compared to the 1980<br />
level reaches 17% when 1987 (base year of the NO x Protocol) is used as a reference instead.<br />
13
Emission reductions estimated for the whole <strong>EMEP</strong> area satisfied in 1994 and 1996 the<br />
requirements from the First NO x Protocol, but according to the official reported values, 6<br />
countries had larger still NO x emissions in 1996 than in 1987.<br />
European emissions of ammonia appear to have dropped by approximately 15% between 1990<br />
and 1997. The almost constant emission trend before 1990 is primarily a result of the<br />
assumptions made to estimate the large amount of missing data for most countries.<br />
Emission trends have been derived at MSC-W from officially reported emissions and expert<br />
estimates. It is not possible at present to provide official emission trends because not all Parties<br />
to the Convention have reported national totals for all years since 1980. For SO2, only 43% of<br />
the countries have reported emission data for all years, and this percentage decreases to 41%<br />
for NO x and 16% for ammonia. National emission trend values are given in Tables 1.1 -1.3 at<br />
the end of this chapter and visualised in Figure 1.1. for trends since 1985. These are the values<br />
that have been used for the assessment summarised in the following.<br />
ktonnes/year<br />
3.0*10 4<br />
2.5*10 4<br />
2.0*10 4<br />
1.5*10 4<br />
1.0*10 4<br />
5.0*10 3<br />
<strong>EMEP</strong> area emissions<br />
0.0*10<br />
1985 1986 1987 1988 1989 1990 1991 1992 1993 1994 1995 1996 1997<br />
0<br />
0.0*10 0<br />
All data available on the internet at http://www.emep.int<br />
emep/<strong>msc</strong>−w<br />
Figure 1.1. Estimated emission trends since 1985 for the whole <strong>EMEP</strong> area used in<br />
acidification model calculations (emission values by country are given in Tables 1.1-1.3;<br />
adapted from Mylona, 1999).<br />
Trends on emissions, depositions, transboundary depositions, and exceedances to critical loads<br />
have been estimated for each Party to the Convention on Long Range Transboundary Air<br />
Pollution. The analysis has been performed separately for sulphur and nitrogen compounds,<br />
using conditional critical loads calculated by the Coordination Centre for Effects (CCE). In<br />
addition, the ecosystem area in each country exposed to exceedances of 5th percentile critical<br />
load has been calculated as percentage of the total area of the country. This information is<br />
given in the Appendix, using three different figures for each country.<br />
14<br />
Emissions<br />
NH3 (as N)<br />
NO2 (as N)<br />
SO2 (as S)<br />
3.0*10 4<br />
2.5*10 4<br />
2.0*10 4<br />
1.5*10 4<br />
1.0*10 4<br />
5.0*10 3
ktonnes (S)/yr<br />
2.5*10 4<br />
2.0*10 4<br />
1.5*10 4<br />
1.0*10 4<br />
5.0*10 3<br />
0.0*10 0<br />
ktonnes(N)/yr<br />
1.6*10 4<br />
1.4*10 4<br />
1.2*10 4<br />
1.0*10 4<br />
8.0*10 3<br />
6.0*10 3<br />
4.0*10 3<br />
2.0*10 3<br />
0.0*10 0<br />
Per cent of country area (%)<br />
a)<br />
ACIDIFYING SULPHUR<br />
1985 1986 1987 1988 1989 1990 1991 1992 1993 1994 1995 1996 1997<br />
All data available on the internet at http://www.emep.int emep/<strong>msc</strong>−w<br />
35<br />
30<br />
25<br />
20<br />
15<br />
10<br />
5<br />
b)<br />
ACIDIFYING AND EUTROPHYING NITROGEN<br />
c)<br />
Figure 1.2. a) Trends of total sulphur deposition (red), transboundary deposition (green) and<br />
acidifying conditional exceedance (blue) for countries in <strong>EMEP</strong> area.<br />
b) trends of total nitrogen deposition (red), transboundary deposition (green), acidifying<br />
conditional exceedance (blue) and eutrophying exceedance (yellow) for countries in <strong>EMEP</strong><br />
area. Sulphur and nitrogen emissions (both as NO x and NH 3 ) are given in black curve.<br />
Units: 1000 tonnes (S or N)/year.<br />
c) Ecosystem area with exceedance of critical load as percentage of the total country area.<br />
15<br />
Exceendance (cond)<br />
Transboundary dep.<br />
Total depositions<br />
Emissions<br />
1985 1986 1987 1988 1989 1990 1991 1992 1993 1994 1995 1996 1997<br />
All data available on the internet at http://www.emep.int emep/<strong>msc</strong>−w<br />
Ecosystem area with exceedance of 5th percentile critical load<br />
Eutr. exceedance<br />
Acid. exceedance (cond)<br />
Transboundary dep. (ox+red)<br />
Total depositions (ox+red)<br />
Emissions (ox+red)<br />
Eutrophying nitrogen<br />
Acidifying nitrogen (cond)<br />
Acidifying sulphur (cond)<br />
0<br />
0<br />
1985 1986 1987 1988 1989 1990 1991 1992 1993 1994 1995 1996 1997<br />
All data available on the internet at http://www.emep.int<br />
emep/<strong>msc</strong>−w<br />
1.6*10 4<br />
1.4*10 4<br />
1.2*10 4<br />
1.0*10 4<br />
8.0*10 3<br />
6.0*10 3<br />
4.0*10 3<br />
2.0*10 3<br />
0.0*10 0<br />
35<br />
30<br />
25<br />
20<br />
15<br />
10<br />
5<br />
2.5*10 4<br />
2.0*10 4<br />
1.5*10 4<br />
1.0*10 4<br />
5.0*10 3<br />
0.0*10 0
The first figure, for acidifying sulphur, shows the total sulphur mass deposited over the country<br />
each year and shows the effect of this deposition as the total mass contributing to exceedances<br />
of the 5th percentile conditional critical load. In general, trends in the exceedances follow the<br />
trends in sulphur and nitrogen deposition.<br />
The acidifying sulphur figure includes also a curve depicting the time evolution of deposition<br />
of transboundary origin to the specific country. Differences between total deposition and<br />
transboundary deposition give a good measure of the importance of indigenous deposition in<br />
the country. In many cases, specially over central European countries, it can be seen how the<br />
relative contribution of transboundary deposition has increased after the emissions from the<br />
countries themselves have decreased. Direct comparison between the emissions and<br />
depositions values allows a first analysis of the country balance of imported vs exported<br />
deposition.<br />
The second figure serves for the analysis of acidifying and eutrophying nitrogen. Excess<br />
nitrogen deposition contributes to acidification but can also lead to the eutrophication of soils<br />
an surface waters. Thus, to analyse the effects caused by excess nitrogen deposition both a<br />
conditional critical for acidity and a critical load of nutrient nitrogen need to be considered.<br />
The conditional critical load for acidifying nitrogen depends both on sulphur and nitrogen<br />
deposition, and thus the acidifying nitrogen exceedance trend depends both on sulphur and<br />
nitrogen deposition trends. The critical load for eutrophying nitrogen does not depend on<br />
sulphur deposition and therefore the eutrophying exceedances follow more generally the<br />
nitrogen depositions.<br />
The third figure gives the time evolution of the area of ecosystems with exceedance of the 5th<br />
percentile critical loads. The curves represent the time evolution of the ecosystem area exposed<br />
to possible exceedances, as percentage of the total country area. Here, the geographical<br />
distribution of the considered ecosystems plays an important role. Inter-annual meteorological<br />
variations can affect the pollution transport patterns, resulting in large changes in the<br />
percentage ecosystem area with exceedances of the 5th percentile. Larger deposition amounts<br />
over the country, do not necessarily imply larger ecosystem area with registered exceedances<br />
because both the deposition levels and the geographical distribution of sensitive ecosystems<br />
determine the changes in the ecosystem area.<br />
Figures 1.2 a), b) and c) summarise the analysis for all countries in Europe that are Parties to<br />
the Convention except Georgia, Iceland, Liechtenstein, Malta and Turkey. Georgia was not<br />
included in this year’s calculations because the information that the country had ratified the<br />
CLRTAP on February 2nd 1999 did not reach MSC-W in time for the model calculations. The<br />
emissions from Malta and Liechtenstein are so low that their depositions are below the<br />
precision limits of the model calculation of transboundary fluxes. Finally, Iceland and Turkey<br />
are not included either because there is no critical load data available for these countries.<br />
The transboundary deposition in these figures is the sum of total deposition in the individual<br />
countries that originates outside of their boundaries. For all these <strong>EMEP</strong> countries,<br />
transboundary depositions represent between 55-60% of the total deposition for sulphur, and<br />
between 40-50% of the total deposition for nitrogen. Although emissions have decreased, the<br />
distribution of sources in the different countries has not given the same type of reduction of in<br />
the depositions.<br />
16
Since 1985, exceedances to conditional critical loads have decreased by 76% for sulphur and<br />
by 65% for acidifying nitrogen. The decrease is mostly due to the reduction of sulphur<br />
emissions and depositions, because nitrogen depositions have been kept almost constant during<br />
the period. Consequently, there is no significant change in the total eutrophying exceedances<br />
for these areas.<br />
The percentage ecosystem area with exceedance of 5th percentile critical loads for<br />
acidification has steadily decreased, from 21% of total country area in 1985 to 8% in 1997. In<br />
contrast, the ecosystem area exposed to eutrophication has been kept almost constant during<br />
the period. Note here that although nitrogen deposition increased in 1997 the percentage<br />
ecosystem area with exceedance in fact decreased this year, because of the particular<br />
geographical distribution of the depositions and the sensitive ecosystems.<br />
1.2. Geographical distribution of acidifying and eutrophying deposition and<br />
exceedances<br />
The trends presented in the previous section have been calculated with the <strong>EMEP</strong> Lagrangian<br />
model up to 1996. 1997 values have been calculated with the <strong>EMEP</strong> Eulerian Acid Deposition<br />
model which is operative for <strong>EMEP</strong> for the first time this year. The scientific challenges<br />
associated to the introduction of the operational Eulerian <strong>EMEP</strong> Eulerian Acid Deposition are<br />
discussed in detailed in Bartnicki (1999) and Olendrzynski (1999). A short review of these is<br />
also given in Chapter 4.<br />
The main advantages for the work of the Convention derived from the introduction of the<br />
operative Eulerian model are:<br />
∗ the increased spatial resolution of the new Eulerian model , which has been<br />
verified to improve the level of accuracy of the <strong>EMEP</strong> estimates,<br />
* the improved consistency in the allocation of sources and calculation of<br />
transboundary fluxes<br />
* the fact that it represents a first step towards the implementation of a new<br />
generation of integrated multi-component models for policy applications<br />
An additional improvement is the extension of the <strong>EMEP</strong> grid in order to fully include in the<br />
calculations new Parties to the Convention, like Cyprus, Turkey, Armenia and Georgia, and<br />
areas of general interest like the Mediterranean Sea.<br />
It is expected that the increased accuracy and improved spatial resolution from the <strong>EMEP</strong><br />
Eulerian Acid Deposition Model will be useful for scientific research in the Working Group of<br />
Effects, for integrated assessment modellers, and for researchers and authorities at national<br />
level.<br />
Figures 1.3. a), b) and c) show the 1997 total deposition fields for the major acidifying and<br />
eutrophying compounds. Overall, an increased level of detail due to better spatial resolution<br />
and multilayer structure is attained.<br />
17
120<br />
110<br />
100<br />
90<br />
80<br />
70<br />
60<br />
50<br />
40<br />
30<br />
20<br />
70 80 90 100 110 120 130 140 150 160<br />
120<br />
110<br />
100<br />
90<br />
80<br />
70<br />
60<br />
50<br />
40<br />
30<br />
20<br />
a)<br />
’97 S dep. [mg/m2/yr]<br />
40 50 60 70 80 90 100 110 120 130 140 150 160<br />
> 2000<br />
1000 - 2000<br />
500 - 1000<br />
200 - 500<br />
100 - 200<br />
50 - 100<br />
< 50<br />
b) c)<br />
40 50 60 70 80 90 100 110 120 130 140 150 160<br />
Figure 1.3 a) 1997 total deposition of oxidised nitrogen (mg(N)/m 2 /a)<br />
b) 1997 total deposition of oxidised sulphur (mg(S)/m 2 /a)<br />
c) 1997 total deposition of reduced nitrogen (mg(N)/m 2 /a)<br />
* Scale for b) and c) given in the centre of the page<br />
120<br />
110<br />
100<br />
90<br />
80<br />
70<br />
60<br />
50<br />
40<br />
30<br />
20<br />
’97 S dep. [mg/m2/yr]<br />
> 2000<br />
1000 - 2000<br />
500 - 1000<br />
200 - 500<br />
100 - 200<br />
50 - 100<br />
< 50<br />
’97 ox.N d. [mg/m2/yr]<br />
> 1000<br />
500 - 1000<br />
200 - 500<br />
100 - 200<br />
50 - 100<br />
< 50<br />
40 50 60 70 80 90 100 110 120 130 140 150 160<br />
’
a)<br />
b) c)<br />
Figure 1.4 1997 exceedances of the 5th percentile critical loads for:<br />
a) acidifying sulphur (conditional) based on CL(S|Ndep97)<br />
b) acidifying nitrogen (conditional) based on CL(N|Sdep97)<br />
c) eutrophying nitrogen based on CL(Nut)<br />
Critical Loads calculated by CCE
Figure 1.5 Comparison of the 5th percentile exceedances for acidifying sulphur<br />
(above) and acidifying nitrogen (below) for two different emission projection scenarios.<br />
Left figures are based on the official reported 2010 emission projections. Right figures<br />
are based on scenario G5/2 for integrated assessment. Critical loads calculated by CCE.<br />
20
Figure 1.6 Comparison of the 5th percentile exceedances for eutrophying nitrogen<br />
(below) for two different emission projection scenarios. Left figure is based on the official<br />
reported 2010 emission projections. Right figure is based on scenario G5/2 for integrated<br />
assessment. Critical loads calculated by CCE.<br />
The geographical distribution of maximum depositions and their absolute values are<br />
comparable to those from previous estimates by the Lagrangian model. Differences between<br />
the models are within the expected meteorological variability. Largest differences are found for<br />
the deposition of nitrogen oxides (figure 1.3.a) where the Eulerian model estimates larger dry<br />
deposition values close to source areas.<br />
The increased spatial resolution in model calculations allows for a calculation of exceedances<br />
to critical loads in the 50x50km 2 grid (Posch et al., 1999). As expected, the spatial distribution<br />
of exceedances changes with respect to previous estimates with the Lagrangian model. Both<br />
geographical position of maximum and the value of the maximum exceedance are similar in<br />
the two models. There is no systematic pattern as the exceedances depend on the geographical<br />
distribution of sensitive ecosystems as well as on the actual deposition of sulphur and nitrogen.<br />
Note for example the increase of exceedances in Southern European countries, which is due in<br />
part to the increase of the deposition calculated by the Eulerian model in these areas in 1997.<br />
Figures 1.5 and 1.6 compare the 5th percentile exceedances of conditional critical loads for<br />
acidification and for eutrophication derived from two different emission projection scenarios.<br />
It is interesting to note that the exceedances calculated with the official 2010 emission<br />
projection scenario are considerably higher than the exceedances derived from the G5/2<br />
scenario. In fact, the 2010 official projection exceedances are larger around the maxima in the<br />
Black Triangle than the 1997 estimates. This behaviour is a consequence of the poor quality of<br />
21
emission projection data. Below 40% of the Parties to the Convention have reported emission<br />
projections for the three requested years and the reporting of these projections is not<br />
satisfactorily harmonised. In this situation is rather important for <strong>EMEP</strong> to co-operate with<br />
integrated assessment modellers that can assist in the calculation of the emission projections.<br />
1.3. Transboundary fluxes for 1997<br />
The computation of transboundary fluxes for 1997 has been carried out for the first time with<br />
the Eulerian Acid Deposition model, for the different emitting regions described in Table1.4<br />
Table 1.4 : Emitting regions displayed, and their identifying codes.<br />
Country/Region Code Country/Region Code<br />
Armenia AM Norway NO<br />
Austria AT Poland PL<br />
Belarus BY Portugal PT<br />
Belgium BE Republic of Moldova MD<br />
Bosnia and Herzegovina BA Romania RO<br />
Bulgaria BG Russian Federation RO<br />
Croatia HR Slovakia SK<br />
Cyprus CY Slovenia SI<br />
Czech Republic CZ Spain ES<br />
Denmark DE Sweden SE<br />
Finland FI Switzerland CH<br />
France FR The FYR of Macedonia MK<br />
Georgia GE Turkey TR<br />
Germany DE Ukraine UA<br />
Greece GR Yugoslavia YU<br />
Hungary HU United Kingdom GB<br />
Iceland IS Remaining Land Areas REM<br />
Ireland IE The Baltic Sea BAS<br />
Italy IT The Mediterranean Sea MED<br />
Latvia LV The North Sea NOS<br />
Lithuania LT Remaining N.E. Atlantic ATL<br />
Luxembourg LU Natural Oceanic NAT<br />
Malta MT<br />
Netherlands NL European Union EU<br />
In Table 1.4 Russian Federation means the part the Russian Federation inside the <strong>EMEP</strong><br />
domain of calculations. The same applies to the Remaining N.E. Atlantic region and Natural<br />
Oceanic emission area. Remaining Land Areas include North Africa, Albania, Estonia,<br />
Kazakhstan, Azerbaijan, Syria, Lebanon, Israel, parts of Uzbekistan,Turkmenistan, Iran, Iraq<br />
and Jordan. European Union includes 15 countries already listed in Table 1.4: Austria,<br />
Belgium, Denmark, Finland, France, Germany, Greece, Ireland, Italy, Luxembourg, The<br />
Netherlands, Portugal, Spain, Sweden and United Kingdom.<br />
The accuracy of the source-receptor matrices and the transboundary fluxes calculated by the<br />
Elerian model is discussed in Bartnicki (1999). In general, the Eulerian model allocates a<br />
larger fraction of the European emissions. This is well illustrated in Table 1.5 where the 1997<br />
import-export budgets for each country/region is summarised. Averaged over the <strong>EMEP</strong> area,<br />
the Eulerian model manages to allocate 90% of the emitted mass of oxidised sulphur, 82% of<br />
oxidised nitrogen and 95% of the emitted mass of reduced nitrogen. The rest of the emissions<br />
are transported out of the <strong>EMEP</strong> area boundaries.<br />
22
Receptors<br />
Table 1.5: Import-Export Budgets for 1997<br />
Oxidized sulphur Oxidized Nitrogen Reduced Nitrogen<br />
Export Import Sea <strong>EMEP</strong> Export Import Sea <strong>EMEP</strong> Export Import Sea <strong>EMEP</strong><br />
Mass % Mass % % % Mass % Mass % % % Mass % Mass % % %<br />
AT 226 79 698 92 15 95 447 85 420 85 9 87 380 61 487 67 6 99<br />
BE 1037 86 272 62 33 97 889 87 275 68 24 90 589 74 180 46 24 99<br />
BG 5646 83 970 45 25 87 513 75 294 63 13 89 377 59 340 57 10 89<br />
DK 472 87 280 79 46 98 718 95 258 87 25 78 622 74 131 38 44 100<br />
FI 299 60 802 80 23 98 601 76 343 64 11 69 135 48 165 53 17 99<br />
FR 3595 70 1981 56 34 95 3134 63 1707 48 21 89 2320 42 725 19 22 98<br />
DE 5629 77 2174 56 22 96 3919 71 1627 51 15 87 2591 49 1089 28 14 99<br />
GR 2278 84 1092 71 33 79 933 82 301 59 21 78 532 60 180 34 24 89<br />
HU 2689 82 863 59 15 94 445 74 408 72 6 94 391 63 351 60 4 97<br />
IS 100 82 68 75 76 97 79 91 59 88 40 61 16 66 17 67 60 98<br />
IE 623 76 207 51 59 98 345 92 250 89 47 79 603 55 95 16 40 99<br />
IT 4967 75 2253 58 36 90 3792 70 693 30 17 85 1772 47 288 12 19 96<br />
LU 38 95 28 93 25 97 63 94 27 88 17 89 49 85 27 76 12 99<br />
NL 512 83 320 75 38 98 1273 89 269 63 27 86 814 68 240 39 24 99<br />
NO 103 68 715 94 42 99 581 86 430 82 30 69 117 54 211 68 31 99<br />
PL 5993 55 2353 32 11 98 2291 65 1248 50 8 87 1324 46 953 38 7 99<br />
PT 1529 82 217 39 48 80 958 77 221 44 23 68 499 63 74 20 26 83<br />
RO 3108 68 2072 59 16 93 714 74 654 72 9 86 902 50 704 43 8 97<br />
ES 7469 72 595 17 35 86 2254 61 682 32 19 84 1286 45 280 15 18 91<br />
SE 226 65 1113 90 36 99 662 78 806 81 18 75 307 58 387 64 31 99<br />
CH 92 71 270 87 12 96 320 84 177 74 11 87 311 53 181 40 6 99<br />
TR 992 56 2340 75 13 83 1327 63 793 50 8 71 1076 41 637 29 13 90<br />
GB 5655 68 706 21 52 98 4130 73 712 32 35 85 1654 62 352 26 46 99<br />
BY 751 72 1240 81 6 95 486 85 511 85 5 78 860 48 571 38 3 99<br />
UA 3856 68 3416 65 13 92 1042 75 1255 79 8 82 2488 41 1273 27 10 98<br />
MD 77 91 283 97 21 93 84 92 81 92 11 82 280 72 189 64 10 99<br />
RU 4730 39 7957 51 10 84 3817 53 2545 43 4 64 1223 20 2572 35 3 93<br />
LV 252 85 347 89 18 97 100 94 223 97 9 76 100 72 187 82 13 99<br />
LT 317 82 398 85 13 96 161 93 247 95 8 78 186 64 229 69 7 99<br />
CZ 2447 70 1101 51 12 97 1003 78 455 62 8 90 429 64 427 64 7 98<br />
SK 877 87 747 85 13 95 335 89 293 88 6 89 293 71 259 69 4 98<br />
SI 523 87 181 69 18 92 197 92 133 88 11 90 126 71 92 64 10 98<br />
HR 300 75 606 86 25 95 184 81 300 88 11 91 132 67 224 78 12 97<br />
BA 1939 81 505 52 20 91 216 89 278 91 13 91 185 72 194 73 12 91<br />
YU* 1955 75 1148 64 16 92 166 83 402 92 10 93 425 57 319 50 8 95<br />
MK 72 85 287 96 18 87 17 96 81 99 13 80 102 73 88 70 10 93<br />
CY 213 91 15 40 31 74 62 88 18 69 19 74 29 87 8 63 39 81<br />
REM 4746 53 4123 50 9 75 1172 60 2453 76 4 66 2256 38 1120 24 6 83<br />
BAS 603 53 2150 80 55 99 901 84 895 84 24 79 0 0 1014 100 0 100<br />
NOS 983 43 5106 80 70 99 1582 80 2100 84 38 84 0 0 1981 100 0 100<br />
ATL 1945 43 11641 82 60 68 2637 68 3901 76 36 56 0 0 2729 100 0 100<br />
MED 36 60 12538 100 49 79 33 84 2061 100 24 66 0 0 1975 100 0 100<br />
BLS 0 0 2827 100 0 100 0 0 605 100 0 100 0 0 1072 100 0 100<br />
EU 28710 62 6894 28 37 92 18460 55 2931 16 22 84 10456 38 1003 6 23 97<br />
Export in tonnes (S or N) and in percent of the country (region) emission.<br />
Import in tonnes (S or N) and in percent of the total deposition to the country (region).<br />
Sea is the percent of the country (region) emission deposited to the sea surface.<br />
<strong>EMEP</strong> is the percent of the country (region) emission deposited to the <strong>EMEP</strong> domain.<br />
23
The following tables show the 1997 source-receptor matrices for oxidised sulphur, oxidised<br />
nitrogen and reduced sulphur as calculated by the Eulerian model. Comparison with previous<br />
source-receptor matrices calculated with the Lagrangian model show satisfactorily that the<br />
Eulerian model manages to account for the “indeterminate deposition” of the previous<br />
Lagrangian budget calculations.<br />
The Eulerian model manages to allocate the “indeterminate” contribution thus increasing the<br />
actual contribution of different countries. In many cases, the contribution of the country to<br />
itself increases in the 1997 simulations. This is particularly true in source areas and for<br />
Mediterranean countries. The deposition of Spanish emissions in Spain increases in 1997 with<br />
respect to previous years, particularly for oxidised nitrogen and this seems to be related to an<br />
increase in the dry deposition calculated by the Eulerian model.<br />
It is not clear at this point whether this is a feature of the Eulerian model or if it is a<br />
consequence of the particular meteorological variations during 1997. Still, it can be concluded<br />
that ifferences between the source-receptor matrices produced by Eulerian and the Lagrangian<br />
models are within the range expected from different meteorological variations.<br />
24
Source-receptor (country-to-country) matrix for oxidized sulphur in 1997<br />
(Units: 100 tonnes of S , Emitters → , Receptors ↓)<br />
AT BE BG DK FI FR DE GR HU IS IE IT LU NL NO PL PT RO ES SE CH TR GB BY UA MD RU LV LT CZ SK SI HR BA YU* MK CY REM BAS NOS ATL MED BLS NAT VUL SUM<br />
AT 61 13 10 2 0 48 145 3 33 0 1 89 1 5 0 50 1 8 30 0 5 0 18 1 2 0 2 0 0 78 19 65 6 8 7 0 0 3 2 7 1 0 0 1 32 758 AT<br />
BE 0 165 0 1 0 76 40 0 1 0 1 3 1 45 0 4 1 0 24 0 0 0 32 0 0 0 0 0 0 6 0 0 0 1 0 0 0 1 0 24 2 0 0 2 3 437 BE<br />
BG 2 2 1179 0 0 8 32 63 62 0 0 49 0 1 0 55 1 228 18 0 0 4 4 2 45 2 7 0 1 21 15 5 4 52 147 7 1 17 1 1 1 0 0 2 110 2149 BG<br />
DK 1 9 1 73 0 21 49 0 4 1 2 3 0 5 1 28 1 1 12 4 0 0 44 0 1 0 6 0 1 7 2 1 0 1 1 0 0 1 34 26 2 0 0 7 2 354 DK<br />
FI 1 7 2 9 201 19 70 0 16 0 1 7 0 3 3 74 0 8 19 19 0 0 24 15 11 0 288 11 9 20 6 2 1 6 6 0 0 54 55 8 3 0 0 7 13 1003 FI<br />
FR 4 111 11 4 0 1560 184 6 18 0 10 156 6 31 0 34 30 5 786 1 15 0 174 0 2 0 1 0 0 37 5 9 4 11 8 0 0 22 3 105 53 1 0 25 107 3540 FR<br />
DE 20 151 8 23 1 353 1711 3 41 0 9 58 8 74 1 315 6 8 149 3 22 0 197 3 4 0 12 2 3 442 15 9 2 10 8 0 0 7 42 94 11 0 0 12 49 3886 DE<br />
GR 1 1 482 0 0 9 16 437 31 0 0 65 0 0 0 26 1 56 31 0 0 5 2 1 15 0 2 0 0 11 7 3 2 32 58 9 1 39 0 1 1 0 0 4 175 1529 GR<br />
HU 13 3 28 1 0 13 72 9 596 0 0 51 0 1 0 137 1 99 21 0 1 1 5 2 12 0 4 0 1 60 92 18 22 49 79 0 0 6 2 2 1 0 0 1 53 1459 HU<br />
IS 0 2 0 0 0 5 3 0 0 22 3 1 0 1 0 2 0 0 9 0 0 0 17 0 0 0 1 0 0 1 0 0 0 0 0 0 0 0 0 2 3 0 0 14 1 90 IS<br />
IE 0 5 1 1 0 19 8 0 1 0 202 2 0 2 0 2 2 0 35 0 0 0 88 0 0 0 0 0 0 1 0 0 0 0 0 0 0 1 1 7 15 0 0 10 5 408 IE<br />
IT 12 9 49 1 0 103 65 29 47 0 1 1641 1 3 0 44 9 25 160 0 9 1 14 1 6 0 1 0 0 34 11 53 24 72 42 1 0 37 1 5 5 0 0 10 1367 3894 IT<br />
LU 0 5 0 0 0 8 5 0 0 0 0 1 2 1 0 1 0 0 4 0 0 0 2 0 0 0 0 0 0 1 0 0 0 0 0 0 0 0 0 1 0 0 0 0 1 30 LU<br />
NL 0 68 0 1 0 47 64 0 2 0 2 2 0 108 0 8 1 0 19 0 0 0 40 0 0 0 1 0 0 7 1 0 0 1 0 0 0 1 1 43 2 0 0 3 3 427 NL<br />
NO 1 14 4 18 5 40 97 2 10 1 7 6 0 6 49 47 1 4 34 14 1 0 100 3 3 0 151 3 3 17 4 2 0 4 4 0 0 6 18 37 15 0 0 28 8 764 NO<br />
PL 12 27 53 24 4 68 731 12 181 0 3 49 1 13 2 4909 3 67 55 8 2 1 65 31 69 1 53 9 23 437 91 18 7 36 41 1 0 15 52 24 3 0 0 7 58 7263 PL<br />
PT 0 0 0 0 0 5 1 0 0 0 0 4 0 0 0 0 337 0 145 0 0 0 1 0 0 0 0 0 0 0 0 0 0 1 0 0 0 3 0 0 40 1 0 7 6 554 PT<br />
RO 8 7 341 2 0 25 106 52 222 0 1 104 0 3 0 235 2 1452 32 1 1 8 12 10 149 6 21 2 3 65 59 16 10 114 240 3 1 23 3 4 1 0 0 3 175 3525 RO<br />
ES 1 4 7 0 0 80 13 4 5 0 2 49 0 2 0 6 156 3 2836 0 1 0 13 0 1 0 0 0 0 5 1 3 2 7 5 0 0 29 0 4 92 12 0 19 72 3431 ES<br />
SE 3 22 6 57 31 56 181 2 28 0 5 14 1 9 18 113 1 9 43 119 1 0 93 10 9 0 101 10 10 35 9 4 2 10 9 0 0 23 114 35 8 0 0 16 14 1232 SE<br />
CH 2 8 2 0 0 64 23 1 2 0 0 64 1 3 0 4 2 1 42 0 39 0 12 0 0 0 0 0 0 5 0 3 1 2 1 0 0 2 0 4 1 0 0 1 20 309 CH<br />
TR 4 3 532 1 0 20 49 142 56 0 0 118 0 1 0 81 1 162 56 0 1 778 9 7 177 3 57 1 2 27 16 9 4 53 74 3 32 318 2 2 1 0 0 16 299 3118 TR<br />
GB 1 30 4 4 0 107 70 1 5 0 61 12 1 14 1 16 5 3 101 1 1 0 2625 0 1 0 1 0 0 13 2 1 1 4 3 0 0 3 3 147 43 0 0 31 16 3331 GB<br />
BY 3 7 45 7 5 20 121 7 55 0 1 21 0 3 1 388 0 59 19 3 1 2 21 290 110 1 87 20 42 43 21 5 3 19 25 0 0 20 14 5 1 0 0 2 31 1530 BY<br />
UA 9 11 325 7 3 35 232 62 252 0 1 107 0 5 1 738 1 449 42 3 1 25 26 104 1806 21 211 9 20 110 87 19 10 85 111 3 1 59 13 7 2 0 0 7 200 5222 UA<br />
MD 0 1 30 0 0 2 10 5 11 0 0 7 0 0 0 28 0 85 2 0 0 1 1 3 47 8 4 0 1 5 3 1 1 6 8 0 0 3 0 0 0 0 0 0 17 291 MD<br />
RU 17 41 542 30 104 126 566 109 290 0 7 169 2 15 7 995 0 454 134 26 3 122 106 385 1612 13 7515 89 93 206 98 37 14 127 150 4 7 861 80 28 12 0 0 32 241 15471 RU<br />
LV 1 4 8 4 5 11 47 2 12 0 1 6 0 2 1 66 0 7 8 3 0 0 11 15 12 0 22 43 26 13 4 1 1 4 4 0 0 15 16 4 1 0 0 2 8 390 LV<br />
LT 1 4 10 6 2 11 52 2 14 0 1 6 0 2 0 121 0 10 11 3 0 0 15 16 14 0 21 13 68 15 5 1 1 4 4 0 0 6 13 4 1 0 0 2 8 466 LT<br />
CZ 15 12 7 3 0 34 352 2 72 0 1 21 1 5 0 413 1 11 19 1 1 0 16 2 5 0 4 1 1 1058 37 10 3 9 10 0 0 3 5 7 1 0 0 1 17 2159 CZ<br />
SK 6 3 19 1 0 9 68 5 172 0 0 23 0 1 0 219 1 27 11 0 0 0 4 2 11 0 4 1 1 68 133 9 4 20 22 0 0 3 2 2 0 0 0 1 25 879 SK<br />
SI 6 1 5 0 0 6 15 2 12 0 0 45 0 0 0 10 1 4 11 0 0 0 1 0 1 0 0 0 0 10 3 79 16 6 5 0 0 2 0 0 0 0 0 0 17 260 SI<br />
HR 7 2 17 0 0 15 35 7 72 0 0 71 0 1 0 35 1 19 29 0 1 0 3 0 3 0 1 0 0 25 13 27 102 114 47 0 0 6 1 1 1 0 0 1 50 708 HR<br />
BA 4 2 21 1 0 16 35 9 55 0 0 69 0 1 0 33 1 16 26 0 1 1 5 1 4 0 1 0 0 24 11 8 16 461 60 1 0 9 1 2 1 0 0 1 68 966 BA<br />
YU* 5 4 84 1 0 19 54 26 135 0 0 86 0 1 0 82 1 107 24 0 1 1 7 1 15 0 3 0 1 38 27 9 13 255 655 6 0 21 2 2 1 0 0 1 114 1803 YU*<br />
MK 1 0 53 0 0 3 6 32 11 0 0 21 0 0 0 9 0 14 9 0 0 1 1 0 2 0 0 0 0 4 3 1 1 14 35 13 0 19 0 0 0 0 0 0 45 300 MK<br />
CY 0 0 1 0 0 0 0 1 0 0 0 1 0 0 0 0 0 1 0 0 0 4 0 0 0 0 0 0 0 0 0 0 0 0 0 0 22 2 0 0 0 0 0 1 2 36 CY<br />
AM 0 0 4 0 0 0 1 2 1 0 0 1 0 0 0 1 0 1 0 0 0 18 0 0 2 0 2 0 0 0 0 0 0 1 1 0 1 62 0 0 0 0 0 0 3 104 AM<br />
MT 0 0 0 0 0 0 0 0 0 0 0 2 0 0 0 0 0 0 0 0 0 0 0 0 0 0 0 0 0 0 0 0 0 0 0 0 0 0 0 0 0 0 0 0 5 8 MT<br />
REM 6 9 321 4 11 79 97 207 83 0 2 365 0 3 1 121 23 120 266 4 2 257 22 24 299 2 469 16 10 39 22 17 8 94 101 6 35 4131 22 6 21 3 0 45 881 8253 REM<br />
BAS 4 37 13 134 90 83 380 3 53 0 6 22 1 17 6 476 1 21 53 93 1 0 104 22 23 0 100 41 33 74 20 7 3 17 16 0 0 81 540 52 6 0 0 28 28 2689 BAS<br />
NOS 5 212 11 77 1 561 562 3 32 1 60 40 3 165 26 184 10 9 210 13 3 1 2382 2 4 0 9 1 2 102 12 6 2 14 11 0 0 7 43 1285 74 0 0 200 45 6391 NOS<br />
ATL 7 127 9 33 22 691 423 7 39 93 415 87 4 46 33 155 844 19 2314 16 5 1 1768 14 25 1 1020 7 8 96 14 10 3 8 15 0 0 51 34 237 2560 5 0 2798 136 14200 ATL<br />
MED 23 17 1214 3 0 411 181 810 259 0 2 2142 1 7 0 209 42 254 970 1 6 149 40 5 76 3 11 1 2 114 60 80 89 388 289 12 69 586 4 13 57 24 0 296 3643 12562 MED<br />
BLS 4 4 484 2 1 15 74 76 101 0 0 70 0 1 0 167 0 424 26 1 0 85 9 19 636 14 113 2 5 37 28 7 4 53 92 2 3 73 4 2 1 0 0 34 152 2827 BLS<br />
SUM 271 1166 5949 535 489 4902 7049 2145 3093 119 809 5928 39 608 150 10640 1489 4250 8850 340 126 1471 8131 991 5217 79 10311 285 372 3412 956 556 384 2174 2399 74 174 6651 1130 2241 3043 48 0 3676 8330 121056 SUM<br />
AT BE BG DK FI FR DE GR HU IS IE IT LU NL NO PL PT RO ES SE CH TR GB BY UA MD RU LV LT CZ SK SI HR BA YU* MK CY REM BAS NOS ATL MED BLS NAT VUL SUM<br />
25
Source-receptor (country-to-country) matrix for oxidized nitrogen in 1997<br />
(Units: 100 tonnes of N , Emitters → , Receptors ↓)<br />
AT BE BG DK FI FR DE GR HU IS IE IT LU NL NO PL PT RO ES SE CH TR GB BY UA MD RU LV LT CZ SK SI HR BA YU* MK CY REM BAS NOS ATL MED BLS NAT VUL SUM<br />
AT 76 10 1 3 0 33 129 1 6 0 0 92 1 11 1 15 1 2 7 1 13 1 12 0 1 0 1 0 0 37 5 19 4 1 1 0 0 0 2 6 2 0 0 0 0 496 AT<br />
BE 0 128 0 1 0 66 56 0 0 0 1 3 2 51 1 1 1 0 8 0 1 0 42 0 0 0 0 0 0 2 0 0 0 0 0 0 0 0 1 29 6 0 0 0 0 403 BE<br />
BG 5 1 172 1 1 6 16 31 13 0 0 33 0 2 1 19 1 62 5 1 1 9 3 2 18 2 10 0 0 8 6 2 3 6 15 1 0 4 2 2 2 0 0 0 0 466 BG<br />
DK 1 8 0 37 1 19 37 0 1 1 2 3 0 16 7 10 1 0 4 8 1 0 58 1 0 0 4 0 0 3 1 0 0 0 0 0 0 1 24 37 8 0 0 0 0 296 DK<br />
FI 1 5 0 16 190 12 37 0 1 0 1 4 0 10 11 23 0 1 3 43 1 0 22 6 2 0 41 4 4 5 1 0 0 0 0 0 0 13 57 12 5 0 0 0 0 533 FI<br />
FR 10 117 2 8 1 1861 254 4 4 1 12 243 12 73 5 15 35 2 306 4 44 1 218 1 2 0 5 0 0 17 2 6 3 3 1 0 0 3 6 143 142 1 0 0 0 3567 FR<br />
DE 36 156 1 34 3 298 1568 1 6 1 8 60 14 202 10 90 5 1 38 14 59 0 231 3 2 0 10 1 1 129 5 3 1 1 0 0 0 2 45 130 28 0 0 0 0 3195 DE<br />
GR 3 1 52 1 1 14 13 205 5 0 0 82 0 2 1 11 2 16 18 1 2 13 5 1 7 1 6 0 0 5 2 2 2 6 7 1 1 10 2 2 4 0 0 0 0 506 GR<br />
HU 29 3 4 2 1 12 49 3 157 0 0 55 0 4 1 61 1 21 6 2 3 1 5 1 5 0 4 0 0 40 46 9 17 8 8 0 0 1 3 3 2 0 0 0 0 565 HU<br />
IS 0 2 0 1 1 5 5 0 0 8 3 1 0 2 2 2 1 0 2 1 0 0 19 0 0 0 1 0 0 1 0 0 0 0 0 0 0 0 1 4 7 0 0 0 0 67 IS<br />
IE 0 7 0 1 0 25 15 0 0 0 32 2 0 8 2 1 4 0 14 1 1 0 96 0 0 0 1 0 0 1 0 0 0 0 0 0 0 0 1 21 47 0 0 0 0 282 IE<br />
IT 31 9 9 3 1 151 81 24 13 0 1 1588 1 11 2 23 9 8 95 3 33 5 18 1 4 0 5 0 0 20 6 32 24 24 8 1 0 8 4 9 16 1 0 0 0 2280 IT<br />
LU 0 5 0 0 0 7 7 0 0 0 0 0 4 2 0 0 0 0 1 0 0 0 2 0 0 0 0 0 0 0 0 0 0 0 0 0 0 0 0 1 0 0 0 0 0 31 LU<br />
NL 0 41 0 2 0 32 72 0 0 0 2 2 1 157 1 2 1 0 5 1 1 0 52 0 0 0 0 0 0 2 0 0 0 0 0 0 0 0 1 44 6 0 0 0 0 426 NL<br />
NO 1 11 0 25 7 30 50 0 1 1 5 4 0 22 95 13 1 0 8 28 1 0 108 1 0 0 10 1 1 4 1 0 0 0 0 0 0 1 20 50 20 0 0 0 0 525 NO<br />
PL 21 25 3 42 8 61 371 3 29 0 2 38 2 44 9 1235 2 13 14 28 7 1 71 25 20 1 36 4 10 188 32 6 4 3 3 0 0 4 68 37 10 0 0 0 0 2483 PL<br />
PT 0 1 0 0 0 12 3 0 0 0 1 5 0 1 0 1 282 0 93 0 0 0 4 0 0 0 1 0 0 0 0 0 0 0 0 0 0 1 0 2 93 1 0 0 0 503 PT<br />
RO 16 4 50 3 2 17 59 17 54 0 0 85 0 7 1 87 1 257 8 3 4 11 9 7 50 7 20 0 1 32 30 7 8 14 22 1 0 5 5 4 3 0 0 0 0 911 RO<br />
ES 4 5 1 1 1 138 24 3 2 0 3 94 0 6 2 6 159 2 1468 1 4 1 26 0 1 0 3 0 0 4 1 3 2 2 1 0 0 4 1 10 157 7 0 0 0 2150 ES<br />
SE 3 19 0 72 45 48 111 0 3 1 4 10 1 33 40 48 1 1 9 190 3 0 99 5 2 0 26 4 5 12 2 1 1 1 0 0 0 7 117 58 15 0 0 0 0 996 SE<br />
CH 2 6 0 0 0 51 25 0 0 0 0 60 1 5 0 1 1 0 8 0 61 0 7 0 0 0 0 0 0 1 0 1 0 0 0 0 0 0 0 3 2 0 0 0 0 238 CH<br />
TR 7 3 64 4 3 25 32 93 10 0 0 100 0 5 3 36 2 51 28 4 3 780 11 6 66 5 92 1 1 10 6 3 3 7 8 1 12 66 5 5 8 0 0 0 0 1573 TR<br />
GB 2 30 0 8 1 111 83 0 1 1 35 12 1 53 11 9 8 1 36 5 3 1 1494 0 1 0 3 0 0 7 1 1 0 1 0 0 0 1 6 180 99 0 0 0 0 2206 GB<br />
BY 5 4 3 12 7 14 59 2 8 0 1 13 0 8 3 141 1 10 4 10 2 3 16 88 34 1 63 6 17 18 8 2 1 1 1 0 0 4 16 8 3 0 0 0 0 599 BY<br />
UA 15 6 38 12 8 23 95 23 42 0 1 64 0 11 5 270 1 106 10 12 4 39 21 59 344 21 197 3 8 44 35 6 5 8 9 1 0 17 18 10 6 0 0 0 0 1598 UA<br />
MD 1 0 4 1 0 1 4 2 2 0 0 4 0 1 0 11 0 19 0 1 0 2 1 2 16 7 4 0 0 2 1 0 0 0 1 0 0 1 1 0 0 0 0 0 0 88 MD<br />
RU 21 19 44 49 137 61 195 30 30 2 3 97 1 34 32 289 3 85 20 72 9 111 81 168 351 12 3423 28 40 54 25 9 6 9 9 1 1 242 96 39 27 0 0 0 0 5969 RU<br />
LV 2 4 1 11 8 9 33 0 2 0 1 4 0 7 2 29 0 1 2 12 1 0 13 7 3 0 16 7 9 6 1 0 0 0 0 0 0 4 24 7 2 0 0 0 0 230 LV<br />
LT 2 4 1 14 4 10 36 1 2 0 1 4 0 7 2 49 0 2 3 10 1 1 18 10 4 0 16 4 12 7 2 0 0 0 0 0 0 2 20 8 2 0 0 0 0 259 LT<br />
CZ 26 12 1 5 1 29 163 1 13 0 1 22 1 14 1 91 1 2 5 3 5 0 16 1 1 0 3 0 0 284 12 4 2 1 1 0 0 0 6 9 2 0 0 0 0 740 CZ<br />
SK 12 3 2 2 0 8 37 2 33 0 0 23 0 4 0 82 0 6 3 1 2 1 4 1 3 0 2 0 0 40 40 4 3 3 3 0 0 1 2 2 1 0 0 0 0 333 SK<br />
SI 12 1 1 0 0 6 11 1 3 0 0 64 0 1 0 4 0 1 4 0 1 0 1 0 0 0 0 0 0 5 1 18 9 2 1 0 0 0 0 1 1 0 0 0 0 151 SI<br />
HR 17 2 3 1 0 16 25 4 17 0 0 112 0 2 0 15 1 4 12 1 3 1 3 0 1 0 2 0 0 14 6 11 42 15 5 0 0 1 1 2 2 0 0 0 0 342 HR<br />
BA 11 2 3 1 0 15 25 5 16 0 0 99 0 3 1 15 1 4 10 1 3 2 4 0 1 0 2 0 0 14 6 5 14 27 6 0 0 2 1 2 2 0 0 0 0 305 BA<br />
YU* 12 3 13 2 1 15 32 11 38 0 0 94 0 4 1 32 1 26 9 2 3 2 6 1 5 1 4 0 0 21 14 4 12 23 34 2 0 4 2 3 3 0 0 0 0 437 YU*<br />
MK 1 0 7 0 0 3 3 16 2 0 0 20 0 0 0 3 0 3 3 0 0 1 1 0 1 0 1 0 0 1 1 1 1 2 4 1 0 3 0 0 1 0 0 0 0 82 MK<br />
CY 0 0 1 0 0 0 0 3 0 0 0 1 0 0 0 0 0 0 0 0 0 8 0 0 0 0 0 0 0 0 0 0 0 0 0 0 8 0 0 0 0 0 0 0 0 26 CY<br />
AM 0 0 0 0 0 0 0 0 0 0 0 1 0 0 0 0 0 0 0 0 0 10 0 0 0 0 2 0 0 0 0 0 0 0 0 0 0 14 0 0 0 0 0 0 0 38 AM<br />
MT 0 0 0 0 0 0 0 0 0 0 0 0 0 0 0 0 0 0 0 0 0 0 0 0 0 0 0 0 0 0 0 0 0 0 0 0 0 0 0 0 0 0 0 0 0 0 MT<br />
REM 18 11 45 15 24 143 93 160 17 1 2 491 1 17 10 70 28 39 159 21 12 309 48 17 72 4 373 6 6 24 10 10 11 20 14 2 15 778 34 21 59 5 0 0 0 3231 REM<br />
BAS 6 23 1 79 49 51 166 1 5 0 3 16 1 37 12 99 1 3 10 88 4 0 83 9 5 0 31 6 8 21 5 2 1 1 1 0 0 11 172 46 12 0 0 0 0 1067 BAS<br />
NOS 6 105 1 47 3 273 266 1 3 1 28 34 4 203 55 35 9 2 53 18 8 1 786 2 1 0 9 1 1 21 2 1 1 1 1 0 0 1 26 389 91 0 0 0 0 2489 NOS<br />
ATL 10 103 1 57 33 518 313 3 5 33 146 67 5 134 129 58 255 4 397 42 13 2 1058 8 6 0 103 2 3 29 4 3 1 2 1 0 0 8 44 296 1216 3 0 0 0 5117 ATL<br />
MED 21 8 43 6 4 193 74 203 16 1 1 733 1 13 5 41 21 27 239 6 14 94 30 3 17 2 20 0 1 20 8 16 20 24 12 2 12 40 8 14 48 6 0 0 0 2068 MED<br />
BLS 5 1 40 3 2 10 20 30 7 0 0 42 0 3 2 32 1 53 7 3 2 76 6 7 85 7 100 1 1 7 5 2 2 4 6 1 1 20 4 3 3 0 0 0 0 605 BLS<br />
SUM 455 910 609 585 548 4431 4747 884 565 53 299 4582 60 1230 467 3073 842 839 3134 643 333 1489 4808 445 1134 75 4655 81 136 1160 334 193 206 221 187 15 52 1295 848 1656 2162 26 0 0 0 50494 SUM<br />
AT BE BG DK FI FR DE GR HU IS IE IT LU NL NO PL PT RO ES SE CH TR GB BY UA MD RU LV LT CZ SK SI HR BA YU* MK CY REM BAS NOS ATL MED BLS NAT VUL SUM<br />
26
Source-receptor (country-to-country) matrix for reduced nitrogen in 1997<br />
(Units: 100 tonnes of N , Emitters → , Receptors ↓)<br />
AT BE BG DK FI FR DE GR HU IS IE IT LU NL NO PL PT RO ES SE CH TR GB BY UA MD RU LV LT CZ SK SI HR BA YU* MK CY REM BAS NOS ATL MED BLS NAT VUL SUM<br />
AT 239 7 1 2 0 23 234 0 12 0 0 80 1 8 0 8 1 2 6 1 25 0 5 1 2 0 1 0 0 32 10 18 3 1 1 0 0 1 0 0 0 0 0 0 0 726 AT<br />
BE 0 207 0 1 0 77 32 0 0 0 1 1 6 43 0 1 1 0 5 0 1 0 11 0 0 0 0 0 0 0 0 0 0 0 0 0 0 0 0 0 0 0 0 0 0 387 BE<br />
BG 3 0 257 0 0 2 7 41 9 0 0 14 0 1 0 9 0 111 3 0 1 5 1 2 36 6 4 0 0 3 4 1 2 4 52 11 0 10 0 0 0 0 0 0 0 597 BG<br />
DK 1 4 0 218 0 11 62 0 1 0 2 1 0 11 1 8 0 0 2 7 1 0 13 1 0 0 0 0 0 2 1 0 0 0 0 0 0 0 0 0 0 0 0 0 0 349 DK<br />
FI 1 3 0 10 145 7 22 0 1 0 1 1 0 5 5 17 0 1 2 20 0 0 7 10 5 0 13 4 4 2 1 0 0 0 1 0 0 19 0 0 0 0 0 0 0 310 FI<br />
FR 5 93 1 3 0 3181 118 1 1 0 10 96 10 31 0 4 14 1 195 1 62 0 57 0 1 0 1 0 0 3 0 1 1 1 1 0 0 12 0 0 0 0 0 0 0 3906 FR<br />
DE 57 103 1 39 0 229 2745 1 3 0 7 28 17 267 2 68 3 1 25 7 96 0 67 4 3 0 4 1 2 45 3 1 1 1 1 0 0 3 0 0 0 0 0 0 0 3835 DE<br />
GR 1 0 25 0 0 4 3 349 3 0 0 21 0 0 0 4 0 11 6 0 1 11 0 1 8 1 1 0 0 1 1 0 1 3 14 23 0 34 0 0 0 0 0 0 0 529 GR<br />
HU 35 1 3 1 0 5 29 2 235 0 0 30 0 2 0 22 0 44 4 1 2 0 1 2 20 1 2 0 0 20 55 12 19 5 27 1 0 3 0 0 0 0 0 0 0 586 HU<br />
IS 0 1 0 1 0 3 2 0 0 8 3 0 0 1 0 0 0 0 1 0 0 0 5 0 0 0 0 0 0 0 0 0 0 0 0 0 0 0 0 0 0 0 0 0 0 26 IS<br />
IE 0 3 0 1 0 18 6 0 0 0 484 1 0 3 0 0 1 0 6 0 0 0 53 0 0 0 0 0 0 0 0 0 0 0 0 0 0 0 0 0 0 0 0 0 0 580 IE<br />
IT 21 2 5 0 0 45 35 8 5 0 0 2022 0 2 0 7 3 4 37 0 31 1 2 1 3 0 1 0 0 5 2 13 10 9 9 1 0 22 0 0 0 0 0 0 0 2310 IT<br />
LU 0 6 0 0 0 10 7 0 0 0 0 0 9 1 0 0 0 0 1 0 0 0 1 0 0 0 0 0 0 0 0 0 0 0 0 0 0 0 0 0 0 0 0 0 0 35 LU<br />
NL 0 73 0 2 0 27 115 0 0 0 2 1 1 382 0 1 0 0 3 0 1 0 13 0 0 0 0 0 0 1 0 0 0 0 0 0 0 0 0 0 0 0 0 0 0 621 NL<br />
NO 1 7 1 26 3 20 36 0 1 0 5 2 0 12 101 13 1 1 5 23 1 0 32 3 2 0 5 1 1 2 1 0 0 1 1 0 0 2 0 0 0 0 0 0 0 312 NO<br />
PL 21 13 4 30 2 34 292 3 19 0 2 19 1 27 2 1557 1 19 10 18 7 1 20 84 110 3 27 4 17 92 49 4 3 2 6 1 0 7 0 0 0 0 0 0 0 2510 PL<br />
PT 0 0 0 0 0 5 0 0 0 0 0 1 0 0 0 0 297 0 64 0 0 0 0 0 0 0 0 0 0 0 0 0 0 0 0 0 0 2 0 0 0 0 0 0 0 370 PT<br />
RO 14 2 52 1 0 8 36 15 70 0 0 44 0 4 0 41 1 918 6 1 3 6 3 11 191 49 12 0 1 16 23 4 6 11 58 4 0 12 0 0 0 0 0 0 0 1622 RO<br />
ES 1 2 1 0 0 99 5 1 1 0 2 20 0 1 0 1 114 0 1547 0 2 0 4 0 0 0 0 0 0 1 0 1 1 1 1 0 0 22 0 0 0 0 0 0 0 1828 ES<br />
SE 2 10 0 68 20 29 77 0 2 0 3 4 1 19 24 38 1 1 6 220 2 0 27 9 5 0 11 3 5 6 2 1 0 1 1 0 0 8 0 0 0 0 0 0 0 607 SE<br />
CH 2 5 0 0 0 67 38 0 0 0 0 47 1 4 0 1 1 0 8 0 271 0 4 0 0 0 0 0 0 1 0 0 0 0 0 0 0 1 0 0 0 0 0 0 0 452 CH<br />
TR 3 1 37 1 0 9 11 42 7 0 0 32 0 1 0 16 1 50 11 0 1 1568 1 6 112 10 42 0 1 4 3 2 1 5 14 4 5 205 0 0 0 0 0 0 0 2204 TR<br />
GB 1 18 1 5 0 100 43 0 1 0 114 5 1 23 1 4 3 0 18 2 3 0 1006 0 1 0 0 0 0 3 0 0 0 0 1 0 0 1 0 0 0 0 0 0 0 1358 GB<br />
BY 5 2 3 6 2 8 36 1 6 0 1 6 0 4 1 128 0 15 3 4 2 1 6 944 192 4 52 12 40 8 6 1 1 2 4 0 0 8 0 0 0 0 0 0 0 1515 BY<br />
UA 12 3 27 6 1 11 55 15 35 0 1 31 0 6 1 212 1 184 7 4 3 19 6 219 3515 131 167 2 9 21 30 4 4 7 19 3 0 20 0 0 0 0 0 0 0 4789 UA<br />
MD 0 0 3 0 0 0 2 1 1 0 0 2 0 0 0 5 0 53 0 0 0 1 0 4 107 107 2 0 0 1 1 0 0 0 1 0 0 1 0 0 0 0 0 0 0 296 MD<br />
RU 15 10 35 23 47 30 113 18 27 0 2 43 1 15 7 217 1 102 13 27 6 93 22 343 851 23 4789 31 43 28 19 5 4 9 20 3 1 324 0 0 0 0 0 0 0 7361 RU<br />
LV 1 2 1 6 2 5 22 0 1 0 1 2 0 4 1 27 0 2 1 7 1 0 5 24 7 0 9 40 32 3 1 0 0 0 1 0 0 17 0 0 0 0 0 0 0 226 LV<br />
LT 1 2 1 8 1 6 27 1 1 0 1 2 0 5 1 54 0 2 2 6 1 0 7 53 12 1 13 11 102 3 2 0 0 0 1 0 0 4 0 0 0 0 0 0 0 332 LT<br />
CZ 52 6 1 4 0 18 202 0 9 0 0 11 1 9 0 54 0 2 3 2 6 0 5 2 4 0 2 0 1 238 25 3 2 1 1 0 0 1 0 0 0 0 0 0 0 664 CZ<br />
SK 16 2 2 1 0 5 28 1 41 0 0 13 0 3 0 59 0 9 2 1 2 0 1 3 20 1 2 0 1 29 118 3 3 2 5 0 0 2 0 0 0 0 0 0 0 377 SK<br />
SI 17 0 1 0 0 2 7 0 4 0 0 39 0 0 0 1 0 1 2 0 1 0 0 0 1 0 0 0 0 2 1 52 8 1 1 0 0 1 0 0 0 0 0 0 0 144 SI<br />
HR 17 1 2 0 0 6 13 2 24 0 0 58 0 1 0 5 1 4 6 0 2 0 0 0 3 0 0 0 0 6 6 19 65 30 13 0 0 3 0 0 0 0 0 0 0 288 HR<br />
BA 11 1 2 1 0 6 15 2 15 0 0 47 0 1 0 7 0 4 6 0 2 0 1 0 3 0 0 0 0 8 6 4 18 70 26 1 0 5 0 0 0 0 0 0 0 264 BA<br />
YU* 10 1 9 1 0 6 19 7 41 0 0 43 0 2 0 15 0 44 5 0 2 1 2 1 12 1 1 0 0 11 13 3 11 26 317 13 0 19 0 0 0 0 0 0 0 636 YU*<br />
MK 1 0 5 0 0 1 2 18 1 0 0 8 0 0 0 1 0 3 1 0 0 1 0 0 1 0 0 0 0 1 1 0 1 1 21 38 0 19 0 0 0 0 0 0 0 126 MK<br />
CY 0 0 0 0 0 0 0 0 0 0 0 0 0 0 0 0 0 0 0 0 0 6 0 0 0 0 0 0 0 0 0 0 0 0 0 0 4 1 0 0 0 0 0 0 0 12 CY<br />
AM 0 0 0 0 0 0 0 0 0 0 0 0 0 0 0 0 0 0 0 0 0 43 0 0 1 0 1 0 0 0 0 0 0 0 0 0 0 121 0 0 0 0 0 0 0 169 AM<br />
MT 0 0 0 0 0 0 0 0 0 0 0 0 0 0 0 0 0 0 0 0 0 0 0 0 0 0 0 0 0 0 0 0 0 0 0 0 0 0 0 0 0 0 0 0 0 0 MT<br />
REM 6 3 18 4 4 38 25 41 7 0 1 122 0 3 1 23 9 23 45 5 4 272 5 15 95 3 274 9 5 5 4 3 3 7 27 9 3 3616 0 0 0 0 0 0 0 4736 REM<br />
BAS 5 14 1 191 36 32 244 0 4 0 3 6 1 28 7 122 1 3 7 130 3 0 27 18 13 0 18 16 16 12 4 1 1 1 2 0 0 48 0 0 0 0 0 0 0 1014 BAS<br />
NOS 6 118 1 138 1 430 318 1 2 0 45 13 2 186 20 30 4 1 32 18 9 0 575 2 2 0 3 0 1 12 2 1 1 1 2 0 0 3 0 0 0 0 0 0 0 1981 NOS<br />
ATL 5 58 1 37 10 641 170 1 3 15 382 24 3 67 39 33 193 2 292 15 11 0 625 7 8 0 44 2 3 13 2 1 1 1 1 0 0 18 0 0 0 0 0 0 0 2729 ATL<br />
MED 18 3 19 1 0 123 25 189 8 0 1 671 0 3 0 11 11 29 183 1 10 265 3 2 29 3 6 0 0 6 6 13 20 22 39 11 12 232 0 0 0 0 0 0 0 1975 MED<br />
BLS 3 1 41 1 0 3 11 21 6 0 0 20 0 1 0 18 0 113 4 1 1 90 1 15 521 36 96 0 1 4 3 1 1 4 13 3 0 38 0 0 0 0 0 0 0 1072 BLS<br />
SUM 610 787 562 836 276 5382 5290 784 608 24 1074 3632 57 1186 215 2843 663 1765 2589 524 575 2391 2626 1788 5896 381 5609 138 286 653 405 174 191 233 703 130 27 4900 0 0 0 0 0 0 0 56814 SUM<br />
AT BE BG DK FI FR DE GR HU IS IE IT LU NL NO PL PT RO ES SE CH TR GB BY UA MD RU LV LT CZ SK SI HR BA YU* MK CY REM BAS NOS ATL MED BLS NAT VUL SUM<br />
27
Table 1.1: Emissions of sulphur dioxide (100 tonnes as S per year)<br />
1980 1985 1986 1987 1988 1989 1990 1991 1992 1993 1994 1995 1996 1997 2000 2005 2010<br />
Africa, north1 2065 2065 2065 2065 2065 2065 2065 2065 2065 2065 2065 2065 2065 2065 2065 2065 2065<br />
Albania 360 360 360 360 360 360 360 360 360 360 360 360 360 360 360 360 360<br />
Armenia 555 500 555 555 520 315 360 300 220 30 20 15 10 2 2 2 2<br />
Austria 2000 975 880 800 575 510 455 415 315 300 280 260 260 285 300 300 300<br />
Belarus 3700 3450 3450 3805 3600 3340 3185 3260 2290 1910 1620 1375 1230 1040 2760 2450 2400<br />
Belgium 4140 2000 1885 1835 1770 1625 1610 1630 1550 1445 1255 1235 1200 1200 1240 1160 1075<br />
Bosnia and Herzegovina 2400 2400 2400 2400 2400 2400 2400 2400 2400 2400 2400 2400 2400 2400 2400 2400 2400<br />
Bulgaria 10250 11570 11835 12100 11140 10900 10100 8385 5640 7130 7400 7485 7100 6825 6870 6150 5635<br />
Croatia 750 825 840 855 870 885 900 540 535 570 445 340 360 400 665 625 585<br />
Cyprus 185 185 185 205 215 235 275 205 225 215 230 230 230 235 215 185 195<br />
Czech Republic 11285 11385 10885 10820 10330 9990 9380 8880 7690 7095 6350 5455 4730 3505 2310 2105 1880<br />
Denmark 2250 1695 1410 1250 1210 955 910 1215 950 780 775 750 930 545 450 450 450<br />
Estonia 1435 1270 1280 1275 1270 1270 1260 1230 935 770 745 590 625 595 1260 1260 1260<br />
Finland 2920 1910 1655 1640 1510 1220 1300 970 705 620 560 480 525 500 580 580 580<br />
France 16690 7350 6710 6450 6130 6670 6490 6880 6190 5605 5065 4945 5155 5155 4340 3850 3685<br />
Georgia 810 810 810 810 810 810 810 810 810 810 810 810 810 810 810 810 810<br />
Germany, former East 21750 26825 27065 27215 26315 26270 22130 15625 12305 10620 9210 7590 5570 5300 4695 3575 1985<br />
Germany, former West 15820 11835 11140 9520 6075 4710 4435 4355 4190 4070 3120 2920 2145 2040 1805 1375 765<br />
Greece 2000 2500 2510 2520 2525 2535 2545 2760 2770 2750 2690 2765 2715 2715 2975 2900 2850<br />
Hungary 8165 7020 6810 6425 6090 5510 5050 4565 4135 3810 3705 3525 3365 3285 4490 4080 3265<br />
Iceland 90 90 90 80 90 85 120 115 120 125 120 120 120 125 145 145 150<br />
Ireland 1110 700 810 870 760 810 890 895 805 785 885 805 735 825 775 775 775<br />
Italy 18785 9505 9645 10145 9815 9270 8255 7695 6970 6665 6355 6610 6610 6610 5020 4235 4210<br />
Kazakhstan1 700 700 700 700 700 700 700 700 700 700 700 700 700 700 700 700 700<br />
Latvia 595 595 595 595 595 595 595 450 395 365 430 295 295 295 385 570 785<br />
Lithuania 1555 1520 1580 1580 1500 1490 1110 1170 695 625 585 470 465 385 820 775 725<br />
Luxembourg 120 85 85 80 80 75 75 75 70 70 65 45 40 40 20 20 20<br />
Netherlands 2450 1290 1320 1315 1250 1020 1010 865 860 820 730 735 675 620 460 460 490<br />
Norway 685 490 455 365 340 290 265 220 180 175 170 170 165 150 170 170 170<br />
Poland 20500 21500 21000 21000 20900 19550 16050 14975 14100 13625 13025 11880 11840 10905 16050 16050 16050<br />
Portugal 1330 990 1155 1320 1480 1645 1810 1760 2100 1780 1680 1865 1865 1865 1520 1470 1470<br />
Republic of Moldova 1540 1410 1485 1585 1365 1190 1155 920 630 180 115 135 95 85 700 650 650<br />
Romania 5275 6275 6465 6525 7345 7585 6555 5205 4755 4640 4560 4560 4560 4560 6555 6555 6555<br />
Russian Federation1 35805 30955 28535 28110 25725 23385 22300 21960 19195 17280 14915 14190 13425 12245 22200 21485 21485<br />
Slovakia 3900 3065 3020 3070 2945 2865 2715 2230 1900 1625 1195 1195 1135 1010 1050 1050 1050<br />
Slovenia 1170 1205 1235 1110 1050 1060 970 905 950 915 885 595 550 600 460 225 185<br />
Spain2 16595 10950 9805 9515 7935 9750 11330 11115 10975 10355 10305 10305 10305 10305 10715 10715 10715<br />
Sweden 2455 1330 1360 1140 1120 800 595 480 440 435 410 395 415 345 360 335 335<br />
Switzerland 580 380 340 310 280 245 215 205 190 170 155 170 150 130 130 130 135<br />
The FYR Macedonia 85 85 85 85 85 85 85 85 85 85 85 85 85 85 85 85 85<br />
Turkey 4300 1610 1770 1770 1770 1770 1770 1770 1770 1770 1770 1770 1770 1770 1770 1770 1770<br />
Ukraine 19245 17315 16965 16320 16055 15365 13910 12690 11880 10970 8575 8195 6465 5660 11550 11550 11550<br />
United Kingdom 24310 18645 19500 19435 19080 18465 18655 17740 17280 15695 13395 11715 10085 8280 6450 5100 4250<br />
Yugoslavia 2030 2390 2350 2420 2510 2530 2540 2230 1980 2005 2120 2310 2170 2610 3400 4445 5675<br />
Other Asiatic areas1 4345 4345 4345 4345 4345 4345 4345 4345 4345 4345 4345 4345 4345 4345 4345 4345 4345<br />
The Baltic Sea 1140 1140 1140 1140 1140 1140 1140 1140 1140 1140 1140 1140 1140 1140 1140 1140 1140<br />
The Mediterranean Sea 60 60 60 60 60 60 60 60 60 60 60 60 60 60 60 60 60<br />
The North Sea 2270 2270 2270 2270 2270 2270 2270 2270 2270 2270 2270 2270 2270 2270 2270 2270 2270<br />
Rem. N.E. Atlantic1 4505 4505 4505 4505 4505 4505 4505 4505 4505 4505 4505 4505 4505 4505 4505 4505 4505<br />
Natural Oceanic1 3715 3715 3715 3715 3715 3715 3715 3715 3715 3715 3715 3715 3715 3715 3715 3715 3715<br />
Volcanic3 10720 10720 10720 10905 10565 12465 14035 8225 11175 10135 9590 10000 10000 10000 10000 10000 10000<br />
Total 301495 256765 251835 249290 237155 231700 219765 197565 182515 171385 157960 150945 142540 134490 158115 152180 148565<br />
28
Table 1.2: Emissions of nitrogen oxides (100 tonnes as N per year)<br />
1980 1985 1986 1987 1988 1989 1990 1991 1992 1993 1994 1995 1996 1997 2000 2005 2010<br />
Africa, north1 292 292 292 292 292 292 292 292 292 292 292 292 292 292 292 292 292<br />
Albania 73 73 73 73 73 73 73 73 73 73 73 73 73 73 73 73 73<br />
Armenia 46 137 161 158 170 155 140 122 67 37 37 46 33 46 140 140 140<br />
Austria 703 670 660 648 618 597 590 603 572 536 560 517 496 523 469 469 469<br />
Belarus 712 724 785 800 797 800 867 855 682 630 618 593 527 575 660 560 548<br />
Belgium 1345 989 965 1029 1050 1087 1044 1047 1077 1047 1053 1032 1017 1017 1044 1044 1044<br />
Bosnia and Herzegovina 243 243 243 243 243 243 243 243 243 243 243 243 243 243 243 243 243<br />
Bulgaria 1266 1266 1266 1266 1263 1251 1144 810 727 737 700 810 788 685 1157 1065 883<br />
Croatia 265 265 265 265 265 265 265 195 170 180 198 195 204 225 265 253 253<br />
Cyprus 49 49 49 49 55 58 61 52 61 64 64 64 64 70 64 70 70<br />
Czech Republic 2852 2529 2514 2483 2611 2800 2258 2207 2124 1747 1324 1254 1315 1287 1132 1102 1068<br />
Denmark 858 916 974 950 919 858 858 977 840 834 828 761 877 755 618 584 584<br />
Estonia 213 213 213 213 213 210 207 192 119 116 128 128 134 137 207 207 207<br />
Finland 898 837 843 877 892 916 913 883 861 858 858 788 813 791 682 682 682<br />
France 5548 4915 4924 4961 4915 5393 4824 4967 4860 4699 5119 5070 4994 4994 4824 4824 4824<br />
Georgia 572 572 572 572 572 572 572 572 572 572 572 572 572 572 572 572 572<br />
Germany, former East 2182 2240 2252 2283 2261 2270 2130 1802 1537 1446 1284 1196 1160 1108 2130 1309 776<br />
Germany, former West 7965 7730 7749 7387 7018 6531 6066 5871 5487 5101 4863 4727 4583 4380 6066 5174 3068<br />
Greece 931 931 953 977 998 1023 1044 1074 1071 1062 1090 1090 1138 1138 1044 1044 1044<br />
Hungary 831 797 803 807 785 749 724 618 557 560 572 578 597 603 700 639 597<br />
Iceland 64 64 67 73 76 76 79 82 85 88 88 85 91 88 85 88 91<br />
Ireland 222 277 304 350 371 387 350 362 380 371 356 350 368 377 320 320 320<br />
Italy 4985 4912 5143 5512 5643 5834 5898 6038 6117 6057 5445 5381 5381 5381 4930 4590 4370<br />
Kazakhstan1 231 231 231 231 231 231 231 231 231 231 231 231 231 231 231 231 231<br />
Latvia 283 283 283 283 283 283 283 186 161 140 146 128 107 107 170 213 247<br />
Lithuania 463 505 514 520 523 527 481 505 298 237 234 198 198 173 332 335 335<br />
Luxembourg 70 64 64 67 67 70 70 70 70 70 70 61 67 67 58 58 58<br />
Netherlands 1774 1793 1787 1823 1832 1777 1765 1729 1692 1628 1552 1516 1525 1430 1765 758 995<br />
Norway 572 639 688 685 673 670 663 633 630 654 645 645 670 676 481 481 481<br />
Poland 3740 4565 4596 4657 4717 4504 3896 3667 3439 3409 3363 3409 3512 3524 2453 2453 2675<br />
Portugal 292 292 444 600 752 907 1059 1117 1190 1163 1190 1239 1239 1239 1059 1059 1059<br />
Republic of Moldova 177 204 219 216 225 213 192 204 119 46 55 73 33 91 91 107 103<br />
Romania 1592 1650 1701 1765 1796 1762 1662 1412 1087 968 971 971 971 971 1662 1662 1662<br />
Russian Federation1 5277 5792 5694 8074 7177 7770 10957 10120 9413 9295 8172 7822 7508 7240 10957 10957 10957<br />
Slovakia 600 600 600 600 645 691 685 645 578 557 527 551 396 374 685 685 685<br />
Slovenia 155 161 177 173 180 177 189 164 167 186 201 204 213 216 137 116 94<br />
Spain 2891 2553 2599 2715 2715 3019 3582 3734 3807 3722 3722 3722 3722 3722 2715 2715 2715<br />
Sweden 1230 1297 1315 1330 1315 1272 1029 1032 1001 986 1007 916 919 852 831 633 609<br />
Switzerland 517 545 539 530 523 517 505 487 466 441 423 414 396 380 356 335 344<br />
The FYR Macedonia 18 18 18 18 18 18 18 18 18 18 18 18 18 18 18 18 18<br />
Turkey 837 1108 1205 1297 1254 1412 1513 1558 1628 1710 1908 2106 2106 2106 2907 3731 5083<br />
Ukraine 3485 3223 3384 3330 3317 3241 3339 3010 2526 2130 1729 1616 1421 1385 3330 3330 3330<br />
United Kingdom 7642 7405 7645 7968 8141 8278 8175 7864 7639 7137 6854 6403 6175 5624 4739 3941 3533<br />
Yugoslavia 143 177 177 183 192 189 201 173 149 164 158 180 173 201 268 350 447<br />
Other Asiatic areas1 645 645 645 645 645 645 645 645 645 645 645 645 645 645 645 645 645<br />
The Baltic Sea 1071 1071 1071 1071 1071 1071 1071 1071 1071 1071 1071 1071 1071 1071 1071 1071 1071<br />
The Mediterranean Sea 40 40 40 40 40 40 40 40 40 40 40 40 40 40 40 40 40<br />
The North Sea 1972 1972 1972 1972 1972 1972 1972 1972 1972 1972 1972 1972 1972 1972 1972 1972 1972<br />
Rem. N.E. Atlantic1 3853 3853 3853 3853 3853 3853 3853 3853 3853 3853 3853 3853 3853 3853 3853 3853 3853<br />
Natural Oceanic 0 0 0 0 0 0 0 0 0 0 0 0 0 0 0 0 0<br />
Volcanic 0 0 0 0 0 0 0 0 0 0 0 0 0 0 0 0 0<br />
Total 72687 72328 73533 76912 76260 77551 78720 76078 72471 69823 67124 65849 64942 63572 70542 67090 65459<br />
29
Table 1.3: Emissions of ammonia (100 tonnes as N per year)<br />
1980 1985 1986 1987 1988 1989 1990 1991 1992 1993 1994 1995 1996 1997 2000 2005 2010<br />
Africa, north1 1935 1935 1935 1935 1935 1935 1935 1935 1935 1935 1935 1935 1935 1935 1935 1935 1935<br />
Albania 255 255 255 255 255 255 255 255 255 255 255 255 255 255 255 255 255<br />
Armenia 25 16 16 16 16 1.6 0.5 0.9 0.4 0.08 0.05 0.05 0.03 0.03 0.5 0.5 0.5<br />
Austria 659 675 675 667 667 642 626 601 609 618 642 642 626 618 626 626 626<br />
Belarus 1804 1804 1804 1804 1804 1804 1804 1804 1804 1804 1804 1804 1804 1804 1804 1804 1804<br />
Belgium 733 733 758 782 807 832 856 766 758 799 791 799 799 799 856 856 856<br />
Bosnia and Herzegovina 255 255 255 255 255 255 255 255 255 255 255 255 255 255 255 255 255<br />
Bulgaria 1186 1186 1186 1186 1186 1186 1186 1021 914 898 832 815 684 634 898 1038 1038<br />
Croatia 305 305 305 305 305 305 305 255 222 206 198 206 189 198 272 272 272<br />
Cyprus 33 33 33 33 33 33 33 33 33 33 33 33 33 33 33 33 33<br />
Czech Republic 1285 1285 1285 1285 1285 1285 1285 1104 947 815 749 708 667 667 1285 1285 1285<br />
Denmark 1161 1038 1005 964 947 931 1005 906 939 980 931 939 815 840 848 848 848<br />
Estonia 239 239 239 239 239 239 239 239 239 239 239 239 239 239 239 239 239<br />
Finland 288 288 288 288 288 288 288 288 288 288 288 288 288 280 264 189 189<br />
France 5765 5765 5765 5765 5765 5765 5765 5682 5567 5485 5501 5501 5501 5501 5765 5765 5765<br />
Georgia 799 799 799 799 799 799 799 799 799 799 799 799 799 799 799 799 799<br />
Germany, former East 2166 2215 2191 2182 2224 2158 1738 1145 1038 1013 1021 1046 1046 1054 1738 1738 1738<br />
Germany, former West 4711 4842 4776 4711 4612 4579 4554 4422 4356 4307 4332 4274 4299 4282 4554 4554 4554<br />
Greece 881 881 881 881 881 881 881 881 881 881 881 881 881 881 881 881 881<br />
Hungary 1614 1556 1515 1474 1433 1392 1351 1104 1013 947 939 955 642 626 1400 1318 1235<br />
Iceland 25 25 25 25 25 25 25 25 25 25 25 25 25 25 25 25 25<br />
Ireland 1038 1038 1038 1038 1038 1038 1038 1038 1038 1038 1013 1021 1054 1087 1038 1038 1038<br />
Italy 3945 4011 4076 4093 4109 3961 3838 3714 3624 3698 3780 3796 3796 3796 3648 3673 3698<br />
Kazakhstan1 148 148 148 148 148 148 148 148 148 148 148 148 148 148 148 148 148<br />
Latvia 362 362 362 362 362 362 362 346 272 165 140 140 140 140 362 362 362<br />
Lithuania 700 733 733 741 733 708 692 700 667 659 659 313 296 288 692 692 692<br />
Luxembourg 58 58 58 58 58 58 58 58 58 58 58 58 58 58 49 49 49<br />
Netherlands 1927 2042 2125 2125 1952 1911 1861 1878 1482 1573 1367 1202 1202 1194 1194 675 1120<br />
Norway 189 189 189 189 173 189 189 198 206 206 206 214 222 214 189 189 189<br />
Poland 4529 4529 4529 4529 4529 4529 4184 3706 2816 3146 3162 3129 2998 2882 4184 4184 4184<br />
Portugal 807 807 807 807 807 807 807 807 791 774 774 799 799 799 807 807 807<br />
Republic of Moldova 387 387 387 387 387 387 387 387 387 387 387 387 387 387 387 387 387<br />
Romania 2800 2825 2882 2709 2792 2808 2471 2199 2100 1836 1820 1820 1820 1820 2471 2471 2471<br />
Russian Federation1 9792 10204 10591 10516 10451 10360 9808 9561 8927 7436 6358 6786 6168 6012 9808 9808 9808<br />
Slovakia 511 511 511 511 511 511 511 511 502 420 329 371 412 412 511 511 511<br />
Slovenia 198 198 198 198 198 198 198 198 189 189 181 181 181 181 222 222 222<br />
Spain 2907 2907 2907 2907 2907 2907 2907 2915 2899 2841 2833 2833 2833 2833 2907 2907 2907<br />
Sweden 445 445 445 445 445 436 420 420 502 502 502 502 502 527 527 395 395<br />
Switzerland 634 609 609 601 601 593 593 593 593 585 585 585 585 585 576 568 560<br />
The FYR Macedonia 140 140 140 140 140 140 140 140 140 140 140 140 140 140 140 140 140<br />
Turkey 2644 2644 2644 2644 2644 2644 2644 2644 2644 2644 2644 2644 2644 2644 2644 2644 2644<br />
Ukraine 6004 6004 6004 6004 6004 6004 6004 6004 6004 6004 6004 6004 6004 6004 6004 6004 6004<br />
United Kingdom 2742 2742 2742 2742 2742 2742 2742 2726 2701 2685 2668 2644 2627 2660 2742 2742 2742<br />
Yugoslavia 741 741 741 741 741 741 741 741 741 741 741 741 741 741 741 741 741<br />
Other Asiatic areas1 2495 2495 2495 2495 2495 2495 2495 2495 2495 2495 2495 2495 2495 2495 2495 2495 2495<br />
The Baltic Sea 0 0 0 0 0 0 0 0 0 0 0 0 0 0 0 0 0<br />
The Mediterranean Sea 0 0 0 0 0 0 0 0 0 0 0 0 0 0 0 0 0<br />
The North Sea 0 0 0 0 0 0 0 0 0 0 0 0 0 0 0 0 0<br />
Rem. N.E. Atlantic1 0 0 0 0 0 0 0 0 0 0 0 0 0 0 0 0 0<br />
Natural Oceanic 0 0 0 0 0 0 0 0 0 0 0 0 0 0 0 0 0<br />
Volcanic 0 0 0 0 0 0 0 0 0 0 0 0 0 0 0 0 0<br />
Total 72265 72899 73352 72981 72726 72265 70420 67645 64804 62951 61444 61353 60035 59772 69218 68567 68946<br />
30
Overwiew of Reported Emissions<br />
31
2. Overview of <strong>EMEP</strong> reported emission data<br />
Since the start of the LRTAP Convention, the improvement in emission reporting to <strong>EMEP</strong> has<br />
been massive, aided greatly by the establishment of the relevant guidelines. Emission reporting<br />
has improved markedly since last year, specially concerning national and sectoral totals.<br />
However, Parties show still difficulties on reporting reporting gridded data and projections<br />
within the established deadlines.<br />
Following the recommendations from the last meeting of the Task Force on Emissions<br />
Inventories in June 1999, this chapter reviews the <strong>EMEP</strong> emission reporting requirements and<br />
evaluates them in relation to the main objectives of the acidification programme for its seventh<br />
phase. A complete report on the present status of the UN/ECE-<strong>EMEP</strong> emission data and the<br />
emission data used for modilling purposes at MSC-W is given in Mylona (1999). Updated<br />
emission values up to 1997 will be available on the Internet at http://www.emep.int from mid-<br />
September 1999.<br />
2.1 Main objectives for the <strong>EMEP</strong> emission data<br />
Under the Convention on Long Range Transboundary Air Pollution (LRTAP) the supply of<br />
good quality emission data is essential in:<br />
a) assessing the state and trends of air pollution in Europe,<br />
b) establishing the compliance of the Parties with protocol commitments, and<br />
c) providing a basis for development of cost-effective abatement strategies,<br />
These are the main objectives for the work of <strong>EMEP</strong> during its seventh phase. The quality of<br />
the emission data is measured in terms of its:<br />
• completeness,<br />
• transparency<br />
• consistency<br />
• comparability<br />
• accuracy<br />
The assessment of trends in emissions and depositions to survey the progress towards<br />
environmental goals imposes an increased demand for completenes, consistency and<br />
transparency in the emission data. The completeness of the data concerns both the temporal<br />
evolution and the geographical distribution.<br />
33
The review of compliance with international agreements for emission reductions imposes<br />
strong requirements on the accuracy of emission values and an increased need for the<br />
evaluation of uncertainties and verification of the emission data.<br />
The evaluation of the effects of specific control measures requires transparent and consistent<br />
andemissions inventories where the different contributions to total emissions can be separated.<br />
The requirement of transparencyand comparability is specially important when national<br />
inventories are aggregated to broarder geographical areas, like in the case of <strong>EMEP</strong>, and the<br />
need for international harmonisation becomes then significant.<br />
In this sense, emission reporting to UN/ECE-<strong>EMEP</strong> is greatly assisted by the Task Force of<br />
Emission Inventories which is an international forum for technical exchange of information<br />
and was established to harmonise methodologies in emission estimation and reporting. An<br />
important tool developed for this purpose is Joint <strong>EMEP</strong>/CORINAIR Atmospheric Emission<br />
Inventory Guidebook.<br />
2.2. <strong>EMEP</strong> emission reporting requirements<br />
The objectives for the <strong>EMEP</strong> emission data specified above translate into concrete operational<br />
requirements on the type of data and reporting that should be submitted to UN/ECE-<strong>EMEP</strong>.<br />
The requirements for estimating and reporting emission data under the CLRTAP are presently<br />
drafted for consideration by the countries in EB.AIR/GE.1/1997/2.<br />
During the last meeting of the Task Force on Emission Inventory, the draft reporting<br />
procedures were discussed and reviewed. It was agreed the reporting procedures could be<br />
revised in order to increase their clarity. Task Force members were invited to provide their<br />
comments to MSC-W and to the UNECE Secretariat and new revised guidelines would be<br />
circulated for comments. In order to stimulate these comments, Table 2.1 summarises the<br />
reporting requirements, as they are interpreted by MSC-W.<br />
It has been suggested that the emission data requirements as they appear tin Table 2.1 may not<br />
be sufficient to secure that the <strong>EMEP</strong> programme can reach its objectives. The main concern is<br />
on the transparency of the emission data and SNAP level 2 has been suggested as the necessary<br />
level of disaggregation of sectoral data for <strong>EMEP</strong> assessment purposes. Studies on the effects<br />
of different reduction strategies will profit from the disaggregation of emission data to SNAP<br />
level 2.<br />
Another suggestion is to report the height distribution of emissions. The actual height of<br />
sources will be most useful for atmospheric modelling, which at present can discern better<br />
different atmospheric levels than what did in the past. With the use of Eulerian dispersion<br />
models, information on the height distribution of emissions has become increasingly important<br />
and needs to be completed or updated as soon as possible. Information on the position and<br />
characteristics of LPS is extremely useful in sheding light on issues related to both emission<br />
patterns, monitoring data and model results.<br />
34
Emission reporting requirements<br />
Table 2.1 Emission reporting requirements for acidification, as interpreted by MSC-W_<br />
Methods Comments<br />
SNAP<br />
level<br />
Spatial<br />
resolution<br />
Temporal<br />
resolution<br />
Reporting<br />
frequency<br />
Emissions of So 2 , Nox and NH 3<br />
General reporting:<br />
National annual totals 1 year annual - - ECM*<br />
Sectoral emissions at SNAP level 1 1 year annual - 1 (11 sectors) ECM*<br />
Emissions projections for 2000,2005,2010 1 year annual - 1 (11 sectors) ECM*<br />
National totals from low and high sources 1year annual 1 (11 sectors) ECM*<br />
Specific reporting for modelling:<br />
Spatial distribution of annual totals 5 years annual 50x50 km 2* - ECM* SCRA*<br />
Spatial distribution of sectoral emissions 5 years annual 50x50 km 2* 1 (11 sectors) ECM* SCRA*<br />
Spatial distribution of low sources (100m) 5 years annual 50x50 km 2* 1 (11 sectors) ECM* SCRA*<br />
Spatial distribution of large point sources 5 years annual 50x50 km 2* 1 (11 sectors) ECM* SCRA*<br />
Extended reporting:<br />
National annual totals 5 years monthly -<br />
50x50 km 2* 1(11 sectors) ECM*<br />
Sectoral emissions 5 years monthly<br />
Large Point sources 5 years monthly 50x50 km 2* 1 (11 sectors) ECM* Stack heightI<br />
Comments:<br />
50x50 km2* : gridded data in the <strong>EMEP</strong> 50x50 km2 polar stereographic grid,<br />
ECM*: <strong>EMEP</strong>/CORINAIR Manual methods : differences in methodology used should be documented<br />
SCRA*: substantial changes in emission distribution should be reported annually
2.3. Present status (1997 emission data)<br />
A major objective in the <strong>EMEP</strong> emission inventorying work is to obtain complete time series<br />
of national annual total and sectoral emissions since 1980 using harmonised emission<br />
inventory methodologies, as well as full sets of gridded national and sectoral data for every five<br />
years starting from 1980 and updates in between. These targets should be reached as soon as<br />
possible and at the latest during the 2005 inventory.<br />
.<br />
Number of countries (max=44)<br />
40<br />
35<br />
30<br />
25<br />
20<br />
15<br />
10<br />
5<br />
0<br />
SO2 NO2 NH3<br />
National totals Sectoral totals Projections Gridded distributions<br />
Figure 2.1 Number of Parties having reported national totals, sectoral totals, emission<br />
projections and gridded distributions for at least one year.<br />
Number of countries (max=44)<br />
40<br />
35<br />
30<br />
25<br />
20<br />
15<br />
10<br />
5<br />
0<br />
Reported emissions for at least one year<br />
Completeness of reported emissions<br />
Figure 2.2 Number of Parties having reported national totals, sectoral totals and emission<br />
projections for all requested years, and gridded distributions after 1995.<br />
The completeness of the emission data is essential for the determination of trends. Figures 2.1<br />
and 2.2 show the 1997 status with respect to completeness. While national total emissions for<br />
the major components have been reported for at least one year by more than 2/3 out of total 44<br />
Parties, only about 40% of the Parties have reported all years since 1980. For ammonia, only<br />
16% of the Parties has reported 18 national emission totals. For national sectoral emissions, the<br />
36<br />
40<br />
35<br />
30<br />
25<br />
20<br />
15<br />
10<br />
5<br />
0<br />
emep/<strong>msc</strong>−w<br />
0<br />
SO2 NO2 NH3<br />
emep/<strong>msc</strong>−w<br />
18 years of national totals 18 years of sectoral totals 3 years projections Gridded distributions for 1995<br />
40<br />
35<br />
30<br />
25<br />
20<br />
15<br />
10<br />
5
completeness of the data is not satisfactory, as only 4% of the Parties have reported sectoral<br />
national totals for all years.<br />
Keeping in mind the objectives for the seventh phase of <strong>EMEP</strong>, the following suggestions for<br />
improvements can be made:<br />
1) Increase the consistency of reported data, specially concerning the sectoral data<br />
Concerning the officially reported sectoral data, a major observation to be stressed is that<br />
Parties revising their total emissions for earlier years, rarely do so for the respective sectoral<br />
totals. In several cases revisions of national totals are considerable and update of sectoral totals<br />
can by no means be overlooked. Reporting on the emission estimation methodology followed<br />
is necessary to aid work on quality control and validation of the reported figures.<br />
2) Target for completeness of the reported emissions<br />
The major objectives in the <strong>EMEP</strong> emission inventorying work are to obtain complete time<br />
series of national annual total and sectoral emissions since 1980 using harmonised emission<br />
inventory methodologies, as well as full sets of gridded national and sectoral data for every five<br />
years starting from 1980 and updates in between. These targets should be reached as soon as<br />
possible and at the latest during the 2005 inventory.<br />
3) Increase the effort for evaluating emission projections<br />
4) Increase efforts for verification of emission data<br />
37
Overwiew of Monitoring Network<br />
39
3. <strong>EMEP</strong> monitoring network for acidification and eutrophication<br />
This chapter presents the 1997 status of the <strong>EMEP</strong> monitoring network for acidification and<br />
eutrophication. The present status of <strong>EMEP</strong> monitoring network is discussed in relation to its<br />
envisaged goals and purposes, providing suggestions for the future development of the<br />
programme.<br />
Particular attention is given to clarify the present requirements of the <strong>EMEP</strong> network for<br />
acidification and eutrophication. General specifications in this chapter are complemented with<br />
the detailed evaluation of air and precipitation data for each country reported in the Appendix.<br />
This evaluation of country contributions to the <strong>EMEP</strong> network is intended to stimulate the<br />
communication between the countries and the <strong>EMEP</strong> centres. Reactions and comments are both<br />
welcome and encouraged.<br />
The following review shows that the present status of the <strong>EMEP</strong> network is satisfactory for<br />
precipitation data but not for the air data programme, where all required nitrogen components<br />
were not measured in 1997 at 60% of the stations. Recommendations for the future indicate the<br />
desirability of extending the <strong>EMEP</strong> networks to make them operational for control and<br />
surveillance purposes.<br />
3.1 Main objectives<br />
The main objective of <strong>EMEP</strong> is to provide an overview of the European situation with respect<br />
to pollution transport across national boundaries. <strong>EMEP</strong> should provide scientific support for<br />
the analysis of the relationships between emissions, atmospheric processes, air concentrations<br />
and deposition in a multi-disciplinary programme involving measurements, meteorological<br />
modelling and evaluation of effects.<br />
The main goals for the acidification and eutrophication programme are:<br />
• Determination of deposition fluxes for assessment of effects.<br />
• Quantification of transboundary fluxes and source allocation of estimated<br />
or measured deposition fluxes.<br />
• Surveillance of the progress towards the reduction of deposition fluxes, in<br />
particular as they concern exceedances of critical loads.<br />
• Verification of the reductions of sulphur and nitrogen emissions as<br />
prescribed by the Protocols to the CLRTAP.<br />
41
The requirements to fulfil these goals form the operational strategy of the <strong>EMEP</strong> programme<br />
which has been established by the Steering Body. It is beyond the purpose of this chapter to<br />
discuss the operational objectives of <strong>EMEP</strong> (see instead CCC’s note on Strategic Plan for Year<br />
2000, in preparation). In the following, we review the present status of <strong>EMEP</strong> monitoring<br />
network in relation to the existing monitoring requirements and provide suggestions for the<br />
future development of the programme.<br />
3.2. <strong>EMEP</strong> monitoring requirements<br />
The present operational objectives of <strong>EMEP</strong> impose a set of specific recommendations for the<br />
monitoring programme on acidification and eutrophication, concerning:<br />
1) the geographical coverage of the network,<br />
2) the component spectrum,<br />
3) the temporal coverage and sampling frequency,<br />
4) the analytical methods, and<br />
5) the QA/QC procedures<br />
Measurement siting criteria are given in the Manual (<strong>EMEP</strong>/CCC-Report 1/95). The annual<br />
data reports contain overview of the site locations and point out areas where sites are missing<br />
and where the station densities are low (e.g. Hjellbrekke, 1999). A pilot study on site<br />
representativeness is under preparation but a comprehensive survey of <strong>EMEP</strong> site<br />
representativeness is needed. Requirements on the chemical components, temporal coverage,<br />
sampling frequency and sampling and analytical methods are summarised in Table 3.1.<br />
It is important to note that the present acidification and eutrophication programs consists of 12<br />
components/parameters in precipitation and 7 mandatory components in air. Detailed<br />
descriptions of <strong>EMEP</strong> recommended methods for sampling and analysis have been presented in<br />
two manuals, most recently in the <strong>EMEP</strong>/CCC-Report 1/95 from 1996. Quality analysis and<br />
quality control procedures are documented and discussed in Schaug et al. (1998) and Aas et al.<br />
(1999). These procedures include also field comparisons and annual laboratory comparisons of<br />
analytical methods (e.g. Hanssen and Skjelmoen, 1997).<br />
The recommendations listed above aim to guarantee a minimum accuracy in the determination<br />
of deposition fluxes and their source attribution. This minimum accuracy, together with<br />
complete and consistent time series of measurements, are also required for the appropriate<br />
compliance monitoring and surveillance of the progress towards the reduction of environmental<br />
damages. The requirements on site distribution imposed by compliance monitoring are not clear<br />
yet and need further discussion (see Chapter 4).<br />
It has been discussed whether weekly sampling could substitute daily sampling in <strong>EMEP</strong>. For<br />
the precipitation data, the present accuracy could probably be also reached by use of wet-only<br />
samplers, weekly measurements, parallel sampling with rain gauge, and strict QA protocols.<br />
However, for the air data program, daily sampling is necessary. An important goal of <strong>EMEP</strong> is<br />
to provide deposition fluxes for the study of effects. The impact of episodes of combined<br />
pollutants (SO 2 , NO x , ozone) in different ecosystems is not yet fully understood. Further studies<br />
should proceed in this direction, as the focus of the Convention centres in multi-pollutant, multieffect<br />
approaches.<br />
42
<strong>EMEP</strong> Acidification Programme requirements<br />
Comments<br />
Methods<br />
in laboratory<br />
Methods<br />
in field<br />
Sampling<br />
period<br />
Component Sampling<br />
frequency<br />
Table 3.1. <strong>EMEP</strong> monitoring requirements for acidificationprogramme<br />
Precipitation:<br />
amount daily 24 hours by weight From a rain gauge<br />
SO4 daily 24 hours wet-only IC<br />
H daily 24 hours wet-only titration<br />
pH daily 24 hours wet-only pH meter<br />
NH4 daily 24 hours wet-only IC/indophenol<br />
NO3 daily 24 hours wet-only IC/Griess<br />
Na daily 24 hours wet-only IC/AES<br />
Mg daily 24 hours wet-only IC/AAS<br />
Cl daily 24 hours wet-only IC/Thiocyanate<br />
Ca daily 24 hours wet-only IC/AAS<br />
K daily 24 hours wet-only IC/AES<br />
κ daily 24 hours wet-only Cond. meter<br />
43<br />
Air:<br />
SO2(g) daily 24 hours filter-3-pack IC<br />
NO2(g) daily 24 hours KI-imp glass fritt IC/Griess<br />
HNO3(g) daily 24 hours denuder IC/Griess<br />
NH3(g) daily 24 hours denuder IC/Indophenol<br />
SO4(p) daily 24 hours filter-3-pack IC<br />
NO3(p) daily 24 hours denuder IC/Griess<br />
NH4(p) daily 24 hours denuder IC/Indophenol<br />
HNO3(g)+NO3(p) daily 24 hours filter-3-pack IC/Griess<br />
NH3(g)+NH4(p) daily 24 hours filter-3-pack IC/Indophenol<br />
Comments:<br />
IC: ion chromatography, AES: atomic emission spectroscopy, AAS: atomic absorption spectroscopy<br />
filter-3-pack: aerosol filter - KOH impregnated filter oxalic acid impregnated filter
130<br />
120<br />
110<br />
100<br />
90<br />
80<br />
70<br />
60<br />
50<br />
40<br />
30<br />
20<br />
10<br />
3.3. Present status<br />
The present monitoring strategy in <strong>EMEP</strong> has resulted in the geographical distribution of <strong>EMEP</strong><br />
stations illustrated in Figure 3.1.<br />
Figure 3.1 Geographical coverage of <strong>EMEP</strong> acidification and<br />
eutrophication monitoring network in 1997.<br />
10 20 30 40 50 60 70 80 90 100 110 120 130 140 150<br />
It can be seen that there is a lack of stations in Eastern countries like Bulgaria, Romania,<br />
Republic of Moldova, Ukraine, Armenia, Georgia and Russian Federation. The number of<br />
stations in Mediterranean countries is also small.<br />
Figure 3.1 can be misleading about the geographical representativeness and completeness of the<br />
<strong>EMEP</strong> programme. In fact, not all stations measure all components requested by the <strong>EMEP</strong><br />
acidification and eutrophication monitoring program and the analytical and sampling methods<br />
used are of very different quality.<br />
Although good progress has been made over the years, full harmonisation of methods has not<br />
been achieved. Most countries do not use the recommended methods, and in many cases<br />
outdated methods are still in use. The use of a different methodology creates a comparability<br />
problem within the network and a need for comparisons between reference and national<br />
methods. Although it has been requested that laboratories using other methods than the<br />
recommended “should be responsible to document to the CCC their accuracy, precision and<br />
comparability to the methods described in the Manual” (<strong>EMEP</strong> Workshop on data handling,<br />
analysis and quality assurance, 1986), this practice is very seldom followed.<br />
44
The CCC, in collaboration with MSC-W, has recently performed an evaluation of the methods<br />
and data quality of <strong>EMEP</strong> air and precipitation measurements. The evaluation provides an<br />
estimate of the expected errors in the 1997 measured annual averages that can be related to the<br />
existing sampling and analysis methods. Data from other years than 1997 may have different<br />
qualities than those estimated below. It is also expected that errors in single measurements will<br />
be larger than in the yearly averages, because random errors in single measurements may<br />
cancel each other when data are aggregated.The yearly averages, however, give a good<br />
estimate of the existing systematic errors and this is the reason why they have been selected in<br />
the evaluation.<br />
The 1997 yearly averages have been classified in four quality groups:<br />
A
About 60% of the <strong>EMEP</strong> stations did not measure all nitrogen components in air in 1997. Only<br />
one station, IT1, Montelibretti, reported measurements of gaseous nitric acid. Particulate nitrate<br />
has only been measured at three <strong>EMEP</strong> stations by using the recommended denuder method.<br />
Except for nitrogen dioxide measurements, the quality of filter measurements of nitrogen<br />
components in air is mostly satisfactory when measured. For nitrogen dioxide, however, there<br />
is a wide range of measurement methods in use with variable quality. In particular, monitor data<br />
are not useful at regional sites. also, the Salzmann method deviates strongly from the<br />
recommended method and needs to be replaced.<br />
Number of stations for 1997 (total=93)<br />
Figure 3.2. Classification of the 1997 precipitation data measurements at <strong>EMEP</strong> stations. In<br />
1997, the total number of operative <strong>EMEP</strong> stations was 93.<br />
Number of stations for 1997 (total=93)<br />
80<br />
60<br />
40<br />
20<br />
0<br />
80<br />
60<br />
40<br />
20<br />
0<br />
SO4 H pH NH4 NO3 Na Mg Cl Ca K k<br />
A: q< 10% B: q< 25% C: q< 30% D: q> 30%<br />
Measured components in precipitation<br />
SO2(g) NO2(g) HNO3(g) NH3(g) SO4(p) NO3(p) NH4(p) HNO3(g)+NO3(p) NH3(g)+NH4(p)<br />
A: q
3.4 Suggestions for improvements<br />
The present <strong>EMEP</strong> monitoring system could be sufficient to fulfil the main goals of programme,<br />
if it was fully implemented to its aims. The 1997 review has shown that the present status of the<br />
<strong>EMEP</strong> network is mostly satisfactory with respect to quality for precipitation data but not for<br />
the air data programme. The <strong>EMEP</strong> centres recommendations and suggestions for future<br />
improvements can be summarised as follows:<br />
1) Urgent need for harmonisation: use recommended techniques for sampling and analysis<br />
The <strong>EMEP</strong> monitoring system should be strengthen by adopting the same techniques for<br />
sampling and analysis in all countries. This is particularly important for future trend analyses<br />
and for determination of compliance. QA procedures should be improved and data quality<br />
objectives must be adopted at all working levels. Special attention should be given to the<br />
harmonisation of sampling and analysis methods for air components.<br />
2) Need for wet-only samplers, it can be discussed whether daily or weekly, but for air<br />
programme, daily is absolutely necessary.<br />
3) Strengthen the measurements of air data in <strong>EMEP</strong>, in particular, national networks should<br />
give priority to the measurements of nitrogen components.<br />
Only one station (IT1) had a complete air data measurement programme operative in 1997 and<br />
determined all seven air components individually including the use of denuders. Only about<br />
40% of the stations used filters to collect the sums of nitric acid/nitrates, and the sums of<br />
ammonia/ammonium. In 1997, ~60% of the <strong>EMEP</strong> stations did not collect all required nitrogen<br />
components in air. Monitoring of nitrogen compounds is increasingly important for<br />
development and surveillance of the multi- pollutant multi-effect emission control strategies.<br />
Nitrogen compounds not only contribute to the acidification and eutrophication of ecosystems<br />
but are precursors of tropospheric ozone and they contribute to the total particulate matter.<br />
4) The use of denuders is highly recommended, as it allows the separation of particle and gas<br />
components.<br />
Independent measurements of gas and particle phases are an important requirement for<br />
validation of the <strong>EMEP</strong> assessment. The partitioning between phases affects the transport<br />
patterns of the pollutants and thus the influence of transboundary fluxes. This type of<br />
measurements are not only important to secure the accuracy of the results from the acidification<br />
and eutrophication but are also relevant for the study of atmospheric particulates.<br />
5) Geographical extension to the East and the Mediterranean<br />
At present there are no <strong>EMEP</strong> monitoring stations in Armenia, Belarus, Bosnia and<br />
Herzegovina, Bulgaria, Cyprus, Georgia, The FRY of Macedonia, the Republic of Moldova,<br />
Romania and Ukraine. It would be desirable to extend the <strong>EMEP</strong> network with at least one<br />
station in these countries. There are no operative <strong>EMEP</strong> stations in Belgium, Luxembourg,<br />
Liechtenstein and Malta either. The representativeness of eventual new stations should be<br />
assessed.<br />
47
6) Enhance country participation (assessment of representativeness)<br />
The national participation in interpretation and assessment should be enhanced. This refers<br />
particularly the question of site representativeness in relation to a larger area, and also to the use<br />
of data provided by <strong>EMEP</strong> in relation to national networks and assessments of concentration<br />
and deposition fields at the national level.<br />
7) Extension of the monitoring with information from other networks<br />
<strong>EMEP</strong> should evaluate the possibility of including information from other existing network, in<br />
particular within the Convention. For that purpose, it would be desirable to establish closer cooperation<br />
with the Working Group on Effects and the ICPs concerning the collection and<br />
analysis of measured data.<br />
48
The Operative Eulerian Model<br />
49
4. The operative <strong>EMEP</strong> Eulerian acid deposition model<br />
For the first time in 1999, the <strong>EMEP</strong> Eulerian acid deposition model has been used to produce<br />
updated estimates of air concentrations and depositions of sulphur and nitrogen and to quantify<br />
the significance of transboundary transport over Europe. The introduction of the operational<br />
<strong>EMEP</strong> Eulerian acid deposition model constitutes an important step forward to attaining the<br />
operational goals of <strong>EMEP</strong> on its seventh phase.<br />
This chapter summarises the achievements of the new operative model for acidification and<br />
eutrophication, considers its limitations and provides recommendations for further model<br />
development. In general, the accuracy of the model results has improved with the present<br />
description of physical and chemical processes and the new meteorological input data and the<br />
model provides an increased resolution for the calculation of exceedances of critical loads.<br />
Results presented in Bartnicki (1999) show that the new <strong>EMEP</strong> model is capable of allocating<br />
the origin of transboundary air pollution in Europe and manages to account for the<br />
“indeterminate deposition” of the previous Lagrangian budget calculations. In source areas,<br />
depositions calculated with the new Eulerian model are generally larger than those calculated<br />
with the Lagrangian model, but differences between the models are in the ranges of the<br />
meteorological variability.<br />
4.1 Main objectives for <strong>EMEP</strong> acid deposition modelling<br />
The goals of <strong>EMEP</strong> determine to a great extent the type of model to be used in the programme<br />
and impose requirements to the model performance. The <strong>EMEP</strong> models should provide a<br />
scientifically sound description of the physical and chemical processes involved in the<br />
atmospheric emission, transport and removal of pollutants. Results from the model should be:<br />
* accurate,<br />
* mass conservative,<br />
* based on state-of-art understanding of physical and chemical processes,<br />
* given in appropriate spatial and temporal resolution, and<br />
* derived in a computationally effective manner<br />
The accuracy of the model results is measured in terms of their agreement with observations and<br />
the validity of the results can also be evaluated through model intercomparisons, sensitivity<br />
analysis and sampling error studies. To fulfil these goals operational objectives have been<br />
determined inside <strong>EMEP</strong>.<br />
51
4.2. Present status<br />
After several years of development, the <strong>EMEP</strong> Eulerian acid deposition model has become<br />
ready for operational use. The scientific progress and parametrisations used in the model have<br />
been documented and verified since the beginning of its development in 1993 (Berge, 1993;<br />
Jakobsen et al., 1995; Jonson and Berge, 1995; Jakobsen et al., 1996; Jakobsen et al., 1997;<br />
Berge, 1997; Berge and Jakobsen, 1998, Jonson et al., 1998a, 1998b, Olendrzynski et al.,<br />
1998a, 1998b). The model is now operative because it fulfils the <strong>EMEP</strong> requirements<br />
mentioned above.<br />
1) On the average, the model performs comparably or better than the <strong>EMEP</strong><br />
Lagrangian model with regard to measured values. The evaluation of<br />
operational model performance is reported in detail in Olendrzynski (1999).<br />
2) High precision of mass conservation makes the Eulerian model suitable for<br />
the analysis of transboundary exchange and country budgets. The mass<br />
conservation properties of the model have been reviewed and improved,<br />
leading to pollutant mass conservation within 1% error for the long-term<br />
(annual) computations required by <strong>EMEP</strong>.<br />
3) The increased horizontal resolution makes the Eulerian model a better tool<br />
for applications on regional scale and for the determination of effects.<br />
4) The model has been evaluated and tested to calculate transboundary<br />
exchange and source-receptor matrices within reasonable certainty ranges<br />
(Bartnicki, 1999)<br />
5) The model has been parallelised and optimised for runs in CRAY T3E. The<br />
calculations to derive source-receptor matrices for sulphur and nitrogen<br />
require 11 CPU hours for each considered country/emitter region.<br />
In addition, a new dedicated meteorological model, PARLAM-PS, has been developed and<br />
verified at <strong>EMEP</strong>/MSC-W. This development has allowed the extension of the <strong>EMEP</strong> model<br />
domain. The new model domain includes now the Turkey and Armenia, both Parties to the<br />
CLRTAP Convention that were not totally included in the former domain and allows for a<br />
complete description of the Mediterranean Sea.<br />
A detailed description of the meteorological model and its verification for <strong>EMEP</strong> purposes is<br />
given in Tsyro (1999). The need for a new meteorological model is related to the change of<br />
<strong>EMEP</strong> operational transport model from a one-layer Lagrangian model to 3-D Eulerian model,<br />
which imposes stronger numerical and physical requirements to the input data. To increase the<br />
accuracy of the simulations, input meterological data is now provided at 3-hour intervals,<br />
instead of 6-hourly and the meteorological fields are defined in the same grid as the<br />
atmospheric dispersion model to avoid numerical interpolation errors.<br />
The new meteorological model is based on the operational Numerical Weather Prediction at<br />
the Norwegian Meteorological Institute (HIRLAM). The HIRLAM model has been<br />
52
eformulated from a rotated spherical horizontal grid to the polar-stereographic projection, and<br />
from a hybrid η−coordinate to σ-coordinate used by <strong>EMEP</strong> Eulerian models. The usage in<br />
both models of the same coordinate system has the great advantage that it avoids mass<br />
conservation errors due to spatial interpolation of the meteorological mass and wind fields.<br />
The comparison of HIRLAM/EUROLAM with the meteorological model, LAM50E, used as<br />
input for the Lagrangian model has revealed a number of differences in predicted<br />
meteorological fields which can be relevant to explain differences in concentrations and<br />
deposition fields computed for 1997. The largest differences are found in cloud cover,<br />
precipitation, and surface fluxes of heat and momentum. An interesting difference between the<br />
meteorological models is the parametrisation of cloud water and the explicit treatment of<br />
evaporation below cloud in the HIRLAM. This introduces new possibilities for the wet<br />
scavenging parametrisation of the Eulerian model which are worth investigating in the future.<br />
4.2.1. Evaluation of Eulerian model performance<br />
The accuracy of model results is usually determined by their agreement with observations and<br />
for <strong>EMEP</strong> purposes, the operative quality standard for yearly averages has been “agreement<br />
within a factor of two”.<br />
The evaluation of operational model performance reported in Olendrzynski (1999) focuses on<br />
yearly and daily values. Scatter diagrams demonstrate that the computed annual mean air<br />
concentrations are generally within a factor of two agreement with observations in most of the<br />
<strong>EMEP</strong> stations in 1997. For SO 2 , however, the model tends to overestimate high<br />
concentrations close to emission sources, and to underestimate low concentrations in remote<br />
areas of Europe.<br />
It has been pointed out before that the dry deposition routine of the Eulerian model does not<br />
perform satisfactorily (Jakobsen et al., 1996). In Olendrzynski (1999) a test with fixed dry<br />
deposition velocity at 1m for SO 2 , showed that the agreement with measurements improves<br />
significantly for SO 2 , while the results for other components are - except SO 4 - only slightly<br />
affected. This is again an indication of the need to revise the computation of surface and quasilaminar<br />
boundary layer resistances in the model. A closer look into this problem is intended in<br />
the near future.<br />
For compounds other than SO 2 , computed annual mean air concentrations are in relatively<br />
good agreement with observations. The difference between computed and measured air<br />
concentrations, averaged over all stations considered, varies between 1-13% with NO 2 and<br />
NH3+NH4 having the best agreement. Correlation coefficient between computed and<br />
measured concentrations is rather high, varying between 0.69 and 0.87 depending on the<br />
compound. Computed annual concentrations in precipitation are also in fairly good agreement<br />
with observations, where between 74-87% of all stations are within the zone of ‘the factor of<br />
two’ difference. Table 4.1 summarises the performance of the Eulerian model with respect to<br />
yearly averages and compares it with the averaged performance of the Lagrangian model.<br />
Analysis of the daily measured and computed concentrations indicated that the dynamics of<br />
the concentration changes is frequently well captured by the model. This is particularly evident<br />
at stations in Scandinavia on occasions of long-range transport from continental Europe.<br />
53
Model performance for southern Europe is, in general less satisfactory than for the rest of the<br />
continent.<br />
Table 4.1. Comparison of the performance of the Eulerian and the Lagrangian models with<br />
respect to yearly averaged concentrations.<br />
Component<br />
daily<br />
correl<br />
Eulerian 1997 Lagrangian 1985-97<br />
Mod<br />
Mean<br />
Obs<br />
Mean<br />
Following the approach introduced in Tarrasón et al. (1998), combined estimates of the<br />
geographical distribution of sulphur and nitrogen compounds have been derived. A similar<br />
approach has also been followed in Kåresen and Hirst (1999) for sulphur components, where<br />
in addition, confidence ranges of the estimates are presented.<br />
The general agreement between the Eulerian model results for 1997 and <strong>EMEP</strong> measurements<br />
is better than for the Lagrangian model, specially for nitrogen dioxide and nitrate in air.<br />
Figures 4.1 and 4.2 show the results for sulphur dioxide and particulate sulphate in air, together<br />
with the normalised differences between the Eulerian model estimates and 1997 <strong>EMEP</strong><br />
measurements. These are the two components with worse model performance. The systematic<br />
overestimate of particulate sulphate in central Europe and underestimation in Scandinavia has<br />
been related before to the β−factor, the fraction of emissions directly emitted as particles. The<br />
combination of model and measurement estimates are the present best estimate for particulate<br />
sulphate in air and sulphur dioxide.<br />
54<br />
Rel.<br />
Bias<br />
year.<br />
correl<br />
Mod<br />
Mean<br />
Obs<br />
Mean<br />
Rel.<br />
Bias<br />
SO 2 0.74 2.88 1.51 90% 0.87 2.73 2.81 3%<br />
SO 4 0.84 0.73 0.83 12% 0.79 1.57 1.27 3%<br />
NO 2 0.80 2.06 2.04 1% 0.82 1.25 1.91 35%<br />
HNO 3 +NO 3 0.69 0.62 0.55 13% 0.96 0.86 0.32 168%<br />
NH 3 + NH 4 + 0.53 1.25 1.36 8% 0.93 0.56 0.78 28%<br />
SO 4 -2 (l) 0.64 0.72 0.51 41% 0.67 0.78 0.82 5%<br />
NO 3 - (l) 0.59 0.36 0.35 3% 0.68 0.44 0.45 2%<br />
NH 4 + (l) 0.64 0.48 0.42 14% 0.83 0.37 0.58 36%
a)<br />
b)<br />
Figure 4.1. Combined estimate of modelled and measured data and normalised differences for<br />
for a) sulphur dioxide and b) particulate sulphate in air . Units: μg(S)/m2<br />
55
4.2.2. Evaluation of the Eulerian source-receptor matrices<br />
Non-linear chemistry and non-linear effects induced by the numerical solution of the transport<br />
equation are the major problems in computing source-receptor matrices with the Eulerian Acid<br />
Deposition model. In practice, these non-linearities imply that sum of individual contributions<br />
is not necessary equal to the total deposition from all European sources and the differences<br />
between the total and separate runs indicate the range of uncertainties in the source-receptor<br />
matrices due to non-linear effects.<br />
Bartnicki (1999) presents a thorough evaluation of different methods to calculate sourcereceptor<br />
matrices with the new Eulerian model and quantifies the ranges of uncertainties in the<br />
annual source-receptor matrices due to non-linear effects to be 4% for oxidised sulphur , 8% for<br />
oxidised nitrogen and 3% for reduced nitrogen. The actual source-receptor matrices are also<br />
given in Chapter 1.3.<br />
Given the consequences for the work of the Convention, Bartnicki (1999) has compared the<br />
Eulerian model matrices with the source-receptor matrices computed with the Lagrangian<br />
model. Both models gave similar results when the input meteorological data were computed by<br />
the LAM50E meteorological model.<br />
In general, the Eulerian model allocates a larger fraction of the European emissions and the<br />
manages to account for the “indeterminate deposition” of the previous Lagrangian budget<br />
calculations. This is well illustrated in Figures 4.2, 4.3 and 4.4 which show the evolution of the<br />
five larger contributors to deposition over Norway, Spain and Poland.<br />
The Eulerian model manages to allocate the “indeterminate” contribution thus increasing the<br />
actual contribution of different countries. In many cases, the contribution of the country to<br />
itself increases in the 1997 simulations. This is particularly true in source areas and for<br />
Mediterranean countries. The deposition of Spanish emissions in Spain increases in 1997 with<br />
respect to previous years, particularly for oxidised nitrogen and this seems to be related to an<br />
increase in the dry deposition calculated by the Eulerian model.<br />
It is not clear at this point whether this is a feature of the Eulerian model or if it is a<br />
consequence of the particular meteorological variations of this year. The generally larger<br />
contribution of dry deposition to total in 1997 can be to some extend explained by the<br />
differences in precipitation, which was approximately 20% lower in 1997 than in 1996 in the<br />
input files for the Eulerian model. Further studies using different meteorological conditions are<br />
necessary.<br />
Otherwise, differences between the source-receptor matrices produced by Eulerian and the<br />
Lagrangian models are within the range expected from different meteorological variations.<br />
56
100 tonnes S<br />
100 tonnes N<br />
100 tonnes N<br />
2000<br />
1500<br />
1000<br />
500<br />
0<br />
1000<br />
800<br />
600<br />
400<br />
200<br />
0<br />
500<br />
400<br />
300<br />
200<br />
100<br />
0<br />
1985 1986 1987 1988 1989 1990 1991 1992 1993 1994 1995 1996 1997<br />
IND NO GB DE RU Others<br />
Contributions to sulphur deposition in Norway<br />
Contributions to oxidised nitrogen deposition in Norway<br />
1985 1986 1987 1988 1989 1990 1991 1992 1993 1994 1995 1996 1997<br />
IND NO GB DE RU Others<br />
Contributions to reduced nitrogen deposition in Norway<br />
1985 1986 1987 1988 1989 1990 1991 1992 1993 1994 1995 1996 1997<br />
IND NO GB DE RU Others<br />
Figure 4.2. Evolution of allocated deposition over Norway. Five main contributors as reported<br />
in the Lagrangian source-receptor matrices for the period 1985-1996, and the Eulerian sourcereceptor<br />
matrices in 1997.<br />
57<br />
emep/<strong>msc</strong>−w<br />
emep/<strong>msc</strong>−w<br />
emep/<strong>msc</strong>−w
100 tonnes S<br />
100 tonnes N<br />
100 tonnes N<br />
3000<br />
2000<br />
1000<br />
0<br />
2000<br />
1500<br />
1000<br />
500<br />
0<br />
1500<br />
1000<br />
500<br />
0<br />
1985 1986 1987 1988 1989 1990 1991 1992 1993 1994 1995 1996 1997<br />
IND ES FR PT ATL Others<br />
Contributions to sulphur deposition in Spain<br />
Contributions to oxidised nitrogen deposition in Spain<br />
1985 1986 1987 1988 1989 1990 1991 1992 1993 1994 1995 1996 1997<br />
IND ES FR PT ATL Others<br />
Contributions to reduced nitrogen deposition in Spain<br />
1985 1986 1987 1988 1989 1990 1991 1992 1993 1994 1995 1996 1997<br />
IND ES FR PT ATL Others<br />
Figure 4.3. Evolution of allocated deposition over Spain. Five main contributors as reported in<br />
the Lagrangian source-receptor matrices for the period 1985-1996, and the Eulerian sourcereceptor<br />
matrices in 1997.<br />
58<br />
emep/<strong>msc</strong>−w<br />
emep/<strong>msc</strong>−w<br />
emep/<strong>msc</strong>−w
100 tonnes S<br />
1.2*10 4<br />
1.0*10 4<br />
8.0*10 3<br />
6.0*10 3<br />
4.0*10 3<br />
2.0*10 3<br />
0.0*10 0<br />
100 tonnes N<br />
100 tonnes N<br />
2500<br />
2000<br />
1500<br />
1000<br />
500<br />
0<br />
3000<br />
2000<br />
1000<br />
0<br />
1985 1986 1987 1988 1989 1990 1991 1992 1993 1994 1995 1996 1997<br />
IND PL DE CZ GB Others<br />
Contributions to sulphur deposition in Poland<br />
Contributions to oxidised nitrogen deposition in Poland<br />
1985 1986 1987 1988 1989 1990 1991 1992 1993 1994 1995 1996 1997<br />
IND PL DE CZ GB Others<br />
Contributions to reduced nitrogen deposition in Poland<br />
1985 1986 1987 1988 1989 1990 1991 1992 1993 1994 1995 1996 1997<br />
IND PL DE CZ GB Others<br />
Figure 4.4. Evolution of allocated deposition over Poland. Five main contributors as reported<br />
in the Lagrangian source-receptor matrices for the period 1985-1996, and the Eulerian sourcereceptor<br />
matrices in 1997.<br />
59<br />
emep/<strong>msc</strong>−w<br />
emep/<strong>msc</strong>−w<br />
emep/<strong>msc</strong>−w
4.2.3. Statistical estimates of emissions using of source-receptor matrices<br />
Previous studies reported by the MSC-W concluded that the use of statistical methods to<br />
determine the level of compliance to the protocols of the Convention protocols requires a<br />
qualification of the uncertainties associated both with model and measured concentrations in the<br />
<strong>EMEP</strong> programme (Dimakos and Høst, 1997). Their original analysis was unconclusive<br />
because it assumed that all deviations between <strong>EMEP</strong> modelled and measured data was caused<br />
by unaccuracies in the emissions. By not accounting for model uncertainties, they reached<br />
conflicting results on the extent of the emissions depending on the atmospheric sulphur<br />
component that was analysed.<br />
This year, Kåresen and Hirst (1999) report further on the use of a Bayesian method to evaluate<br />
emissions in the <strong>EMEP</strong> area. Following the recommendations from previous studies they<br />
include an estimate of the measurement error in the analysis. The measurement error that they<br />
have used was derived by Aas et al. (1999) and corresponds to the quality analysis reported in<br />
Chapter 3.<br />
They conclude that inclusion of the given uncertainty ranges in the measured data has little<br />
effect on the results. Their estimated changes in the emissions are not significant and they are<br />
uncorrelated between the different sulphur components, as in Dimakos and Høst (1997). In this<br />
way, they conclude that there is insufficient information in the <strong>EMEP</strong> data to evaluate national<br />
emissions. This could have consequences for the geographical distribution of <strong>EMEP</strong> stations,<br />
but given the uncertainties in this model approach it is not recommended to use statistical Bayes<br />
estimates based on the <strong>EMEP</strong> source-receptor matrices to evaluate emission inventories.<br />
60
4.4 Recommendations for future model development<br />
The introduction of the operational <strong>EMEP</strong> Eulerian represents a first step towards the<br />
development of combined multi-pollutant, multi-effect models. Its further development should<br />
be paralell to the development of the Eulerian photooxidant model. The models having the same<br />
structure, it is important that new routines are tested and implemented in both models. The<br />
<strong>EMEP</strong> Eulerian model is envisaged to evolve towards a flexible model useful for a wide range<br />
policy relevant applications.<br />
An important goal for future model development should be to improve the accuracy of model<br />
results to at least a 30% agreement with measurements for all components. This implies, among<br />
other things, the need to:<br />
1). Review the dry deposition parametrisation<br />
Sulphur dioxide in air shows poor agreement with observations even when annual averages are<br />
considered. The models tends to overestimate high concentrations close to emission sources,<br />
and to underestimate low concentrations observed in remote areas of Europe. Tests performed<br />
this year with dry deposition indicate that the formulation of the surface and the sub-laminar<br />
resistances can be a source of error in the model. It is expected that an improvement on the dry<br />
deposition routine will lead to an increase in the accuracy of the model estimates for sulphur<br />
dioxide in air.<br />
2) Review wet scavenging parametrisation to account for re-evaporation.<br />
Sulphate in precipitation is the other component where the <strong>EMEP</strong> Eulerian model does not<br />
satisfy yet the accuracy requirement of 30%agreement in the yearly means, and is generally<br />
overestimated by the model. This recommends a review of the wet scavenging routine in order<br />
to introduce the effect of re-evaporation processes. The possibility of including re-evaporation<br />
in the Eulerian model formulation is provided by the introduction of the new HIRLAM_PS.<br />
However, the hydrological balance in the new meteorological model should be evaluated during<br />
the study.<br />
3) Improve the chemical scheme by comparing with the parametrisation of the Eulerian photooxidant<br />
model.<br />
In particular the sulphur chemistry and the partitioning between HNO 3 (g)-NO 3 (p) , processes<br />
that have further importance further in modelling atmospheric secondary aerosols.<br />
4) Explore new methods for evaluation of model performance, that consider the challenges<br />
5) Investigate new inverse methods to report on compliance of emissions.<br />
61
5. References<br />
Bartnicki, J. and Tarrasón, L. (1998) Comparison of the Lagrangian and Eulerian model performance, Chapter 6<br />
in “Transboundary Acidifying Pollution in Europe, MSC-W Status Report 1998", <strong>EMEP</strong>/MSC-W, Report 1/98.<br />
Norwegian Meteorological Institute, Oslo, Norway.<br />
Bartnicki, J., Computing Source-Receptor Matrices with the Eulerian Acid Deposition Model. <strong>EMEP</strong>/MSC-W,<br />
Note 5/99. Norwegian Meteorological Institute, Oslo, Norway<br />
Berge, E., Sandnes, H., Jakobsen, H. A. and Jonson, J. E. (1996). Acid deposition in the 50 km grid, results and<br />
comparison with measurements for 1992. In Transboundary air pollution in Europe. MSC-W Status Report 1996,<br />
Barrett, K and Berge, E (eds.). <strong>EMEP</strong>/MSC-W, Report 1/96, Norwegian Meteorological Institute, Oslo, Norway.<br />
Berge E. (1993) Preliminary estimates of sulphur transport and deposition in Europe with a regional scale multilayer<br />
Eulerian model. <strong>EMEP</strong>/MSC-W Note 1/93. The Norwegian Meteorological Institute, Oslo, Norway.<br />
Berge E. (1997) Transboundary Air Pollution in Europe. MSC-W Status Report 1997. Part 1 and 2. <strong>EMEP</strong>/MSC-<br />
W Report 1/97. The Norwegian Meteorological Institute, Oslo, Norway.<br />
Berge E. and H.A. Jakobsen (1998) A regional scale multi-layer model for the calculation of long term transport<br />
and deposition of air pollution in Europe. Submitted and accepted to Tellus.<br />
Dimakos, X. and Høst, G (1997) Estimation of regional emissions in Europe using <strong>EMEP</strong> monitoring data and<br />
some implications for network design. <strong>EMEP</strong>/MSC-W, Note 3/96, Norwegian Meteorological Institute, Oslo,<br />
Norway.<br />
<strong>EMEP</strong> (1986) Weber, E. (ed.) <strong>EMEP</strong> Workshop on data handling, analysis and quality assurance. Bonn, Federal<br />
Ministry for Environment, Nature Conservation and Reactor Safety.<br />
<strong>EMEP</strong> (1996) <strong>EMEP</strong> Manual for sampling and chemical analysis. Kjeller, Norwegian Institute for Air Research<br />
(<strong>EMEP</strong>/CCC-Report 1/95)<br />
Hanssen, J.E., Skjelmoen, J.E. (1997)The sixteenth intercomparison of analytical methods within <strong>EMEP</strong>. Kjeller,<br />
Norwegian Institute for Air Research (<strong>EMEP</strong>/CCC-Report 2/97)<br />
Hjellbrekke, A.-G. (1999) Data Report 1997. Part 1: Annual summaries. Kjeller, Norwegian Institute for Air<br />
Research (<strong>EMEP</strong>/CCC-Report 3/99)<br />
Jakobsen, H. A., Jonson, J. E. and Berge, E. (1997). The multi-layer Eulerian model: Model description and<br />
evaluation of transboundary fluxes of sulphur and nitrogen for one year. <strong>EMEP</strong>/MSC-W, Report 2/97. Norwegian<br />
Meteorological Institute, Oslo, Norway.<br />
Jakobsen H.A., Berge E., Iversen T. and R. Skålin (1995) Status of the development of the multilayer Eulerian<br />
model. a) Model description; b) New method for calculating mixing heights; c) model results for sulphur transport<br />
and deposition in Europe for 1992 in the 50 km grid. <strong>EMEP</strong>/MSC-W Note 3/95. The Norwegian Meteorological<br />
63
Institute, Oslo, Norway.<br />
Jakobsen H. A., Jonson, J. E., Berge, E. (1996) Transport and deposition calculations of sulphur and nitrogen<br />
compounds in Europe for 1992 in the 50 km grid by use of the multi-layer Eulerian model. <strong>EMEP</strong>/MSC-W Note<br />
2/96. The Norwegian Meteorological Institute, Research Report no 34, The Norwegian Meteorological Institute,<br />
Oslo, Norway.<br />
Jakobsen H.A., Jonson J.E. and E. Berge (1997) The multi-layer Eulerian model: Model description and<br />
evaluation of transboundary fluxes of sulphur and nitrogen for one year. <strong>EMEP</strong>/MSC-W Note 2/97. The<br />
Norwegian Meteorological Institute, Oslo, Norway.<br />
Jonson J.E. and E. Berge (1995). Some preliminary results on transport and deposition of nitrogen compounds by<br />
use of multi-layer Eulerian model. <strong>EMEP</strong>/MSC-W Note 1/95. The Norwegian Meteorological Institute, Oslo,<br />
Norway.<br />
Jonson J.E., Bartnicki J., K. Olendrzynski, H.A. Jakobsen and E. Berge (1998a). <strong>EMEP</strong> Eulerian model for<br />
atmospheric transport and deposition of nitrogen species over Europe. Accepted to Environmental Pollution.<br />
Jonson J.E., K. Olendrzynski, Bartnicki J., H.A. Jakobsen and E. Berge (1998b). <strong>EMEP</strong> Eulerian model for acid<br />
deposition over Europe. Preprints of the 5th international Conference on Harmonization within Atmospheric<br />
Dispersion Modelling for Regulatory Purposes. May 1998, Rhodes, Greece.<br />
Kåresen, K. and Hirst, D. Statistical estimation of emissions and concentrations of sulphur using the <strong>EMEP</strong> 50km<br />
model. <strong>EMEP</strong>/MSC-W, Note 2/99. Norwegian Meteorological Institute, Oslo, Norway.<br />
Olendrzynski K., Bartnicki J., Jonson J.E. (1998a). Performance of the Eulerian Acid Deposition Model. Chapter<br />
in MSC-W/<strong>EMEP</strong> Report 1/98. The Norwegian Meteorological Institute, Oslo, Norway.<br />
Olendrzynski K., Jonson J.E., Bartnicki J., H.Jakobsen and E.Berge (1998b). <strong>EMEP</strong> Eulerian Model for Acid<br />
Deposition over Europe. Proceeding of the 5th International Conference on Harmonization within Atmospheric<br />
Dispersion Modelling for Regulatory Purposes, Rhodes, Greece, 18-21 May 1998.<br />
Olendrzynski K., Berge E., and J. Bartnicki J., (1999). <strong>EMEP</strong> Eulerian Acid Deposition Model and its<br />
applications. European Journal of Operational Research (in print).<br />
Olendrzynski, K. (1999) Operational <strong>EMEP</strong> Eulerian Acid Deposition model, <strong>EMEP</strong>/MSC-W, Note 4/99.<br />
Norwegian Meteorological Institute, Oslo, Norway.<br />
Mylona, S. (1999) <strong>EMEP</strong> Emission Data Status Report 1999 <strong>EMEP</strong>/MSC-W Note 1/99. Norwegian<br />
Meteorological Institute, Oslo, Norway.<br />
Schaug, J., Semb, A., Hjellbrekke, A.-G. (1998) Data quality 1996, quality assurance, and field comparisons.<br />
Kjeller, Norwegian Institute for Air Research (<strong>EMEP</strong>/CCC-Report 6/98)<br />
Tarrasón, L., Semb, A., Hjellbrekke, A-G, Tsyro, S., Schaug, J., Bartnicki, J., and Solberg, S. (1998)<br />
Geographical distribution of sulphur and nitrogen compounds derived both from modelled and observed values.<br />
<strong>EMEP</strong>/CCC and MSC-W, Note 4/98. Norwegian Meteorological Institute, Oslo, Norway.<br />
Tsyro, S. and Støren, E.(1999) New meteorological model for air pollution transport models <strong>EMEP</strong>/MSC-W,<br />
Report 3/99. Norwegian Meteorological Institute, Oslo, Norway.<br />
Tsyro, S. (1998b) Transboundary fluxes of acidifying and eutrophyig pollution in Europe, Chapter 3 in<br />
“Transboundary Acidifying Pollution in Europe, MSC-W Status Report 1998", <strong>EMEP</strong>/MSC-W, Report 1/98.<br />
Norwegian Meteorological Institute, Oslo, Norway.<br />
Aas, W.,Hjellbrekke, A.-G., Semb, A., Schaug, J. (1999) Data quality 1997, quality assurance, and field<br />
comparisons. Kjeller, Norwegian Institute for Air Research (<strong>EMEP</strong>/CCC-Report */99)<br />
64
APPENDIX<br />
1997 Status Review<br />
by Country<br />
66
Overview of regions included in this Appendix<br />
Country/Region Code Country/Region Code<br />
Armenia AM Norway NO<br />
Austria AT Poland PL<br />
Belarus BY Portugal PT<br />
Belgium BE Republic of Moldova MD<br />
Bosnia and Herzegovina BA Romania RO<br />
Bulgaria BG Russian Federation RO<br />
Croatia HR Slovakia SK<br />
Cyprus CY Slovenia SI<br />
Czech Republic CZ Spain ES<br />
Denmark DE Sweden SE<br />
European Union EU Switzerland CH<br />
Finland FI The FYR of Macedonia MK<br />
France FR Turkey TR<br />
Germany DE Ukraine UA<br />
Greece GR Yugoslavia YU<br />
Hungary HU United Kingdom GB<br />
Iceland IS<br />
Ireland IE Estonia ES<br />
Italy IT<br />
Latvia LV The Baltic Sea BAS<br />
Lithuania LT The Mediterranean Sea MED<br />
Luxembourg LU The North Sea NOS<br />
Netherlands NL Remaining N.E. Atlantic ATL<br />
For Canada, Liechtenstein, United States only reported emission data<br />
Georgia and Malta not included at present.<br />
67
Description of contents Contact person<br />
Reported national emission totals sophia.mylona@ dnmi.no<br />
Overview of reported emissions sophia.mylona@ dnmi.no<br />
Maps of allocated depositions and<br />
air concentration for 1997<br />
Source-receptor pies with import and<br />
export information<br />
for the 5 largest contributors<br />
Timeseries of emissions, depositions,<br />
critical load exceedances and area with<br />
exceedances<br />
Overview of data uncertainty for precipitation<br />
and air quality<br />
Timeseries of observed and modelled<br />
concentratrions<br />
69<br />
jerzy.bartnicki@dnmi.no<br />
jerzy.bartnicki@dnmi.no<br />
leonor.tarrason@dnmi.no<br />
jan.schaug@nilu.no<br />
k.olendrzynski@dnmi.no