ccc & msc-w - EMEP
ccc & msc-w - EMEP
ccc & msc-w - EMEP

Create successful ePaper yourself
Turn your PDF publications into a flip-book with our unique Google optimized e-Paper software.
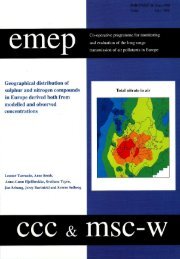
The first figure, for acidifying sulphur, shows the total sulphur mass deposited over the country<br />
each year and shows the effect of this deposition as the total mass contributing to exceedances<br />
of the 5th percentile conditional critical load. In general, trends in the exceedances follow the<br />
trends in sulphur and nitrogen deposition.<br />
The acidifying sulphur figure includes also a curve depicting the time evolution of deposition<br />
of transboundary origin to the specific country. Differences between total deposition and<br />
transboundary deposition give a good measure of the importance of indigenous deposition in<br />
the country. In many cases, specially over central European countries, it can be seen how the<br />
relative contribution of transboundary deposition has increased after the emissions from the<br />
countries themselves have decreased. Direct comparison between the emissions and<br />
depositions values allows a first analysis of the country balance of imported vs exported<br />
deposition.<br />
The second figure serves for the analysis of acidifying and eutrophying nitrogen. Excess<br />
nitrogen deposition contributes to acidification but can also lead to the eutrophication of soils<br />
an surface waters. Thus, to analyse the effects caused by excess nitrogen deposition both a<br />
conditional critical for acidity and a critical load of nutrient nitrogen need to be considered.<br />
The conditional critical load for acidifying nitrogen depends both on sulphur and nitrogen<br />
deposition, and thus the acidifying nitrogen exceedance trend depends both on sulphur and<br />
nitrogen deposition trends. The critical load for eutrophying nitrogen does not depend on<br />
sulphur deposition and therefore the eutrophying exceedances follow more generally the<br />
nitrogen depositions.<br />
The third figure gives the time evolution of the area of ecosystems with exceedance of the 5th<br />
percentile critical loads. The curves represent the time evolution of the ecosystem area exposed<br />
to possible exceedances, as percentage of the total country area. Here, the geographical<br />
distribution of the considered ecosystems plays an important role. Inter-annual meteorological<br />
variations can affect the pollution transport patterns, resulting in large changes in the<br />
percentage ecosystem area with exceedances of the 5th percentile. Larger deposition amounts<br />
over the country, do not necessarily imply larger ecosystem area with registered exceedances<br />
because both the deposition levels and the geographical distribution of sensitive ecosystems<br />
determine the changes in the ecosystem area.<br />
Figures 1.2 a), b) and c) summarise the analysis for all countries in Europe that are Parties to<br />
the Convention except Georgia, Iceland, Liechtenstein, Malta and Turkey. Georgia was not<br />
included in this year’s calculations because the information that the country had ratified the<br />
CLRTAP on February 2nd 1999 did not reach MSC-W in time for the model calculations. The<br />
emissions from Malta and Liechtenstein are so low that their depositions are below the<br />
precision limits of the model calculation of transboundary fluxes. Finally, Iceland and Turkey<br />
are not included either because there is no critical load data available for these countries.<br />
The transboundary deposition in these figures is the sum of total deposition in the individual<br />
countries that originates outside of their boundaries. For all these <strong>EMEP</strong> countries,<br />
transboundary depositions represent between 55-60% of the total deposition for sulphur, and<br />
between 40-50% of the total deposition for nitrogen. Although emissions have decreased, the<br />
distribution of sources in the different countries has not given the same type of reduction of in<br />
the depositions.<br />
16