ccc & msc-w - EMEP
ccc & msc-w - EMEP
ccc & msc-w - EMEP

Create successful ePaper yourself
Turn your PDF publications into a flip-book with our unique Google optimized e-Paper software.
Emission reductions estimated for the whole <strong>EMEP</strong> area satisfied in 1994 and 1996 the<br />
requirements from the First NO x Protocol, but according to the official reported values, 6<br />
countries had larger still NO x emissions in 1996 than in 1987.<br />
European emissions of ammonia appear to have dropped by approximately 15% between 1990<br />
and 1997. The almost constant emission trend before 1990 is primarily a result of the<br />
assumptions made to estimate the large amount of missing data for most countries.<br />
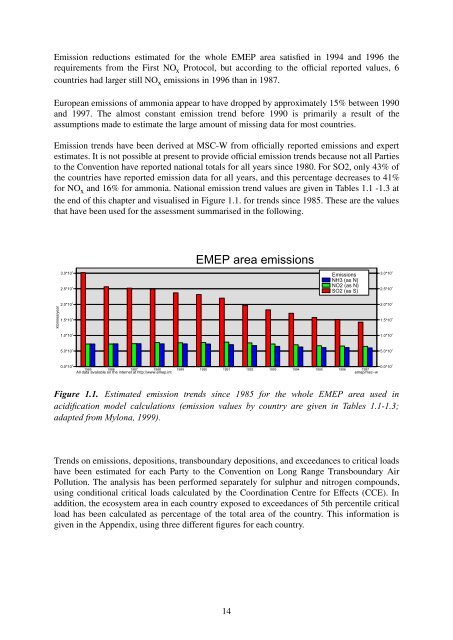
Emission trends have been derived at MSC-W from officially reported emissions and expert<br />
estimates. It is not possible at present to provide official emission trends because not all Parties<br />
to the Convention have reported national totals for all years since 1980. For SO2, only 43% of<br />
the countries have reported emission data for all years, and this percentage decreases to 41%<br />
for NO x and 16% for ammonia. National emission trend values are given in Tables 1.1 -1.3 at<br />
the end of this chapter and visualised in Figure 1.1. for trends since 1985. These are the values<br />
that have been used for the assessment summarised in the following.<br />
ktonnes/year<br />
3.0*10 4<br />
2.5*10 4<br />
2.0*10 4<br />
1.5*10 4<br />
1.0*10 4<br />
5.0*10 3<br />
<strong>EMEP</strong> area emissions<br />
0.0*10<br />
1985 1986 1987 1988 1989 1990 1991 1992 1993 1994 1995 1996 1997<br />
0<br />
0.0*10 0<br />
All data available on the internet at http://www.emep.int<br />
emep/<strong>msc</strong>−w<br />
Figure 1.1. Estimated emission trends since 1985 for the whole <strong>EMEP</strong> area used in<br />
acidification model calculations (emission values by country are given in Tables 1.1-1.3;<br />
adapted from Mylona, 1999).<br />
Trends on emissions, depositions, transboundary depositions, and exceedances to critical loads<br />
have been estimated for each Party to the Convention on Long Range Transboundary Air<br />
Pollution. The analysis has been performed separately for sulphur and nitrogen compounds,<br />
using conditional critical loads calculated by the Coordination Centre for Effects (CCE). In<br />
addition, the ecosystem area in each country exposed to exceedances of 5th percentile critical<br />
load has been calculated as percentage of the total area of the country. This information is<br />
given in the Appendix, using three different figures for each country.<br />
14<br />
Emissions<br />
NH3 (as N)<br />
NO2 (as N)<br />
SO2 (as S)<br />
3.0*10 4<br />
2.5*10 4<br />
2.0*10 4<br />
1.5*10 4<br />
1.0*10 4<br />
5.0*10 3