DVI Test and Measurement guide rev 1.pdf
DVI Test and Measurement guide rev 1.pdf
DVI Test and Measurement guide rev 1.pdf

You also want an ePaper? Increase the reach of your titles
YUMPU automatically turns print PDFs into web optimized ePapers that Google loves.
<strong>DVI</strong> <strong>Test</strong> <strong>and</strong> <strong>Measurement</strong> Guide<br />
Revision 1.0<br />
Issued 2/25/01<br />
By DDWG Electrical <strong>Test</strong> Working Group<br />
1<br />
Release 1.0 DDWG Document – Subject to Change
Table of Contents:<br />
p. 3 Overview<br />
p. 5 1 Introduction<br />
p. 7 2 <strong>Test</strong> Fixtures<br />
p. 7 2.1 Receptacle differential test fixture (TPA-R)<br />
p. 8 2.2 Plug differential test fixture (TPA-P)<br />
p. 9 2.3 Clock Recovery Unit<br />
p. 10 2.4 Equivalent Source <strong>Test</strong> Board (ESB)<br />
p. 15 2.5 Receiver <strong>Test</strong> Boards<br />
p. 16 3 <strong>Test</strong> Equipment<br />
p. 17 4 Transmitter <strong>Test</strong> <strong>Measurement</strong>s<br />
p. 17 4.1 <strong>Test</strong> Setup<br />
p. 17 4.2 Rise/Fall<br />
p. 18 4.3 Skew<br />
p. 18 4.4 Jitter<br />
p. 18 4.5 Eye Pattern<br />
p. 20 5 Cable Assembly <strong>Test</strong> <strong>Measurement</strong>s<br />
p. 20 5.1 Equivalent Source Setup<br />
p. 21 5.2 Skew<br />
p. 21 5.3 Eye Pattern<br />
p. 22 5.4 Parametric <strong>Measurement</strong>s<br />
p. 23 6 Receiver <strong>Test</strong> <strong>Measurement</strong>s<br />
p. 23 6.1 Equivalent Source Setup<br />
p. 24 6.2 Receiver <strong>Test</strong><br />
p. 26 6.3 Receiver Impedance<br />
2<br />
Release 1.0 DDWG Document – Subject to Change
Overview<br />
The test <strong>and</strong> measurement <strong>guide</strong>lines contained in this document are developed in order to aid the<br />
deployment of the <strong>DVI</strong> specification into computer to display communication <strong>and</strong> support more rapid<br />
adoption of the <strong>DVI</strong> interface. The <strong>DVI</strong> specification, released in 1999, has been widely implemented by a<br />
number of computer OEM’s, monitor makers, graphics board vendors, <strong>and</strong> cable manufacturers. Multiple<br />
silicon implementations will soon be available on the market. As evidence of the st<strong>and</strong>ardization around<br />
the <strong>DVI</strong> interface, the PC 2001 Design Guide has a requirement that states host systems, which output<br />
digital graphics data, must be <strong>DVI</strong> compliant.<br />
The intent of this document is to provide users of <strong>DVI</strong> with the necessary knowledge to enable validation<br />
of their <strong>DVI</strong> implementations <strong>and</strong> ensure compliance with the <strong>DVI</strong> electrical specifications. It is an<br />
elaboration on the requirements <strong>and</strong> test procedures described in the original specification, <strong>and</strong> describes<br />
specific test hardware <strong>and</strong> recommended measurement equipment <strong>and</strong> techniques that should be used. As<br />
<strong>DVI</strong> hardware from multiple vendors becomes more widespread <strong>and</strong> configurations where hardware from<br />
more than one silicon vendor is required to interface with each other, the ability to guarantee compliance<br />
with the specification is paramount. Further, due to the high speed signaling supported by the <strong>DVI</strong><br />
st<strong>and</strong>ard, design issues such as board layout, routing <strong>and</strong> other system parameters can affect the integrity of<br />
the <strong>DVI</strong> transmission link. This test <strong>and</strong> measurement <strong>guide</strong> thus focuses on the system level<br />
implementation testing, so that all of these factors are considered in the compliance testing.<br />
Intended users of this document include the same customer base implementing <strong>DVI</strong> today – computer<br />
OEM’s, monitor <strong>and</strong> panel makers, <strong>and</strong> graphics system vendors, as well as cable <strong>and</strong> connector<br />
manufacturers. The test <strong>and</strong> measurement <strong>guide</strong> enables independent testing of the transmitter system, the<br />
cable used between the transmitter <strong>and</strong> receiver systems, <strong>and</strong> the receiver system. This will allow system<br />
manufacturers who focus on just one piece of the communication link to separately test their parts, but will<br />
also allow complete system implementers the capability of diagnosing potential problems by checking each<br />
segment of the link independently.<br />
The document describes first the <strong>DVI</strong> link <strong>and</strong> system test points as well as the testing hardware.<br />
Subsequent sections describe independent testing of the transmitter, cable <strong>and</strong> receiver portions of the link.<br />
These procedures are briefly described below.<br />
<strong>DVI</strong> Transmitter <strong>Test</strong>ing Overview:<br />
For testing the transmitter system, hardware is described which allows a straightforward way of measuring<br />
the eye diagram of the TMDS output, using a reference clock that has the same characteristics of the<br />
receiver PLL that latches the TMDS input. This ensures that the eye diagram is measured as the receiver<br />
would see it – use of other clocks can add noise to the measurement <strong>and</strong> lead to the conclusion that a<br />
transmitter is showing degraded performance. To accomplish this measurement, a specific test board that<br />
makes the TMDS data signals readily accessible <strong>and</strong> a clock recovery unit to provide the reference clock<br />
are described. Since the transmitter measurements are of the transmitter system, this technique is equally<br />
applicable to discrete transmitter components or to graphics controllers that integrate TMDS output.<br />
Necessary equipment:<br />
• <strong>DVI</strong> transmitter system with <strong>DVI</strong> output receptacle:<br />
• TPA-P board<br />
• Digital Oscilloscope (see Section 3 for recommended models)<br />
<strong>DVI</strong> Cable <strong>Test</strong>ing Overview:<br />
<strong>Test</strong>ing the cable requires measuring a known eye diagram that can be input to the cable <strong>and</strong> then<br />
measuring the eye at the end of the cable. While to a first order, this can be approximated by measuring a<br />
transmitter eye as described above, <strong>and</strong> then measuring the eye again with a cable is connected, this does<br />
not allow sufficient control over shaping the eye diagram. In order to support cable testing, as well as<br />
3<br />
Release 1.0 DDWG Document – Subject to Change
eceiver testing as described below, an equivalent source board is described. Such a board will allow<br />
flexibility in shaping the eye, including generation of the minimum acceptable eye that can be output from<br />
a transmitter, as well as adding various amounts of jitter <strong>and</strong> skew to the TMDS transmission. Cable<br />
measurements should ideally be done with both minimum signal levels, which stress the attenuation<br />
performance of the cable, as well as maximum signal levels, which stress the crosstalk performance of the<br />
cable. Finally, since the complexity of eye diagram measurements, <strong>and</strong> the availability of the transmitter<br />
<strong>and</strong> receiver hardware necessary to perform these tests is not generally familiar to cable manufacturers,<br />
another approach to cable qualification is described. While not as rigorous as the eye measurements<br />
described above, <strong>and</strong> in more detail in Section 5, the alternative metrics described are more familiar tests to<br />
cable manufacturers <strong>and</strong> acceptable levels for these parameters are defined based on experience with the<br />
more rigorous eye diagram measurements.<br />
Necessary Equipment (for eye measurement characterization):<br />
• <strong>DVI</strong> Equivalent Source Board<br />
• TPA-P Board<br />
• TPA-R Board<br />
• Digital Oscilloscope<br />
<strong>DVI</strong> Receiver <strong>Test</strong>ing Overview:<br />
Finally, testing the receiver system requires a slightly different approach then measuring the eye diagram.<br />
The receiver specification is defined by demonstrating decoding of TMDS data with a minimum number of<br />
pixel errors even when receiving a worst-case eye diagram. In order to validate this requirement, control of<br />
the input eye diagram is required, which as noted, is accomplished by the equivalent source board. The<br />
second piece of hardware required is a receiver test board, which can check the output of the receiver<br />
system under test against the expected data in order to determine the number of pixel errors. This testing<br />
system will require the transmission of specific patterns, as described in chapter 6. A less rigorous, but<br />
more practical initial test is described which consists of monitoring the output to a display looking for pixel<br />
errors. While this is not a guarantee of receiver performance to a specific pixel error rate, it is generally the<br />
primary indicator of problems with the link, <strong>and</strong> could be used as a more qualitative performance indicator<br />
that might indicate the need for more rigorous testing if problems are observed. Once again, since the<br />
receiver test looks at the system implementation, including the signal layout, power supply performance,<br />
etc… the receiver test is equally applicable to systems with discrete TMDS receivers or receivers integrated<br />
into other image processing chips.<br />
Necessary equipment:<br />
• <strong>DVI</strong> Equivalent Source Board<br />
• <strong>DVI</strong> Cable Assembly<br />
• TPA-R Board<br />
• Pixel Error Rate <strong>Test</strong> Board (Method I) or<br />
• Display (method 2)<br />
• Digital Oscilloscope<br />
• TDR Scope (see section 3 for recommended models)<br />
With the release of this test <strong>and</strong> measurement <strong>guide</strong>, we are requesting feedback from the user community<br />
on the test procedures described within. The specific hardware described in this document is under<br />
development <strong>and</strong> reference design documents sufficient to allow production of this hardware will be made<br />
available by the DDWG once the designs are validated. At this time, the TPA-P <strong>and</strong> TPA-R boards are<br />
available, while the equivalent source boards (ESB) <strong>and</strong> Pixel Error Rate <strong>Test</strong> board are in development<br />
<strong>and</strong> some additional modifications will be made before they are made available.<br />
It should also be noted that this first version of the test <strong>and</strong> measurement <strong>guide</strong> does not cover all <strong>DVI</strong><br />
applications – specifically, the additional characteristics of dual link <strong>and</strong> HDCP implementations are not<br />
covered at this time. Furthermore, while the <strong>DVI</strong> connections allow analog signal transmission via <strong>DVI</strong>-I<br />
connectors <strong>and</strong> cabling, testing of analog signal quality is not described.<br />
4<br />
Release 1.0 DDWG Document – Subject to Change
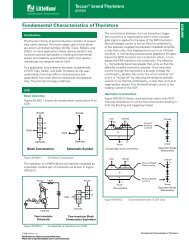
1 Introduction<br />
Context<br />
This document provides measurement <strong>guide</strong>lines for the evaluation of <strong>DVI</strong> components against the <strong>DVI</strong><br />
specification. The components that are tested are those elements of the link bounded by test points TP2 <strong>and</strong><br />
TP3’ as defined in the <strong>DVI</strong> specification (Figure 1-1).<br />
T0+<br />
T0-<br />
... ...<br />
TP1 TP2 TP3 TP4<br />
Transmitter<br />
Network<br />
...<br />
Figure 1-1 T.M.D.S. <strong>Test</strong> Points<br />
These test points are defined to be at the contact point between the mated connector pairs of the cable<br />
assembly. In practice, test point access will require a mated connector to be present to give access to the<br />
test point. The recommended test procedures always err toward understating system performance by<br />
moving test points to one side or the other of the mated connector pair based on which element is under test<br />
<strong>and</strong> which test is being performed. With unidirectional transmission, the effective test point will normally<br />
be to the downstream (to the right on the figure) side of the connector pair. The exception is the receiver<br />
impedance measurement, which views a reflected waveform <strong>and</strong> as such moves TP3 to the cable assembly<br />
side of the connector. All measurements include the effects of an additional mated connector pair.<br />
The elements to be tested are thus the transmitter, cable assembly, <strong>and</strong> receiver. The transmitter includes<br />
the transmitter component, connector, <strong>and</strong> interconnecting circuit board network. The receiver similarly<br />
includes the receiver component, connector, <strong>and</strong> interconnecting network. Hence in this document it is<br />
noted that the transmitter <strong>and</strong> the receiver mean subsystems of the T.M.D.S. link not components. This<br />
document includes recommendations for test fixtures, test equipment, <strong>and</strong> test methods for the evaluation<br />
of these elements.<br />
<strong>Test</strong> Philosophy<br />
Although skew, rise time, <strong>and</strong> jitter test procedures are described, the critical measure of <strong>DVI</strong> component<br />
operation is the eye pattern. For the transmitter, it is the eye pattern when driving a test load across all<br />
operating conditions. For the cable assembly it is the degradation of the eye pattern. For the receiver it is<br />
the response to degraded eye patterns. The eye pattern masks of the <strong>DVI</strong> specification are essential for the<br />
testing of link components.<br />
For the eye pattern <strong>and</strong> jitter measurement to be able to guarantee the 10 -9 pixel error rate, more than one<br />
billion acquisitions are required. But this takes too long to be practical <strong>and</strong> the statistical inference method<br />
is applied (in this document this method is called Method I) to reduce the number of acquisitions to a<br />
reasonable number. However, oftentimes due to the systematic jitter <strong>and</strong>/or noise in the system the<br />
...<br />
5<br />
Release 1.0 DDWG Document – Subject to Change<br />
Receiver<br />
Network...<br />
T0+<br />
T0-<br />
...
distribution is not quite r<strong>and</strong>om gaussian, <strong>and</strong> hence it is very difficult to infer the correct amount of signal<br />
degradation. Also in the visual application when the pixel noise is r<strong>and</strong>om <strong>and</strong> the pixel error rate is smaller<br />
than 10-6, it is almost impossible to detect any pixel noise from display. Hence in practice the eye pattern<br />
<strong>and</strong> jitter data can be collected based on a less rigorous but much more practical way (in this document this<br />
method is called Method II). In each of those sections the two different methods (a mathematically<br />
rigorous but impractical one <strong>and</strong> a less rigorous but much more practical one) will be presented for jitter<br />
<strong>and</strong> eye pattern measurement.<br />
Transmitter tests are relatively simple, but cable assembly <strong>and</strong> receivers are more difficult because they<br />
require a source for maximally degraded eyes, or worst-case eyes. The complexity of this testing is<br />
unavoidable for manufacturers of receivers, however this is not the only complexity which the receiver<br />
manufacturer must deal with <strong>and</strong> this <strong>guide</strong> does not attempt to provide any relief. For cable assembly<br />
manufacturers, however, for who this type of testing may not be familiar, alternative test procedures have<br />
been defined. These tests use familiar performance metrics <strong>and</strong> are described in Section 5.4.<br />
6<br />
Release 1.0 DDWG Document – Subject to Change
2 <strong>Test</strong> Fixtures<br />
The test fixturing described in this section should be constructed using good known practice. The test point<br />
access boards provide access to most necessary test points through SMA connectors with minimal signal<br />
degradation. Two variations for the TPA board are required, one with a <strong>DVI</strong> receptacle (TPA-R) <strong>and</strong> one<br />
with a <strong>DVI</strong> plug connector (TPA-P). The boards are otherwise identical.<br />
Because the test setups in some cases will be done with the plug version <strong>and</strong> measurements made on the<br />
receptacle version, it is important that these fixtures be closely matched in electrical characteristics for a<br />
given set of measurements. This can be accomplished through the use of the fixturing described below.<br />
2.1 Receptacle differential <strong>Test</strong> Fixture (TPA-R)<br />
The receptacle test fixture is used for cable assembly <strong>and</strong> receiver tests. The receptacle footprint is placed<br />
on an FR4 substrate layer using guarded microstrip construction <strong>and</strong> porting to test equipment using SMA<br />
connectors. Depending on the probes used for the differential data measurements, short stubs may need to<br />
be soldered to the active <strong>and</strong> ground points for the signals to be measured. Use of the vertical receptacle<br />
connector on this board is recommended, in order to minimize fixture effects on the test system. For<br />
transmitter testing the termination value must be set to 45 ohms (-10%) <strong>and</strong> 55 ohms (+10%). Each of the<br />
TPA boards also has a receptacle where an EDID PROM may be inserted. This will allow a valid EDID to<br />
be read if required by the graphics controller.<br />
Because the differential data lines are not connected to the clock recovery unit, some transmitters may not<br />
detect the receiver as active, <strong>and</strong> may shut down the digital output. If a driver is not available to maintain<br />
the digital port as active, reworking the board to connect the differential inputs to the clock recover unit<br />
may be required, but will degrade the signal measured. The TPA-R board will require an external power<br />
supply for operation.<br />
<strong>DVI</strong> Receptacle<br />
50 Ohm Terminations<br />
0+<br />
0-<br />
1+<br />
1-<br />
2+<br />
2-<br />
50 Ohm<br />
Term<br />
<strong>Test</strong> Access<br />
Board with<br />
Receptacle<br />
(TPA-R)<br />
Clock<br />
Recovery Unit<br />
Figure 2.1 <strong>Test</strong> Point Access Board, with receptacle<br />
7<br />
Release 1.0 DDWG Document – Subject to Change<br />
C+<br />
C-
2.2 Plug differential test fixture (TPA-P)<br />
The plug test fixture is used for cable assembly <strong>and</strong> transmitter tests. The plug footprint is placed on an<br />
FR4 substrate layer using the same construction as the TPA-R board, <strong>and</strong> ideally the two should be<br />
panelized in production to assure matched board characteristics between the two. For the plug fixture, a<br />
vertical mounted plug is used on the opposite side of the SMA connectors. This allows the TPA-P board to<br />
be plugged into a PC, for example, <strong>and</strong> still provide convenient access to the test points.<br />
50 Ohm Terminations<br />
50 Ohm<br />
Term<br />
0+<br />
0-<br />
1+<br />
1-<br />
2+<br />
2-<br />
<strong>Test</strong> Access<br />
Board with Plug<br />
(TPA-P)<br />
<strong>DVI</strong> Plug<br />
Clock Recovery<br />
Unit<br />
Power Connector<br />
Figure 2-2: <strong>Test</strong> Point Access Board, with plug<br />
8<br />
Release 1.0 DDWG Document – Subject to Change<br />
C+<br />
C-
2.3 Clock Recovery Unit<br />
The clock reference that is transmitted on the T.M.D.S. link contains low-frequency jitter components that are<br />
tracked by the receiver phase-locked loop <strong>and</strong> high-frequency components, which are not tracked. The purpose of<br />
the clock recovery unit is to remove these high frequency jitter components, producing a clock that will give an<br />
accurate representation of link performance when used as a trigger for eye pattern measurements. The clock<br />
recovery unit may be any circuit, including a full T.M.D.S. receiver, provided that it meets the requirements of the<br />
<strong>DVI</strong> specification, Section 4.7.3, as illustrated in Figure 2-1 below.<br />
+2<br />
-2<br />
Gain (dB)<br />
3.2<br />
Jitter Frequency (MHz)<br />
Figure 2-3 Clock Recovery Unit Frequency Response<br />
The clock recovery unit output must be at the pixel clock frequency or higher, with filtering characteristics that fall<br />
within the shaded boundaries of Figure 2-3 across the entire operating clock frequency range. The gain of a clock<br />
recovery circuit should be measured using the test configuration shown in Figure 2-4. Gain should be recorded for<br />
the following discrete jitter frequencies driven by a waveform generator: 0.5, 1.0, 1.5, 2.0, 2.5, 3.0, 3.3, 3.6, 4.0, 4.4,<br />
4.8, 5.2, 5.6, 6.0, 7, 8, 10, <strong>and</strong> 15 MHz. The test clock frequencies should include some or all of the following<br />
depending on the maximum allowed operating speed: 25MHz, 40MHz, 65MHz, 112MHz, <strong>and</strong> 165MHz.<br />
Waveform<br />
Generator<br />
Clock<br />
Recovery<br />
Unit<br />
4.8<br />
Spectrum<br />
Analyzer<br />
Figure 2-4 Clock Recovery Unit <strong>Test</strong><br />
-20 dB per<br />
decade<br />
9<br />
Release 1.0 DDWG Document – Subject to Change
Pattern<br />
Gen<br />
Ck<br />
Power Connector<br />
2.4 Equivalent source test boards<br />
This test board is necessary for cable assembly <strong>and</strong> receiver tests. Functionally, the board contains a test pattern<br />
generator, a clock source, which can add jitter of a controlled frequency <strong>and</strong> amplitude, a TMDS source, <strong>and</strong> a <strong>DVI</strong><br />
receptacle for driving the cable assembly or receiver under test.<br />
T.M.D.S.<br />
Equivalent<br />
Source<br />
TMDS<br />
Equivalent<br />
Source<br />
Board<br />
(ESB)<br />
<strong>DVI</strong> Receptacle<br />
Figure 2-5 Equivalent Source Board<br />
In practice, it is often simpler to provide an equivalent source board as a system of multiple boards, as shown below.<br />
In this configuration, the clock generation <strong>and</strong> power distribution are provided on one board, the pattern generation<br />
capability <strong>and</strong> user interface are provided on a second board, <strong>and</strong> the TMDS transmitter <strong>and</strong> adjustment capabilities<br />
on a third board. This allows reuse of the clock <strong>and</strong> pattern generation boards with multiple transmitter boards,<br />
which can be optimized for different tests.<br />
The first board used is the clock generator. This board is used for the clock source board, <strong>and</strong> may be used to inject<br />
jitter into the clock of a controlled frequency <strong>and</strong> amplitude. Currently this board is designed to provide up to 2<br />
MHz of jitter, although future iterations will allow up to 10 MHz of jitter, for a more comprehensive measurement.<br />
Jitter<br />
amplit.<br />
R8<br />
Jitter<br />
freq.<br />
SMA<br />
Clk_Out<br />
R10<br />
DC<br />
level<br />
R15<br />
Clk/Jitter board<br />
Power Connector<br />
Figure 2-6, Jitter Clock Source Board<br />
Tx<br />
3.3V1<br />
GND<br />
GND<br />
10<br />
Release 1.0 DDWG Document – Subject to Change<br />
JP4<br />
Rx<br />
3.3V2<br />
GND<br />
GND<br />
JP6<br />
VCC_PERT<br />
GND<br />
GND<br />
JP7
The second board contains a test pattern generator as well as an LCD module for a user interface to set test modes<br />
(pattern choices <strong>and</strong> durations) <strong>and</strong> view results (pixel error quantity). The pattern generator functions are described<br />
in more detail below. Pattern data may be output on a 12, 24, or 48 bit pixel bus, depending on the transmitter being<br />
used. The maximum clock speed for the pattern generation function is 85 MHz, so testing at 165 MHz will require<br />
either a 48 bit pixel input, or double data rate clocking of a 12 bit interface. As will be noted in the next section, it is<br />
convenient to also incorporate a pattern comparator function in this board to allow for quantitative pixel error rate<br />
measurements. Again, the pattern comparator is limited to 85 MHz operation, so for full speed testing of a <strong>DVI</strong> link<br />
at 165 MHz, 2 pixel per clock output mode must be used for the TMDS receiver operation. The pattern generator<br />
also supplies Hsync, Vsync, <strong>and</strong> DE signals according to VESA timing specifications. The board will operate in<br />
XGA or SXGA mode depending on the PROM loaded into the test board.<br />
PC Serial<br />
Port<br />
SMA Clk_In<br />
controls<br />
1 2 3<br />
PERT LCD<br />
PERT board<br />
(Pattern Generator/Comparator)<br />
JP7<br />
crystal<br />
SMA_P2<br />
RES.<br />
EEPROM<br />
reset<br />
POT<br />
GND<br />
GND<br />
3.6V<br />
FPGA<br />
Figure 2.7 Pattern Generator <strong>and</strong> Comparator Board<br />
The output of the pattern generator is supplied to the third board, containing a T.M.D.S. transmitter. This board has<br />
capabilities to vary the rise time, skew <strong>and</strong> amplitude of the differential data signals. Figure 2.8 shows the complete<br />
system of boards for the Equivalent Source Board, including the use of a TPA-P or TPA-R board to be used to<br />
calibrate the board, <strong>and</strong> the optional use of a receiver board to decode TMDS data for measuring pixel error rates, as<br />
11<br />
Release 1.0 DDWG Document – Subject to Change<br />
JP11<br />
GND<br />
VCC<br />
JP6<br />
Tx<br />
Rx<br />
Parallel Interface<br />
Parallel Interface
described in the next section. Collectively, the three boards are considered an equivalent source system, <strong>and</strong> will be<br />
shown as a single board for simplicity throughout the remainder of this <strong>guide</strong>.<br />
Clk/jitter board<br />
or AWG/<br />
Pattern gen.<br />
PC Serial<br />
Port PERT board<br />
(Pattern Generator/Comparator)<br />
PERT LCD<br />
crystal<br />
FPGA<br />
Parallel Interface<br />
Parallel Interface<br />
Tx board<br />
(ESB)<br />
Rx board<br />
Figure 2.8 Equivalent Source Board System<br />
TMDS Equivalent Source:<br />
Verification of cable assembly functionality must be done at the boundaries of transmitter signal quality, <strong>and</strong><br />
receiver functionality must be verified at the boundaries of signal quality through the transmitter <strong>and</strong> cable assembly<br />
pair. The equivalent source provides T.M.D.S. signals with adjustments to certain parameters to enable these<br />
boundary conditions to be applied to cable assemblies <strong>and</strong> receivers under test. The parameters that must be adjusted<br />
are swing voltage, jitter, rise time, <strong>and</strong> skew.<br />
It is recommended that a transmitter with variable swing voltage be used for the equivalent source board. Rise time<br />
degradation may be accomplished through the addition of RC networks, <strong>and</strong> a waveform generator may drive the<br />
input clock source with a controlled jitter. Set up of the equivalent source board requires the adjustment of the<br />
variable parameters to match the output of the source to an eye pattern template within a tolerance b<strong>and</strong>. These<br />
requirements are specified in the test setup sections of the cable assembly <strong>and</strong> receiver test sections.<br />
Note that these parameters are not all easily adjustable. Thus, with a variety of source setups required for testing, it<br />
may be most practical to have unique boards set up for different tests. For instance, changing a resistor value may<br />
vary a transmitter swing voltage, <strong>and</strong> RC networks may require several iterations to achieve the desired rise time<br />
degradation.<br />
In practice, it is difficult to provide a maximally degraded eye, which meets both the minimum amplitude <strong>and</strong> jitter<br />
openings, as shown in Figures 2.9 <strong>and</strong> 2.10. Thus it is appropriate to have two equivalent source boards, one of<br />
which can provide minimum amplitude, with some margin above the jitter spec, <strong>and</strong> another with minimum jitter<br />
tolerance <strong>and</strong> somewhat higher amplitudes. Each different clock speed (dependent on display resolution) will<br />
likewise require a specifically optimized board with an RC network tuned for that particular frequency.<br />
<strong>DVI</strong><br />
<strong>DVI</strong><br />
12<br />
Release 1.0 DDWG Document – Subject to Change<br />
"x"-meter<br />
<strong>DVI</strong> cable<br />
TPA_P TPA_R<br />
<strong>DVI</strong><br />
"x"-meter<br />
<strong>DVI</strong> cable
Figure 2.9 – Maximum Jitter Degradation of Eye Pattern<br />
Figure 2.10 – Maximum Amplitude Degradation of Eye Pattern<br />
Although validation of the equivalent source is done when eye patterns are correctly adjusted for the test procedures<br />
that follow, it will be desirable to verify the pattern generator in a simplified system environment, using a nominal<br />
cable <strong>and</strong> receiver.<br />
Using these three boards, it is possible to drive a variety of different waveforms into a cable or a receiver system to<br />
determine whether or not they are <strong>DVI</strong> compliant. In either case, an iterative approach of setting up the equivalent<br />
source to provide for example, a worst-case eye, verifying it with the TPA boards, <strong>and</strong> then driving this waveform<br />
into the device under test would be used.<br />
Pattern Generator<br />
Two data patterns are required for the test measurements of this <strong>guide</strong>. For rise time <strong>and</strong> skew measurements, a data<br />
pattern with fewer transitions in the serial bit stream is used. This is referred to as the half clock pattern. For eye<br />
pattern measurements <strong>and</strong> pixel error rate tests, a pseudo r<strong>and</strong>om data pattern is used. When driving either test<br />
pattern the DE signal should be made inactive for a duration of 128 pixel clocks at the minimum <strong>DVI</strong> specified rate<br />
of once every 50 ms.<br />
The half clock data pattern consists of alternating 0x3FF (all ones) <strong>and</strong> 0x000 (all zeros) T.M.D.S. characters. This<br />
data pattern occurs when alternating values of 0x01 <strong>and</strong> 0xFF are driven into the encoder, which will produce<br />
alternating 0x3FF <strong>and</strong> 0x000 characters on the serial T.M.D.S. signal lines. Note that the character boundary is not<br />
necessarily aligned with the pixel clock boundary. This low-frequency data pattern is used to determine the nominal<br />
high <strong>and</strong> low levels on the link as well as to measure skew <strong>and</strong> rise time. All T.M.D.S. data channels should be<br />
driven simultaneously with this same pattern.<br />
13<br />
Release 1.0 DDWG Document – Subject to Change
Output<br />
23 22 . . . . 5 4 3 2 1<br />
XOR<br />
Figure 2-11 Pseudo R<strong>and</strong>om Sequence Generator<br />
The pseudo r<strong>and</strong>om data pattern is a maximal-length sequence produced by a 23-bit linear feedback shift register<br />
(LFSR) with generator polynomial x 23 + x 5 +1. The logic diagram of Figure 2-11 produces the desired sequence<br />
when initialized to any non-zero value. The output serial stream becomes the input to the encoder, with the least<br />
significant bit of the input byte loaded first. This sequence contains a maximum run lengths of 23 ones <strong>and</strong> 22 zeroes<br />
for input to the T.M.D.S. encoder, <strong>and</strong> repeats after 2 23 -1 bits. Simulation of 10 9 encoded bytes from this input<br />
sequence has shown maximum run lengths of 21 ones <strong>and</strong> 21 zeros in the encoded bit stream, with all possible<br />
encoded values exercised.<br />
When generating the pseudo r<strong>and</strong>om data pattern, each T.M.D.S. channel should be driven by a different phase of<br />
the shift register output. This may be done by implementing a separate shift register with unique initial values per<br />
channel or by taking the output from different bits of the register. To achieve the required speed, the LFSR may be<br />
run at the parallel clock rate, advancing the pipeline one position for each pixel clock.<br />
It is strongly recommended that T.M.D.S. transmitters integrate this test pattern generator capability. For<br />
interoperability we recommend that the implementation should use the value of 0x000001 (all 22 bits are zeros<br />
except the LSB, bit 1 in Figure 2-11) as a seed. The 24 bits for channel 2[7:0], channel 1[7:0], <strong>and</strong> channel 0[7:0]<br />
data should be taken from {shift_out, bit[23:1]}. For the receiver side pattern generation system to be able to<br />
synchronize the initialization should take place at a pre-defined timing. The first DE rising edge after VSYNC<br />
should be used as a load signal of the seed. The pipeline should be advanced by one position for each pixel clock.<br />
14<br />
Release 1.0 DDWG Document – Subject to Change
2.5 Receiver <strong>Test</strong> Board<br />
For receiver testing the visual test method is often the first measurement which is used. In this case the receiver test<br />
board is not needed. However, when the receiver manufacturer wants to quantify the pixel error rate then they will<br />
need this board or some equivalent instrument. As noted in Section 2.4, it is often convenient to incorporate a<br />
pattern reader <strong>and</strong> comparator into the pattern generation board used in the equivalent source system.<br />
The receiver test board may be used for testing cables, but it is more likely to be used for testing receivers. No signal<br />
test points are necessary on this board, but some arrangement for the interface <strong>and</strong> the test pattern reader is required.<br />
Note that this test board can be completely replaced with other equipment such as a logic analyzer provided it<br />
implements the interface <strong>and</strong> pattern reader functions described below.<br />
Interface<br />
Pixedl<br />
Data<br />
Capture<br />
Pixel Error<br />
Rate <strong>Test</strong><br />
Board<br />
(PERT)<br />
Pattern<br />
Reader<br />
Figure 2-1 Receiver <strong>Test</strong> Board<br />
Interface<br />
The interface unit reads the parallel pixel data from the receiver <strong>and</strong> feeds them to the data capture logic. To<br />
minimize the signal quality degradation the interface unit must have minimal physical dimensions so the loading<br />
capacitance is small <strong>and</strong> will not interrupt the normal operation. These signals are easier to h<strong>and</strong>le than the T.M.D.S.<br />
signal, however, since they are slower signals <strong>and</strong> have a larger signal swing.<br />
Pattern Reader<br />
The test board or the system must have a pseudo-r<strong>and</strong>om pattern reading capability (or an interface to such a reader)<br />
for pixel error rate test (PERT) measurements. The reader must be capable of auto-sync on the 2 23 -1 bit data<br />
sequence defined in section 2.4, <strong>and</strong> must have a pixel error counter with reset. Any number of errors within the<br />
realigned three bytes of a single T.M.D.S. link constitutes one pixel error. A simple implementation of the PERT<br />
board would include a manual-reset error counter with a seven-segment LED display. The test may be performed<br />
over a time interval representing a known number of pixels <strong>and</strong> since the error count should be very low not many<br />
digits are necessary in the display.<br />
For proper operation with the transmitter side r<strong>and</strong>om pattern generator, the pattern reader should be able to achieve<br />
the synchronized initialization as defined in section 2.2.<br />
15<br />
Release 1.0 DDWG Document – Subject to Change
3 <strong>Test</strong> Equipment<br />
Minimum requirements for <strong>and</strong> recommended models of test instruments are presented. Note that the list is not<br />
intended to be exhaustive <strong>and</strong> other br<strong>and</strong>s of equipment can be used if their performance is equivalent to or better<br />
than the specifications below.<br />
TDR Scope<br />
For receiver impedance measurements one of the following digital sampling oscilloscopes with a TDR module can<br />
be used. The most important parameters are the rise time of the TDR module <strong>and</strong> the scope b<strong>and</strong>width. The rise time<br />
must be smaller than 50 ps <strong>and</strong> the b<strong>and</strong>width must be greater than 20 GHz.<br />
• Tektronix 11801B/C Digital Sampling Oscilloscope with SD24 Sampling Head<br />
• HP 54750A Digitizing Oscilloscope with HP 54753A TDR/TDT Module<br />
Spectrum Analyzer<br />
For clock recovery unit validation the jitter that is intentionally added by a waveform generator will be measured at<br />
the input <strong>and</strong> the output of the clock recovery unit (Figure 2-4). Since the frequency range of the pixel clock is from<br />
25MHz to at most a few hundred MHz, the frequency range of the spectrum analyzer is not an issue, i.e., almost all<br />
spectrum analyzers can meet the requirement. More important parameters are the frequency response <strong>and</strong> the<br />
resolution b<strong>and</strong>width. Amplitude accuracy of frequency response must be within +/-1.5dB over the measurement<br />
range <strong>and</strong> the minimum resolution b<strong>and</strong>width must be less than or equal to 1KHz.<br />
• Tektronix 2712<br />
• HP 8590L<br />
• HP E4411B<br />
Waveform Generators<br />
Waveform generators are used for clock input to the equivalent source board, for clock recovery unit validation, <strong>and</strong><br />
for jitter measurements. The jitter of the master clock of the waveform generator must be at most 20 ps rms at 1 GHz<br />
or less than 2 percent of the period of the finest time scale of the equipment.<br />
16<br />
Release 1.0 DDWG Document – Subject to Change
4 Transmitter <strong>Test</strong> <strong>Measurement</strong>s<br />
4.1 <strong>Test</strong> Setup<br />
All transmitter tests are completed using the test setup of Figure 4-1. With both the half clock <strong>and</strong> the pseudor<strong>and</strong>om<br />
data patterns required for test measurements, it is recommended that the source driving the transmitter<br />
should implement pattern generator described in section 2.4.<br />
T.M.D.S.<br />
Transmitter<br />
TMDS<br />
Transmitter<br />
Under <strong>Test</strong><br />
<strong>DVI</strong> Receptacle<br />
<strong>DVI</strong> Plug<br />
50 Ohm<br />
Term<br />
<strong>Test</strong> Access<br />
Board with<br />
Plug<br />
(TPA-P)<br />
Clock Recovery<br />
Unit<br />
17<br />
Release 1.0 DDWG Document – Subject to Change<br />
50 Ohm Terminations<br />
Figure 4-1 Transmitter <strong>Test</strong> Configuration<br />
Normalized amplitude measurements are necessary for both single-ended <strong>and</strong> differential testing of the T.M.D.S.<br />
interface. These measurements are made with transmission of the half clock test pattern, <strong>and</strong> with the time base of<br />
the measurement equipment set to a scale that is coarse enough to observe at least two full pixel times. The average<br />
high-level <strong>and</strong> low-level amplitudes are determined at the point where signal ringing has subsided. These averages<br />
establish the swing voltage <strong>and</strong> are used to normalize the eye diagram.<br />
4.2 Rise/Fall<br />
Rise time is a differential measurement across the outputs of a differential pair while the half clock data pattern is<br />
transmitted. The trigger source of the scope is the half clock itself, i.e., the scope is self-triggered by the half clock<br />
data signal. Both rising <strong>and</strong> falling edges are measured. The rise time is defined as the time interval between the<br />
normalized 20% <strong>and</strong> 80% amplitude levels. It is recommended that the averaging feature of the equipment be used<br />
to read more stable values.<br />
When the equipment’s rise time is not negligible compared to the signal’s rise time, the effect of the equipment<br />
should be removed using the equation:<br />
0+<br />
0-<br />
1+<br />
1-<br />
2+<br />
2-<br />
2<br />
2<br />
( Trise,<br />
fall _ measured)<br />
( Trise,<br />
fall _ )<br />
Trise, fall =<br />
−<br />
equipment<br />
In order to reduce the measurement error when using this equation, it is recommended that the equipment rise time<br />
be less than one third of the signal rise time.<br />
C+<br />
C-
4.3 Skew<br />
The transmitter skew is the time difference between the two differential signals measured at the normalized 50%<br />
crossover point. This measurement is taken using two single ended probes. The trigger source can be either one of<br />
the two differential signals. Skew in the test set-up must be calibrated <strong>and</strong> removed from the recorded measurements<br />
by connecting both probes to the same signal. All of the signal pairs must be measured <strong>and</strong> the worst case recorded.<br />
4.4 Jitter<br />
Jitter measurement is performed as a differential measurement of the rising edge of the clock signal (clk+ minus<br />
clk-). The clock signal from the clock recovery unit in Section 2.1 must be used as a trigger source.<br />
Method I: The differential clock signal must be accumulated for at least 100,000 acquisitions. The scope is used to<br />
determine the st<strong>and</strong>ard deviation of the 50% crossings in measuring time statistics of the differential clock signal.<br />
The r<strong>and</strong>om jitter at 10 -9 pixel error rate will be the ±6 sigma limit points of the distribution. When the jitter includes<br />
any systematic components, care must be taken in obtaining the sigma value from the scope, otherwise the<br />
overestimated sigma value can lead to an excessively large value of the jitter limit.<br />
Method II: As an easier <strong>and</strong> more practical alternative, accumulate at least 1,000,000 acquisitions <strong>and</strong> read the peakto-peak<br />
jitter amount<br />
4.5 Eye Pattern<br />
Eye measurement is performed as a differential measurement <strong>and</strong> the clock signal from the clock recovery unit in<br />
Section 2.1 must be used as a trigger source.<br />
Method I: This test is made as a measurement of 100,000 acquisitions to achieve 99% confidence within 1% error of<br />
the mean value assuming normal distribution of the waveforms in the eye diagram. Referring to <strong>DVI</strong> transmitter eye<br />
pattern requirement of Figure 4.2, there are eight critical locations to collect the data of the means <strong>and</strong> st<strong>and</strong>ard<br />
deviations: at six horizontal segments of (0 < x < 0.15, y=0), (0.85 < x < 1.0, y=0), (0 < x < 0.32, y=0.25), (0.68 < x<br />
< 1.0, y=0.25), (0 < x
Normalized Differential Amplitude<br />
0.65<br />
0.50<br />
0.25<br />
0.0<br />
-0.25<br />
-0.50<br />
-0.65<br />
0.0 0.15 0.32 0.68 0.85 1.0<br />
Normalized Time<br />
Figure 4-2 Normalized Eye Pattern Mask at TP2<br />
This test should then be repeated across all operating conditions of temperature, termination voltage, <strong>and</strong> termination<br />
resistance while the transmitter drives the pseudo-r<strong>and</strong>om data test pattern to ensure that the eye diagram limits<br />
given by the <strong>DVI</strong> spec are not exceeded.<br />
19<br />
Release 1.0 DDWG Document – Subject to Change
5 Cable Assembly <strong>Test</strong> <strong>Measurement</strong>s<br />
5.1 Equivalent Source Setup<br />
The T.M.D.S. equivalent source is connected to the TPA-P board <strong>and</strong> the equivalent source is adjusted to produce a<br />
low-amplitude eye pattern (Figure 5-2) <strong>and</strong> high-amplitude eye pattern (Figure 5-3) for input to the cable assembly<br />
under test. In each case the equivalent source must be adjusted to have, over the course of 1,000,000 acquisitions,<br />
points within the stippled regions of the mask but to have no points outside of the dark gray regions of the mask.<br />
Pattern<br />
Gen<br />
Ck<br />
Power Connector<br />
T.M.D.S.<br />
Equivalent<br />
Source<br />
TMDS<br />
Equivalent<br />
Source<br />
Board<br />
(ESB)<br />
Note that these masks are represented in absolute voltage levels.<br />
Differential Amplitude (mV)<br />
400<br />
200<br />
0<br />
-200<br />
-400<br />
0.0 0.15 0.32 0.68 0.85 1.0<br />
Normalized Time<br />
Figure 5-2 Cable <strong>Test</strong> Low-amplitude Eye Mask<br />
<strong>DVI</strong> Receptacle<br />
20<br />
Release 1.0 DDWG Document – Subject to Change<br />
<strong>DVI</strong> Plug<br />
50 Ohm Terminations<br />
50 Ohm<br />
Term<br />
0+<br />
0-<br />
1+<br />
1-<br />
2+<br />
2-<br />
<strong>Test</strong> Access<br />
Board with<br />
Plug<br />
(TPA-P)<br />
Clock Recovery<br />
Unit<br />
Figure 5-1 Cable Assembly <strong>Test</strong> Setup Configuration<br />
Differential Amplitude (mV)<br />
780<br />
700<br />
200<br />
0<br />
-200<br />
-700<br />
-780<br />
C+<br />
C-<br />
0.0 0.15 0.32 0.68 0.85 1.0<br />
Normalized Time<br />
Figure 5-3 Cable <strong>Test</strong> High-amplitude Eye Mask
Once the eye has been adjusted the TPA-P is removed <strong>and</strong> is replaced by the cable assembly to be tested <strong>and</strong> a TPA-<br />
R (Figure 5-4). If it is desired to complete pixel error rate testing, a receiver test board is used in place of the TPA-R<br />
board.<br />
Pattern<br />
Gen<br />
Ck<br />
Power Connector<br />
T.M.D.S.<br />
Equivalent<br />
Source<br />
TMDS<br />
Equivalent<br />
Source<br />
Board<br />
(ESB)<br />
<strong>DVI</strong> Receptacle<br />
<strong>DVI</strong> Plug<br />
<strong>DVI</strong> Cable Assembly<br />
Figure 5-4 Cable Assembly <strong>Test</strong> Configuration<br />
21<br />
Release 1.0 DDWG Document – Subject to Change<br />
<strong>DVI</strong> Plug<br />
<strong>DVI</strong> Receptacle<br />
<strong>Test</strong> Access<br />
Board with<br />
Receptacle<br />
(TPA-R)<br />
Clock<br />
Recovery Unit<br />
5.2 Skew<br />
The cable assembly skew is the time difference between the two differential signals measured at the normalized 50%<br />
crossover point. TDR methods for the measurement of intra-pair <strong>and</strong> inter-pair skew on the cable assemblies are<br />
suggested for implementation, instead of TMDS signaling. These methodologies are well-defined, <strong>and</strong> can allow for<br />
greater precision in the measurement.<br />
Alternatively, this measurement can be taken using two single-ended probes on the TPA board. Skew in the test setup<br />
must be calibrated <strong>and</strong> removed from the recorded measurements. The equivalent source board transmits a<br />
continuous half clock character pattern. The data is averaged using an averaging scope. An easy method to view <strong>and</strong><br />
measure the skew between these signals is to invert one of the signals. All of the signal pairs must be measured <strong>and</strong><br />
the worst case recorded.<br />
5.3 Eye Pattern<br />
This test is made as a differential measurement at the TPA board of 1,000,000 acquisitions. The resultant eye<br />
diagram must be equal or better than the one shown in Figure 5-5.<br />
50 Ohm Terminations<br />
50 Ohm<br />
Term<br />
0+<br />
0-<br />
1+<br />
1-<br />
2+<br />
2-<br />
C+<br />
C-
5.4 Parametric <strong>Measurement</strong>s<br />
The cable assembly performance metrics listed in Table 1 are intended to offer the cable assembly manufacturer an<br />
alternative to eye pattern testing. These have been derived from well-known variables of assembly performance, in<br />
order to equivalently meet the eye pattern <strong>and</strong> PERT requirements of the link.<br />
The impedance specification should be applied using the same interpretation as that stated on page 38 of the <strong>DVI</strong><br />
specification, table 4-7, note a: “Within the exception window no single impedance excursion shall exceed the<br />
through connection impedance tolerance for a period of twice the TDR rise time specification. The maximum<br />
excursion within the exception window shall not exceed +75% <strong>and</strong> –25% of the nominal cable impedance.”<br />
Parameter Value<br />
Near End Crosstalk 4%<br />
Far End Crosstalk 3%<br />
Differential Attenuation 8 dB at 825 MHz<br />
Intra-pair Skew 151 picoseconds<br />
Propagation Delay 5.05 nanoseconds/meter<br />
Differential Impedance 100 ohms +/- 20<br />
Table 5-1 Cable Assembly <strong>Test</strong> Parameters<br />
22<br />
Release 1.0 DDWG Document – Subject to Change
6 Receiver <strong>Test</strong> <strong>Measurement</strong>s<br />
6.1 Equivalent Source Setup<br />
The T.M.D.S. equivalent source is connected to the TPA-R board through a <strong>DVI</strong> cable assembly <strong>and</strong> the equivalent<br />
source is adjusted to produce low-amplitude eye pattern (Figure 6-2) <strong>and</strong> high-amplitude eye pattern (Figure 6-3) for<br />
input to the receiver under test. In each case the equivalent source must be adjusted to have, over the course of predefined<br />
number of samples, points within the stippled regions of the mask but to have no points outside of the dark<br />
gray regions of the mask. Note that these masks are represented in absolute voltage levels.<br />
In case of Method I: The equivalent source must be adjusted so that the degraded eye diagram by +/-6 sigma should<br />
fit Figure 6-2 <strong>and</strong> Figure 6-3. As a differential measurement at the cable end with TPA-R board 100,000 acquisitions<br />
must be obtained to achieve 99% confidence within 1% error of the mean value assuming normal distribution of the<br />
waveforms in the eye diagram. There are eight critical locations to collect the data of the means <strong>and</strong> st<strong>and</strong>ard<br />
deviations: at six horizontal segments of (0 < x < 0.25, y=0), (0.75 < x < 1.0, y=0), (0 < x < 0.30, y=75mv), (0.70 <<br />
x < 1.0, y=75mv), (0 < x
Differential Amplitude (mV)<br />
300<br />
75<br />
0<br />
-75<br />
-300<br />
0.0 0.25 0.30<br />
0.70 0.75 1.0<br />
Normalized Time<br />
Figure 6-2 Receiver <strong>Test</strong> Low-amplitude Eye Mask<br />
Differential Amplitude (mV)<br />
24<br />
Release 1.0 DDWG Document – Subject to Change<br />
780<br />
700<br />
75<br />
0<br />
-75<br />
-700<br />
-780<br />
0.0 0.25 0.30<br />
0.70 0.75 1.0<br />
Normalized Time<br />
Figure 6-3 Receiver <strong>Test</strong> High-amplitude Eye Mask<br />
6.2 Receiver <strong>Test</strong><br />
Method I: In this case the receiver pixel error rate is measured with the source set up according to Method I using<br />
the receiver test board or instrument described in Section 2.3.<br />
Duration of the pixel error rate test<br />
For the pixel error rate of 10 -9 , at least one billion pixels should be tested. The following table shows the required<br />
amount of time for one billion pixels at each of the major resolutions of display, assuming a 60Hz refresh rate.<br />
Resolution Clock Frequency Time for one billion pixels<br />
VGA 25 MHz 40 Sec<br />
SVGA 40 MHz 25 Sec<br />
XGA 65 MHz 15 Sec<br />
SXGA 112 MHz 9 Sec<br />
UXGA 165 MHz 6 Sec<br />
Table 6-1: Time required for 1 billion pixels at different display resolutions<br />
To collect a statistically valid data for the pixel error rate, measurements should be made at least ten times<br />
independently.<br />
Method II: In this case the display is checked to see if there is any noise on the recovered image. Meticulous<br />
observation during at least one minute must <strong>rev</strong>eal no pixel noise.
Power<br />
Connector<br />
TMDS<br />
Equivalent<br />
Source<br />
Board<br />
(ESB)<br />
<strong>DVI</strong> Receptacle<br />
<strong>DVI</strong> Plug<br />
T.M.D.S.<br />
Pattern<br />
Equivalent<br />
<strong>DVI</strong> Cable Assembly<br />
Gen<br />
Source<br />
T.M.D.S.<br />
Receiver<br />
Interface<br />
Ck<br />
Pattern<br />
Gen<br />
Ck<br />
Power<br />
Connector<br />
T.M.D.S.<br />
Equivalent<br />
Source<br />
TMDS<br />
Equivalent<br />
Source<br />
Board<br />
(ESB)<br />
<strong>DVI</strong> Receptacle<br />
<strong>DVI</strong> Plug<br />
<strong>DVI</strong> Plug<br />
<strong>DVI</strong> Receptacle<br />
Receiver<br />
Figure 6-4 Receiver <strong>Test</strong> Configuration (Method I)<br />
<strong>DVI</strong> Cable<br />
Assembly<br />
25<br />
Release 1.0 DDWG Document – Subject to Change<br />
<strong>DVI</strong> Plug<br />
<strong>DVI</strong> Receptacle<br />
T.M.D.S.<br />
Receiver<br />
Receiver<br />
Figure 6-5 Receiver <strong>Test</strong> Configuration (Method II)<br />
Pixel<br />
Data<br />
Capture<br />
Pattern<br />
Reader<br />
Pixel Error<br />
Rate <strong>Test</strong> Board<br />
(Pert)<br />
DISPLAY
6.3 Receiver Impedance<br />
TDR Scope<br />
TPA-P<br />
Vcc<br />
Receiver<br />
GND<br />
<strong>Test</strong> Configuration for<br />
TDR <strong>Measurement</strong> of<br />
Receiver Impedance<br />
Figure 6-6 Receiver Impedance <strong>Test</strong> <strong>Measurement</strong><br />
-3.3V<br />
26<br />
Release 1.0 DDWG Document – Subject to Change<br />
Power<br />
Supply<br />
The differential time-domain reflectometry (TDR) test setup measures the reflected waveform returned from a load<br />
when driven with a step input. It is obtained by driving the load under test with a step waveform using a driver with<br />
a specified source impedance <strong>and</strong> rise time. The reflected waveform is the difference between (a) the observed<br />
waveform at the device under test when driven with the specified test signal, <strong>and</strong> (b) the waveform that results when<br />
driving a st<strong>and</strong>ard test load with the same specified test signal. From this measurement result we can infer the<br />
impedance of the device under test.<br />
The driving waveform source is a balanced, differential 100-ohm source with a 75 ps rise time.