Georgia Study of Early Care and Education: Child - Bright from the ...
Georgia Study of Early Care and Education: Child - Bright from the ...
Georgia Study of Early Care and Education: Child - Bright from the ...

Create successful ePaper yourself
Turn your PDF publications into a flip-book with our unique Google optimized e-Paper software.
<strong>Georgia</strong><br />
<strong>Study</strong> <strong>of</strong><br />
<strong>Early</strong> <strong>Care</strong><br />
<strong>and</strong><strong>Education</strong><br />
<strong>Child</strong> <strong>Care</strong><br />
Center<br />
Findings<br />
December 2009
<strong>Georgia</strong><br />
<strong>Study</strong> <strong>of</strong><br />
<strong>Early</strong> <strong>Care</strong><br />
<strong>and</strong><strong>Education</strong><br />
<strong>Child</strong> <strong>Care</strong><br />
Center<br />
Findings<br />
December 2009
Suggested citation: Maxwell, K. L., <strong>Early</strong>, D. M., Bryant, D., Kraus, S., Hume, K.,<br />
& Crawford, G. (2009). <strong>Georgia</strong> study <strong>of</strong> early care <strong>and</strong> education: <strong>Child</strong> care center<br />
findings. Chapel Hill, NC: The University <strong>of</strong> North Carolina at Chapel Hill, FPG <strong>Child</strong><br />
Development Institute.<br />
This study was funded by <strong>Bright</strong> <strong>from</strong> <strong>the</strong> Start: <strong>Georgia</strong> Department <strong>of</strong> <strong>Early</strong> <strong>Care</strong><br />
<strong>and</strong> Learning (DECAL). The opinions expressed in this report may or may not reflect<br />
those <strong>of</strong> <strong>the</strong> funding agency.<br />
Several people worked hard to complete this study <strong>and</strong> report. The FPG <strong>Child</strong><br />
Development Institute team included Kelly Maxwell, Principal Investigator, Diane<br />
<strong>Early</strong>, Investigator; Donna Bryant, Investigator; Syndee Kraus, project director; Sara<br />
Fuller, research assistant; Katie Hume, research assistant; Gina Walker, administrative<br />
assistant; Elizabeth Gunn, Lloyd DeWald, <strong>and</strong> Michelle Lemon, programmers; Kirsten<br />
Kainz <strong>and</strong> R. J. Wirth, statisticians; <strong>and</strong> Angelia Baldwin, Joe Jungers, <strong>and</strong> Dawn<br />
Shafar, data entry. Gisele Crawford helped with report writing, Michael Brady <strong>and</strong><br />
Gina Harrison helped with report design. We are very grateful to <strong>the</strong> five research<br />
assistants in <strong>Georgia</strong> who worked so hard to collect <strong>the</strong> data: Elizabeth Cr<strong>of</strong>ton,<br />
Rachael Lee, Moneesha Smith, Becca White, <strong>and</strong> Othondra Williams-Hicks. Jenny<br />
Rankin also helped collect some data. We appreciate <strong>the</strong> cooperation <strong>of</strong> DECAL<br />
staff, particularly <strong>the</strong> assistance <strong>of</strong> Bentley Ponder. Most importantly, we are very<br />
appreciative <strong>of</strong> <strong>the</strong> administrators <strong>and</strong> teachers who welcomed us into <strong>the</strong>ir programs<br />
<strong>and</strong> classrooms so that we could better underst<strong>and</strong> <strong>the</strong> care available to young<br />
children across <strong>Georgia</strong>.<br />
Executive summaries <strong>and</strong> full reports <strong>from</strong> this study are available at<br />
www.decal.ga.gov.
Contents<br />
<strong>Study</strong> Description .................................................................................... 2<br />
Program Selection ............................................................................ 2<br />
Classroom Selection ......................................................................... 2<br />
Measures ......................................................................................... 3<br />
Procedures ....................................................................................... 5<br />
Findings .................................................................................................. 6<br />
Group Size <strong>and</strong> Ratios ...................................................................... 6<br />
Teacher Turnover .............................................................................. 6<br />
Classroom Quality ............................................................................ 8<br />
Infant/Toddler Classroom Quality ................................................ 8<br />
Preschool Classroom Quality ....................................................... 9<br />
<strong>Education</strong> <strong>and</strong> Pr<strong>of</strong>essional Development .......................................... 10<br />
Directors ................................................................................... 10<br />
Lead Teachers ........................................................................... 11<br />
Assistant Teachers ..................................................................... 12<br />
Program Characteristics <strong>and</strong> Services ............................................... 15<br />
Curricula <strong>and</strong> <strong>Child</strong> Assessments ................................................ 15<br />
Screenings ................................................................................ 15<br />
Involving Families ....................................................................... 16<br />
<strong>Study</strong> Limitations .................................................................................... 17<br />
Conclusions <strong>and</strong> Recommendations ......................................................... 18<br />
References .............................................................................................. 22
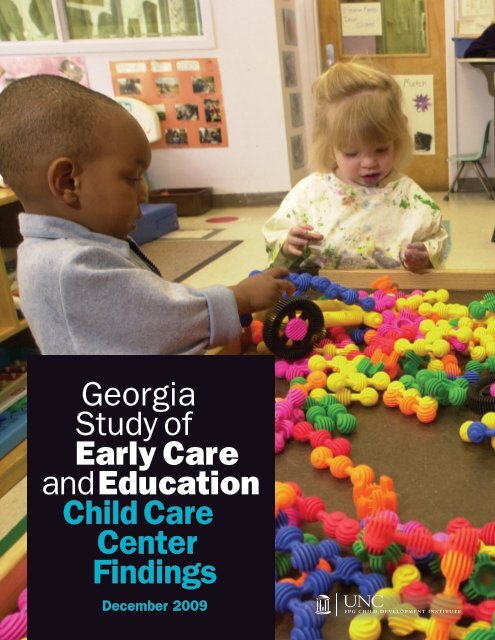
<strong>Georgia</strong> <strong>Study</strong> <strong>of</strong><br />
<strong>Early</strong> <strong>Care</strong> <strong>and</strong> <strong>Education</strong>:<br />
<strong>Child</strong> <strong>Care</strong> Center Findings<br />
Nationwide, most young children are cared for regularly by someone o<strong>the</strong>r<br />
than <strong>the</strong>ir parents. Twenty percent (20%) <strong>of</strong> all infants <strong>and</strong> toddlers <strong>and</strong><br />
44% <strong>of</strong> all three- <strong>and</strong> four-year-olds are served in a center-based care<br />
arrangement. The percentages are higher in <strong>the</strong> Sou<strong>the</strong>astern part <strong>of</strong> <strong>the</strong><br />
U.S.: 25% <strong>of</strong> all infants <strong>and</strong> toddlers <strong>and</strong> 56% <strong>of</strong> preschoolers are served in<br />
child care centers. 1 Research has demonstrated a modest but statistically<br />
significant link 2 between <strong>the</strong> quality <strong>of</strong> child care <strong>and</strong> children’s academic<br />
<strong>and</strong> social skills. 3, 4, 5 Research on brain development has underscored <strong>the</strong><br />
importance <strong>of</strong> providing high quality experiences for young children. 6,7<br />
Thus, improving child care quality is an important strategy for supporting<br />
children’s readiness for school success.<br />
<strong>Bright</strong> <strong>from</strong> <strong>the</strong> Start: <strong>Georgia</strong> Department <strong>of</strong> <strong>Early</strong> <strong>Care</strong> <strong>and</strong> Learning<br />
(DECAL) has been working to define <strong>and</strong> promote high quality practices<br />
across multiple types <strong>of</strong> child care settings. A statewide committee began<br />
working in <strong>the</strong> fall <strong>of</strong> 2006 to develop indicators to define quality in <strong>Georgia</strong>’s<br />
early care <strong>and</strong> education system. In <strong>the</strong> fall <strong>of</strong> 2007, DECAL contracted with<br />
researchers <strong>from</strong> <strong>the</strong> FPG <strong>Child</strong> Development Institute at <strong>the</strong> University <strong>of</strong><br />
North Carolina at Chapel Hill to help refine <strong>the</strong> indicators, develop tools<br />
to measure <strong>the</strong>m, <strong>and</strong> plan a study <strong>of</strong> <strong>the</strong> quality <strong>of</strong> care across <strong>the</strong> state. 8<br />
DECAL decided that a statewide study would help policymakers better<br />
underst<strong>and</strong> <strong>the</strong> quality <strong>of</strong> care across <strong>Georgia</strong>, inform <strong>the</strong>ir decisions about<br />
strategies to maximize investments in quality, <strong>and</strong> provide baseline data<br />
<strong>from</strong> which to measure quality improvements.<br />
In 2008–09, FPG conducted a statewide study <strong>of</strong> r<strong>and</strong>omly selected licensed<br />
child care centers <strong>and</strong> <strong>Georgia</strong>’s Pre-K programs, collecting data on <strong>the</strong><br />
observed classroom quality <strong>and</strong> characteristics <strong>of</strong> <strong>the</strong>se programs. The<br />
current report provides an overview <strong>of</strong> <strong>the</strong> study <strong>and</strong> summarizes findings<br />
<strong>from</strong> infant, toddler, <strong>and</strong> preschool classrooms in child care centers. Findings<br />
about <strong>Georgia</strong>’s Pre-K classrooms, both in centers <strong>and</strong> in schools, can be<br />
found in a companion report, <strong>Georgia</strong> <strong>Study</strong> <strong>of</strong> <strong>Early</strong> <strong>Care</strong> <strong>and</strong> <strong>Education</strong>:<br />
Findings <strong>from</strong> <strong>Georgia</strong>’s Pre-K Program.<br />
“Critical aspects<br />
<strong>of</strong> brain architecture<br />
begin to be shaped<br />
by experience<br />
before <strong>and</strong><br />
soon after birth,<br />
<strong>and</strong> many<br />
fundamental<br />
aspects <strong>of</strong> that<br />
architecture are<br />
established<br />
well before<br />
a child<br />
enters<br />
school.”<br />
National Scientific Council<br />
on <strong>the</strong> Developing <strong>Child</strong>,<br />
p. 1.<br />
1
2 <strong>Georgia</strong> <strong>Study</strong> <strong>of</strong> <strong>Early</strong> <strong>Care</strong> <strong>and</strong> <strong>Education</strong>: <strong>Child</strong> <strong>Care</strong> Center Findings<br />
<strong>Study</strong> Description<br />
The primary purpose <strong>of</strong> this statewide study <strong>of</strong> child care <strong>and</strong> <strong>Georgia</strong>’s Pre-K Program<br />
was to ga<strong>the</strong>r data regarding <strong>the</strong> range <strong>of</strong> quality across <strong>Georgia</strong>. Generally, <strong>the</strong> study<br />
was designed to describe a) <strong>the</strong> quality <strong>of</strong> center-based care <strong>and</strong> <strong>Georgia</strong>’s Pre-K<br />
programs; <strong>and</strong> b) types <strong>of</strong> services provided to infants, toddlers, <strong>and</strong> preschoolers<br />
served by <strong>the</strong>se programs. This section describes <strong>the</strong> methods used for <strong>the</strong> entire<br />
study, but this report focuses solely on findings <strong>from</strong> child care centers.<br />
Program Selection<br />
The sample <strong>of</strong> programs that participated in <strong>the</strong> study was selected to address <strong>the</strong><br />
study’s primary purpose: estimating <strong>the</strong> quality <strong>of</strong> care provided across licensed<br />
centers <strong>and</strong> <strong>Georgia</strong>’s Pre-K programs. Data were collected in 173 programs. A sample<br />
size <strong>of</strong> 173 was determined to have an adequate balance <strong>of</strong> precision <strong>and</strong> feasibility,<br />
where <strong>the</strong> mean score on <strong>the</strong> main quality measures in <strong>the</strong> sample is within ± .12<br />
ECERS–R / ITERS–R points <strong>of</strong> <strong>the</strong> true population mean.<br />
To select <strong>the</strong> sample, DECAL provided a list <strong>of</strong> all licensed child care programs<br />
(including those that do <strong>and</strong> do not participate in <strong>Georgia</strong>’s Pre-K Program) <strong>and</strong><br />
school-based <strong>Georgia</strong>’s Pre-K programs. FPG r<strong>and</strong>omly selected programs to be<br />
recruited for participation in <strong>the</strong> study. A simple r<strong>and</strong>om selection process was used<br />
(i.e., no stratification), <strong>and</strong> programs were spread throughout <strong>the</strong> state.<br />
During recruitment, programs that declined or were determined to be ineligible were<br />
replaced by additional r<strong>and</strong>omly selected programs <strong>from</strong> that same list. To achieve<br />
<strong>the</strong> final sample <strong>of</strong> 173, we contacted 342 programs. Thirty-four were determined to<br />
be ineligible (e.g., no longer served children, no longer licensed), <strong>and</strong> 135 declined<br />
to participate. Thus, <strong>the</strong> overall response rate was 56% (173 participants / 173<br />
participants +135 declined). The response rate varied by program type, with 48% <strong>of</strong><br />
licensed centers agreeing to participate (112 out <strong>of</strong> 235) <strong>and</strong> 84% <strong>of</strong> schools with<br />
<strong>Georgia</strong>’s Pre-K agreeing to participate (61 out <strong>of</strong> 73). These response rates are similar<br />
to that <strong>of</strong> large scale studies <strong>of</strong> child care (52% in <strong>the</strong> Cost, Quality, <strong>and</strong> Outcomes<br />
<strong>Study</strong> 9 ) <strong>and</strong> pre-kindergarten (78% in <strong>the</strong> Multi-State <strong>Study</strong> <strong>of</strong> Pre-Kindergarten 10 ).<br />
Classroom Selection<br />
For each participating program, we r<strong>and</strong>omly selected one, two, or three classrooms<br />
to visit depending on <strong>the</strong> ages served <strong>and</strong> whe<strong>the</strong>r <strong>the</strong>y participated in <strong>Georgia</strong>’s Pre-<br />
K. If <strong>the</strong> program included infant/toddler classes (serving children less than 2½ years<br />
old), we r<strong>and</strong>omly selected one <strong>of</strong> those. If <strong>the</strong> program included classrooms serving<br />
preschoolers (ages 2½ to 5, not in kindergarten), we r<strong>and</strong>omly selected one <strong>of</strong> those.<br />
For <strong>the</strong> remainder <strong>of</strong> this report, “preschool” refers to classes that are not part <strong>of</strong><br />
<strong>Georgia</strong>’s Pre-K Program <strong>and</strong> serve children between 2½ years <strong>and</strong> 5 years who are<br />
not in kindergarten. If <strong>the</strong> program participated in <strong>Georgia</strong>’s Pre-K, we also r<strong>and</strong>omly
selected one <strong>Georgia</strong>’s Pre-K class. If a class was selected but <strong>the</strong> lead teacher was<br />
absent (n = 22) or did not want to participate (n = 3), a replacement class within <strong>the</strong><br />
same program <strong>of</strong> <strong>the</strong> same type was selected instead. Table 1 shows <strong>the</strong> number <strong>of</strong><br />
classrooms visited for each type <strong>of</strong> classroom configuration. In public schools, we did<br />
not visit any classrooms o<strong>the</strong>r than <strong>Georgia</strong>’s Pre-K classrooms. This report presents<br />
findings <strong>from</strong> <strong>the</strong> infant/toddler <strong>and</strong> preschool classrooms. Information about<br />
<strong>Georgia</strong>’s Pre-K classrooms is presented in a companion report, <strong>Georgia</strong> <strong>Study</strong> <strong>of</strong> <strong>Early</strong><br />
<strong>Care</strong> <strong>and</strong> <strong>Education</strong>: Findings <strong>from</strong> <strong>Georgia</strong>’s Pre-K Program.<br />
Measures<br />
Data were ga<strong>the</strong>red at <strong>the</strong> program <strong>and</strong> classroom levels using multiple methods:<br />
observations by independent data collectors, review <strong>of</strong> written documents, <strong>and</strong> selfreport<br />
<strong>of</strong> directors <strong>and</strong> teachers. Table 2 delineates <strong>the</strong> measures collected.<br />
Table 1. Classroom Visits by Program Types<br />
Program Type Programs<br />
Infant/<br />
Toddler<br />
Classes<br />
Number <strong>of</strong><br />
Preschool<br />
Classes<br />
GA<br />
Pre-K<br />
Classes<br />
Infant/Toddler & Preschool 49 49 49 0 98<br />
Infant/Toddler, Preschool, & <strong>Georgia</strong>’s Pre-K 48 48 48 48 144<br />
Preschool Only 10 0 10 0 10<br />
Preschool & <strong>Georgia</strong>’s Pre-K 2 0 2 2 4<br />
<strong>Georgia</strong>’s Pre-K Only 64 0 0 64 64<br />
TOTALS 173 97 109 114 320<br />
Table 2. Program <strong>and</strong> Classroom Measures<br />
Program Level<br />
•<br />
•<br />
•<br />
Director Interview<br />
Document Review<br />
Director <strong>Education</strong><br />
& Experience Form<br />
<strong>Georgia</strong> <strong>Study</strong> <strong>of</strong> <strong>Early</strong> <strong>Care</strong> <strong>and</strong> <strong>Education</strong>: <strong>Child</strong> <strong>Care</strong> Center Findings<br />
Infant/Toddler<br />
Classrooms<br />
• ITERS–R<br />
• Teacher <strong>Education</strong><br />
& Experience Form<br />
• Assistant Teacher<br />
<strong>Education</strong> &<br />
Experience Form<br />
• Infant/<br />
Toddler<br />
Observation<br />
Checklist<br />
Preschool<br />
Classrooms<br />
• ECERS–R<br />
• ELLCO<br />
• Teacher <strong>Education</strong><br />
& Experience Form<br />
• Assistant Teacher<br />
<strong>Education</strong> &<br />
Experience Form<br />
• Preschool<br />
Observation<br />
Checklist<br />
<strong>Georgia</strong>’s Pre-K<br />
Classrooms<br />
Total<br />
Classes<br />
• ECERS–R<br />
• ELLCO<br />
• CLASS<br />
• Snapshot<br />
• Teacher <strong>Education</strong><br />
& Experience Form<br />
• Assistant Teacher<br />
<strong>Education</strong> &<br />
Experience Form<br />
• Preschool<br />
Observation<br />
Checklist<br />
3
4 <strong>Georgia</strong> <strong>Study</strong> <strong>of</strong> <strong>Early</strong> <strong>Care</strong> <strong>and</strong> <strong>Education</strong>: <strong>Child</strong> <strong>Care</strong> Center Findings<br />
The Infant/Toddler Environment Rating Scale–Revised (ITERS–R) 11 is a widely used<br />
instrument for examining global classroom quality. It is specifically designed for use<br />
in classrooms serving children birth to 2½ years <strong>of</strong> age.<br />
The ITERS–R measures <strong>the</strong> following aspects <strong>of</strong> classroom quality: Space <strong>and</strong><br />
Furnishings (e.g., furnishings for relaxation <strong>and</strong> comfort, room arrangement, display);<br />
Personal <strong>Care</strong> Routines (e.g., greeting/departing, safety practices); Listening <strong>and</strong><br />
Talking (e.g., helping children underst<strong>and</strong> language, helping children use language);<br />
Activities (e.g., fine motor, art, promoting acceptance <strong>of</strong> diversity); Interaction (e.g.,<br />
supervision <strong>of</strong> play <strong>and</strong> learning, peer interactions); Program Structure (e.g., schedule,<br />
group play activities, provisions for children with disabilities); <strong>and</strong> Parents <strong>and</strong> Staff<br />
(e.g., provisions for personal needs <strong>of</strong> staff, supervision <strong>and</strong> evaluation <strong>of</strong> staff). In<br />
this study, we did not complete <strong>the</strong> “Parents <strong>and</strong> Staff” items on <strong>the</strong> ITERS–R.<br />
Scores on <strong>the</strong> ITERS–R can range <strong>from</strong> 1 to 7 with higher scores indicating higher<br />
quality. Total mean scores <strong>from</strong> 1 to 2.9 are considered “low” quality, scores <strong>from</strong> 3.0<br />
to 4.9 are considered “medium” quality, <strong>and</strong> scores <strong>of</strong> 5.0 or greater are considered<br />
“good” or “high” quality.<br />
The <strong>Early</strong> <strong>Child</strong>hood Environment Rating Scale–Revised (ECERS–R) 12 is a widely used<br />
measure <strong>of</strong> global classroom quality. It is specifically designed for use in classrooms<br />
serving children 2½ to 5 years <strong>of</strong> age.<br />
The ECERS–R measures <strong>the</strong> following aspects <strong>of</strong> classroom quality: Space <strong>and</strong><br />
Furnishings (e.g., furnishings for relaxation <strong>and</strong> comfort, room arrangement,<br />
display); Personal <strong>Care</strong> Routines (e.g., greeting/departing, safety practices); Language-<br />
Reasoning (e.g., presence/quality <strong>of</strong> books <strong>and</strong> pictures, encouraging children to<br />
communicate); Activities (e.g., fine motor, art, promoting acceptance <strong>of</strong> diversity);<br />
Interaction (e.g., supervision <strong>of</strong> children, interactions among children); Program<br />
Structure (e.g., schedule, group time, provisions for children with disabilities);<br />
<strong>and</strong> Parents <strong>and</strong> Staff (e.g., provisions for personal needs <strong>of</strong> staff, supervision <strong>and</strong><br />
evaluation <strong>of</strong> staff). In this study, we did not complete <strong>the</strong> “Parents <strong>and</strong> Staff” items<br />
on <strong>the</strong> ECERS–R.<br />
Scores on <strong>the</strong> ECERS–R can range <strong>from</strong> 1–7 with higher scores indicating higher<br />
quality. Total mean scores <strong>from</strong> 1 to 2.9 are considered “low” quality, scores <strong>from</strong> 3.0<br />
to 4.9 are considered “medium” quality, <strong>and</strong> scores <strong>of</strong> 5.0 or greater are considered<br />
“good” or “high” quality.<br />
The Language <strong>and</strong> Literacy Environment Scale <strong>of</strong> <strong>the</strong> <strong>Early</strong> Language <strong>and</strong> Literacy<br />
Classroom Observation: Pre-K (ELLCO) 13 is one subscale <strong>of</strong> an observational<br />
instrument for examining support for children’s language <strong>and</strong> literacy development.<br />
The ELLCO is designed for use in classrooms serving 3- to 5-year-old children. The<br />
Language <strong>and</strong> Literacy Environment scale is comprised <strong>of</strong> Language Environment<br />
(e.g., opportunities for extended conversations, vocabulary development); Books<br />
<strong>and</strong> Book Reading (e.g., organization <strong>of</strong> <strong>the</strong> book area, use <strong>of</strong> books across content
areas, quality <strong>and</strong> frequency <strong>of</strong> book reading); <strong>and</strong> Print <strong>and</strong> <strong>Early</strong> Writing (e.g.,<br />
opportunities that build awareness <strong>of</strong> print <strong>and</strong> purpose <strong>of</strong> writing, instructional<br />
strategies).<br />
Scores on <strong>the</strong> Language <strong>and</strong> Literacy scale <strong>of</strong> <strong>the</strong> ELLCO can range <strong>from</strong> 1 to 5, with 1<br />
indicating “deficient” practice, 2 indicating “inadequate” practice, 3 indicating “basic”<br />
practice, 4 indicating “strong” practice, <strong>and</strong> 5 indicating “exemplary” practice.<br />
The Classroom Assessment Scoring System (CLASS) 14 <strong>and</strong> <strong>the</strong> Emerging Academic<br />
Snapshot (Snapshot) 15 were conducted in <strong>Georgia</strong>’s Pre-K classrooms only. Descriptions<br />
<strong>of</strong> <strong>the</strong>se measures, along with study findings, are presented in a companion report,<br />
<strong>Georgia</strong> <strong>Study</strong> <strong>of</strong> <strong>Early</strong> <strong>Care</strong> <strong>and</strong> <strong>Education</strong>: Findings <strong>from</strong> <strong>Georgia</strong>’s Pre-K Program.<br />
Procedures<br />
<strong>Georgia</strong> <strong>Study</strong> <strong>of</strong> <strong>Early</strong> <strong>Care</strong> <strong>and</strong> <strong>Education</strong>: <strong>Child</strong> <strong>Care</strong> Center Findings<br />
A team <strong>of</strong> data collectors in <strong>Georgia</strong> was hired <strong>and</strong> supervised by FPG. One person<br />
was trained to reliability on <strong>the</strong> ITERS–R <strong>and</strong> was responsible for collecting data in<br />
<strong>the</strong> infant/toddler classrooms. Two people were trained to reliability on <strong>the</strong> ECERS–R<br />
<strong>and</strong> ELLCO. Data collectors were also trained to use <strong>the</strong> program-level measures.<br />
The reliability st<strong>and</strong>ard for <strong>the</strong> ECERS–R <strong>and</strong> ITERS–R was 80% agreement within 1<br />
point <strong>and</strong> a weighted kappa <strong>of</strong> .60 or greater with <strong>the</strong> trainer. The reliability st<strong>and</strong>ard<br />
for <strong>the</strong> ELLCO was 85% agreement within 1 point <strong>of</strong> <strong>the</strong> trainer. Supervision was<br />
provided at least weekly to all data collectors. Throughout data collection, two data<br />
collectors periodically collected data toge<strong>the</strong>r to ensure that interrater agreement<br />
was maintained. Follow-up training was provided when areas <strong>of</strong> disagreement were<br />
identified.<br />
Data were collected between September 2008 <strong>and</strong> May 2009. Data collection in<br />
preschool classes <strong>and</strong> in infant/toddler classes lasted one day, with <strong>the</strong> ECERS–R <strong>and</strong><br />
ELLCO completed in <strong>the</strong> preschool classrooms by <strong>the</strong> same individual during <strong>the</strong> same<br />
observation. The program-level measures were typically completed in <strong>the</strong> afternoon,<br />
after <strong>the</strong> classroom observations were complete. To <strong>the</strong> extent possible, data in<br />
different classrooms within <strong>the</strong> same center were collected during <strong>the</strong> same week.<br />
To maximize <strong>the</strong> inclusion <strong>of</strong> programs representing a range <strong>of</strong> quality, we <strong>of</strong>fered<br />
<strong>the</strong> program director <strong>and</strong> participating teachers incentives in <strong>the</strong> form <strong>of</strong> gift cards<br />
for educational materials ($100 gift card for <strong>the</strong> director; $25 gift card for each lead<br />
teacher; plus a raffle for one $250 gift card for programs with complete data).<br />
5
6 <strong>Georgia</strong> <strong>Study</strong> <strong>of</strong> <strong>Early</strong> <strong>Care</strong> <strong>and</strong> <strong>Education</strong>: <strong>Child</strong> <strong>Care</strong> Center Findings<br />
Findings<br />
This report focuses on <strong>the</strong> 112 centers in <strong>the</strong> study. Thirty-eight percent (38%) <strong>of</strong><br />
<strong>the</strong> centers were not-for-pr<strong>of</strong>it <strong>and</strong> 47% participated in <strong>Georgia</strong>’s Pre-K. Twelve<br />
percent (12%) <strong>of</strong> <strong>the</strong> centers reported receiving Head Start funds. Eleven <strong>of</strong> <strong>the</strong><br />
centers (10%) were accredited by <strong>the</strong> National Association for <strong>the</strong> <strong>Education</strong> <strong>of</strong> Young<br />
<strong>Child</strong>ren (NAEYC; five under <strong>the</strong> revised accreditation system that started in 2007<br />
<strong>and</strong> six under <strong>the</strong> system that was in place prior to 2007). Centers varied in size, with<br />
a mean total enrollment <strong>of</strong> 100 children <strong>of</strong> any age, infant through school-age in<br />
wrap around care (median a = 86, range = 19 to 281). The mean enrollment <strong>of</strong> children<br />
younger than kindergarten was 82 (median = 71, range =14 to 262) in centers. Fiftyeight<br />
percent (58%) <strong>of</strong> centers served children with disabilities. Seventy-four percent<br />
(74%) <strong>of</strong> centers in <strong>the</strong> study served children who received child care subsidies <strong>from</strong><br />
CAPS. In centers that served children receiving CAPS subsidies, <strong>the</strong> percentage <strong>of</strong><br />
subsidized children served varied <strong>from</strong> 1% to 99% <strong>of</strong> total enrollment (mean = 23%,<br />
median = 14%).<br />
Group Size <strong>and</strong> Ratios<br />
The total number <strong>of</strong> children in a classroom (i.e., group size) <strong>and</strong> <strong>the</strong> number <strong>of</strong><br />
children per adults (i.e., ratio) are important aspects <strong>of</strong> quality. It is easier for adults<br />
to meet <strong>the</strong> health <strong>and</strong> developmental needs <strong>of</strong> each child if <strong>the</strong>re are fewer children<br />
<strong>and</strong> more adults in a group. Small group size <strong>and</strong> low child-to-teacher ratios may be<br />
thought <strong>of</strong> as necessary, but not sufficient, for high quality care <strong>and</strong> education. Data<br />
collectors counted children <strong>and</strong> adults present in each classroom at four time points<br />
during each observation morning. Table 3 provides <strong>the</strong> observed mean group size<br />
<strong>and</strong> ratio (number <strong>of</strong> children present for each adult) by age <strong>of</strong> most children in <strong>the</strong><br />
classroom. These group sizes <strong>and</strong> ratios were at or below <strong>the</strong> maximum allowable by<br />
DECAL licensing requirements in almost all classes (99%).<br />
Teacher Turnover<br />
<strong>Child</strong>ren benefit <strong>from</strong> stable, positive relationships with <strong>the</strong>ir caregivers. Teacher<br />
turnover in programs can be stressful for children <strong>and</strong> may make it difficult to provide<br />
ongoing, high quality care <strong>and</strong> education. In this study, programs were asked to report<br />
<strong>the</strong> number <strong>of</strong> lead teachers <strong>and</strong> assistant teachers who left <strong>and</strong> had to be replaced in<br />
<strong>the</strong> past year. The mean turnover rate for lead teachers was 23% in centers. Forty-four<br />
percent (44%) <strong>of</strong> centers experienced a lead teacher turnover rate <strong>of</strong> less than 10%.<br />
The mean turnover rate for assistant teachers was 37% in centers. Thirty-nine percent<br />
(39%) <strong>of</strong> centers experienced an assistant teacher turnover rate <strong>of</strong> less than 10%.<br />
a Throughout this report, we present <strong>the</strong> median in addition to <strong>the</strong> mean <strong>and</strong> range when some<br />
<strong>of</strong> <strong>the</strong> values are very high.
Table 3. Group Size <strong>and</strong> Ratios (Number <strong>of</strong> <strong>Child</strong>ren per Adult) by Age <strong>of</strong> Most<br />
<strong>Child</strong>ren in Classroom<br />
Group Size<br />
Infants<br />
(less than 12 months)<br />
One-year-olds<br />
(12 to 23 months)<br />
Two-year-olds<br />
(24 to 35 months)<br />
Three-year-olds<br />
(36 to 47 months)<br />
Four & Five-year-olds<br />
(48 to 71 months, not in school)<br />
Ratios<br />
Infants<br />
(less than 12 months)<br />
One-year-olds<br />
(12 to 23 months)<br />
Two-year-olds<br />
(24 to 35 months)<br />
Three-year-olds<br />
(36 to 47 months)<br />
Four & Five-year-olds<br />
(48 to 71 months, not in school)<br />
<strong>Georgia</strong> <strong>Study</strong> <strong>of</strong> <strong>Early</strong> <strong>Care</strong> <strong>and</strong> <strong>Education</strong>: <strong>Child</strong> <strong>Care</strong> Center Findings<br />
Number<br />
<strong>of</strong> Classrooms<br />
Mean Range<br />
DECAL<br />
Allowable<br />
Maximum<br />
21 5.1 2.7 to 9.0 12<br />
48 7.4 2.8 to 17.3 16<br />
34 8.2 4.3 to 21.0 20<br />
65 11.0 3.8 to 24.0 30<br />
35 13.7 6.0 to 24.3 36–40<br />
21 3.6 2.1 to 6.5 6<br />
48 4.8 1.6 to 8.6 8<br />
34 5.2 2.4 to 10.3 10<br />
65 7.9 3.8 to 13.5 15<br />
35 8.5 5.4 to 13.8 18–20<br />
7
Classroom Quality<br />
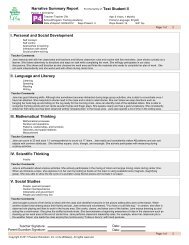
Figure 1. Quality <strong>of</strong> Infant/Toddler<br />
Classrooms in <strong>Child</strong> <strong>Care</strong> Centers<br />
(ITERS–R total mean = 2.74)<br />
Percentage <strong>of</strong> Classrooms<br />
8 <strong>Georgia</strong> <strong>Study</strong> <strong>of</strong> <strong>Early</strong> <strong>Care</strong> <strong>and</strong> <strong>Education</strong>: <strong>Child</strong> <strong>Care</strong> Center Findings<br />
100<br />
80<br />
60<br />
40<br />
20<br />
0<br />
28%<br />
1.0–1.9<br />
This section includes information about <strong>the</strong> observed quality <strong>of</strong> classrooms <strong>and</strong> is<br />
organized by <strong>the</strong> age <strong>of</strong> <strong>the</strong> children in <strong>the</strong> classroom: infant/toddler or preschool.<br />
Infant/Toddler Classroom Quality<br />
The Infant/Toddler Environment Rating Scale–Revised was used to measure <strong>the</strong> observed<br />
global quality <strong>of</strong> early care <strong>and</strong> education. Of <strong>the</strong> 97 ITERS–Rs conducted, 22% were<br />
in a class where most <strong>of</strong> <strong>the</strong> children were less than 12 months old; 51% were in a<br />
class where most children were 12 to 23 months old, <strong>and</strong> 27% were in a class where<br />
most children were 24 to 30 months old.<br />
In <strong>the</strong> current study, <strong>the</strong> mean ITERS–R total score in infant/toddler classrooms was<br />
2.74 (st<strong>and</strong>ard deviation or SD = 1.12, range = 1.27 to 5.97). As evident in Figure 1,<br />
67% <strong>of</strong> <strong>the</strong> infant-toddler classrooms were rated as low quality (i.e., ITERS–R scores<br />
< 3.0). Mean scores across <strong>the</strong> ITERS–R subscales were generally in <strong>the</strong> low quality<br />
range (see Table 4).<br />
Low High<br />
39%<br />
2.0–2.9<br />
15%<br />
3.0–3.9<br />
ITERS–R<br />
12%<br />
4.0–4.9<br />
5%<br />
5.0–5.9<br />
0%<br />
6.0–7.0<br />
Table 4. ITERS–R Subscale Scores in<br />
Infant/ Toddler Classrooms<br />
Subscale Mean Range<br />
Space <strong>and</strong> Furnishings 3.52 1.40 – 6.40<br />
Personal <strong>Care</strong> Routines 2.07 1.00 – 6.17<br />
Listening <strong>and</strong> Talking 2.77 1.00 – 7.00<br />
Activities 2.76 1.22 – 6.11<br />
Interaction 3.02 1.00 – 7.00<br />
Program Structure 2.30 1.00 – 7.00
Preschool Classroom Quality<br />
This study included two measures <strong>of</strong> classroom quality in all preschool classes: <strong>the</strong><br />
<strong>Early</strong> <strong>Child</strong>hood Environment Rating Scale–Revised <strong>and</strong> <strong>the</strong> <strong>Early</strong> Language <strong>and</strong> Literacy<br />
Classroom Observation: Pre-K.<br />
The <strong>Early</strong> <strong>Child</strong>hood Environment Rating Scale-Revised was used to measure <strong>the</strong> global<br />
quality <strong>of</strong> preschool classrooms. Of <strong>the</strong> 108 ECERS–Rs conducted in center-based<br />
preschool classrooms, 7% were in classes that served mostly 2-year-olds, 60% were in<br />
classes that served mostly 3-year-olds, 29% were in classes that served mostly 4-yearolds,<br />
<strong>and</strong> 4% were in classes that served mostly 5-year-olds, not yet in kindergarten.<br />
The mean ECERS–R total score in preschool classrooms was 3.39 (SD = 0.86, range = 1.86<br />
to 5.97). As evident in Figure 2, 60% <strong>of</strong> preschool classrooms were rated as having medium<br />
quality (i.e., ECERS–R scores between 3.0 <strong>and</strong> 4.99). With <strong>the</strong> exception <strong>of</strong> Personal <strong>Care</strong><br />
Routines, <strong>the</strong> ECERS–R mean subscale scores were consistently in <strong>the</strong> medium quality<br />
range (see Table 5).<br />
The Language <strong>and</strong> Literacy subscale <strong>of</strong> <strong>the</strong> <strong>Early</strong> Language <strong>and</strong> Literacy Classroom<br />
Observation: Pre-K was used to measure <strong>the</strong> early language <strong>and</strong> literacy environment <strong>of</strong><br />
preschool classrooms.<br />
The mean ELLCO Language <strong>and</strong> Literacy subscale score was 2.39, with a range <strong>from</strong> 1.17<br />
to 3.75. Eighty percent (80%) <strong>of</strong> <strong>the</strong> preschool classrooms were rated as having less than<br />
“basic” practice (i.e., scores < 3.0) supporting children’s language <strong>and</strong> literacy skills (see<br />
Figure 3).<br />
Figure 2. Quality <strong>of</strong> Preschool Classrooms<br />
in <strong>Child</strong> <strong>Care</strong> Centers<br />
(ECERS–R total mean = 3.39)<br />
Percentage <strong>of</strong> Classrooms<br />
100<br />
80<br />
60<br />
40<br />
20<br />
0<br />
2%<br />
1.0–1.9<br />
33%<br />
2.0–2.9<br />
<strong>Georgia</strong> <strong>Study</strong> <strong>of</strong> <strong>Early</strong> <strong>Care</strong> <strong>and</strong> <strong>Education</strong>: <strong>Child</strong> <strong>Care</strong> Center Findings<br />
Low Medium High<br />
40%<br />
3.0–3.9<br />
20%<br />
4.0–4.9<br />
ECERS–R<br />
5%<br />
5.0–5.9<br />
0%<br />
6.0–7.0<br />
Table 5. ECERS–R Subscale Scores<br />
in Preschool Classrooms<br />
Subscale Mean Range<br />
Space <strong>and</strong> Furnishings 3.92 2.25 – 6.38<br />
Personal <strong>Care</strong> Routines 2.32 1.17 – 5.67<br />
Language-Reasoning 3.73 1.50 – 7.00<br />
Activities 3.02 1.30 – 5.80<br />
Interaction 4.02 1.00 – 6.80<br />
Program Structure 3.78 1.00 – 6.67<br />
9
10 <strong>Georgia</strong> <strong>Study</strong> <strong>of</strong> <strong>Early</strong> <strong>Care</strong> <strong>and</strong> <strong>Education</strong>: <strong>Child</strong> <strong>Care</strong> Center Findings<br />
Figure 3. ELLCO Language <strong>and</strong> Literacy Environment<br />
in Preschool Classrooms (mean = 2.4)<br />
Percentage <strong>of</strong> Classrooms<br />
100<br />
80<br />
60<br />
40<br />
20<br />
0<br />
<strong>Education</strong> <strong>and</strong><br />
Pr<strong>of</strong>essional Development<br />
This section <strong>of</strong> <strong>the</strong> report provides information<br />
about <strong>the</strong> highest level <strong>of</strong> education, major, <strong>and</strong><br />
pr<strong>of</strong>essional development experiences for program<br />
directors, lead teachers, <strong>and</strong> assistant teachers.<br />
Directors<br />
30%<br />
1.0–1.9<br />
50%<br />
2.0–2.9<br />
ELLCO<br />
20%<br />
3.0–3.9<br />
• <strong>Education</strong>: Fifty-one percent (51%) <strong>of</strong> directors<br />
held at least a Bachelor’s degree (see Figure 4).<br />
No director had less than a High School diploma.<br />
0%<br />
4.0–5.0<br />
Figure 4. <strong>Education</strong> Level <strong>of</strong> Directors<br />
16% Master’s<br />
35% Bachelor’s<br />
5% High School<br />
28% Some College<br />
16% Associate’s<br />
Table 6. Highest Degree <strong>and</strong> Major for Center<br />
Directors<br />
Degree<br />
Associate’s degree with major in early childhood 7%<br />
Bachelor’s degree with major in early childhood 11%<br />
Graduate degree with major in early childhood 8%<br />
O<strong>the</strong>r education major, any degree 10%<br />
O<strong>the</strong>r non-education major, any degree 31%<br />
No Associate’s, Bachelor’s or Graduate degree 33%<br />
• Major: Twenty-six percent (26%) <strong>of</strong> center directors had a degree (Associate’s, Bachelor’s, or Master’s<br />
degree) in early childhood education (see Table 6).<br />
• Experience: On average, center directors reported 15 years <strong>of</strong> experience working in child care (median =<br />
14, range = 1 to 36).<br />
• Pr<strong>of</strong>essional Development Hours: Center directors reported participating in a mean <strong>of</strong> 26 hours <strong>of</strong> in-service<br />
training in <strong>the</strong> past year (median = 19, range = 0 to 145).<br />
• Pr<strong>of</strong>essional Development Content: The most common in-service training topics reported by center<br />
directors were health <strong>and</strong> safety practices; classroom management/discipline; <strong>and</strong> observing, assessing,<br />
<strong>and</strong> documenting children’s progress <strong>and</strong> development. Table 7 shows <strong>the</strong> frequency with which center<br />
directors reported participating in various pr<strong>of</strong>essional development topics.
Lead Teachers<br />
• <strong>Education</strong>: In infant/toddler classes, 33% <strong>of</strong><br />
lead teachers had a high school diploma or less,<br />
<strong>and</strong> 23% had an Associate’s degree or higher. In<br />
preschool classes, 22% <strong>of</strong> lead teachers had a high<br />
school diploma or less, <strong>and</strong> 33% <strong>of</strong> lead teachers<br />
had an Associate’s degree or higher (see Figure 5<br />
<strong>and</strong> Figure 6).<br />
• Major: Ten percent (10%) <strong>of</strong> infant/toddler lead<br />
teachers majored in early childhood education;<br />
16% <strong>of</strong> preschool teachers majored in early<br />
childhood education (see Table 8).<br />
• Experience: Lead teachers <strong>of</strong> infant/toddler<br />
classes reported a mean <strong>of</strong> 8 years <strong>of</strong> experience<br />
working in child care (median = 6, range = 0 to 35).<br />
Preschool teachers reported a mean <strong>of</strong> 10 years<br />
<strong>of</strong> experience working in child care (median = 8,<br />
range = 0 to 37).<br />
Nutrition education for employees 34%<br />
• Pr<strong>of</strong>essional Development Hours: Lead teachers<br />
Wellness education for employees 27%<br />
<strong>of</strong> infant/toddler classes reported participating<br />
in a mean <strong>of</strong> 15 hours <strong>of</strong> in-service training in <strong>the</strong> past year<br />
(median = 10, range = 0 to 134). Thirty-six percent (36%) <strong>of</strong> infant/<br />
toddler lead teachers reported participating in fewer than <strong>the</strong> 10 hours required<br />
Figure 5. <strong>Education</strong> Level <strong>of</strong><br />
Infant/Toddler Lead Teachers<br />
1% Master’s<br />
7% Bachelor’s<br />
14% Associate’s<br />
44% Some College<br />
<strong>Georgia</strong> <strong>Study</strong> <strong>of</strong> <strong>Early</strong> <strong>Care</strong> <strong>and</strong> <strong>Education</strong>: <strong>Child</strong> <strong>Care</strong> Center Findings<br />
7% Some High<br />
School<br />
26% High School<br />
Table 7. In-Service Training Topics<br />
for Center Directors in <strong>the</strong> Past Year<br />
About <strong>Child</strong>ren<br />
Health <strong>and</strong> safety practices 83%<br />
Classroom management/discipline 73%<br />
Observing, assessing, <strong>and</strong> documenting children’s<br />
progress <strong>and</strong> development<br />
Figure 6. <strong>Education</strong> Level <strong>of</strong><br />
Preschool Lead Teachers<br />
2% Master’s<br />
15% Bachelor’s<br />
17% Associate’s<br />
2% Some High<br />
School<br />
20% High School<br />
45% Some College<br />
73%<br />
Social-emotional development 71%<br />
<strong>Early</strong> language <strong>and</strong> literacy 63%<br />
Using a curriculum 59%<br />
Working with children with special needs 55%<br />
Physical activity 52%<br />
Working with children <strong>and</strong> families <strong>from</strong> different<br />
cultures <strong>and</strong> races<br />
44%<br />
<strong>Early</strong> science 40%<br />
<strong>Early</strong> math 37%<br />
Working with English Language Learners 19%<br />
About Adults<br />
Managing conflicts in a pr<strong>of</strong>essional manner 57%<br />
11
12 <strong>Georgia</strong> <strong>Study</strong> <strong>of</strong> <strong>Early</strong> <strong>Care</strong> <strong>and</strong> <strong>Education</strong>: <strong>Child</strong> <strong>Care</strong> Center Findings<br />
by <strong>the</strong> state, 28% reported participating in exactly 10 hours, <strong>and</strong> 36% reported<br />
participating in more than 10 hours.<br />
Lead teachers <strong>of</strong> preschool classes reported participating in a mean <strong>of</strong> 19 hours<br />
<strong>of</strong> in-service training in <strong>the</strong> past year (median = 11, range 0 to 400). Twenty-four<br />
percent (24%) <strong>of</strong> preschool lead teachers reported participating in fewer than <strong>the</strong><br />
10 hours required by <strong>the</strong> state, 26% reported participating in exactly 10 hours,<br />
<strong>and</strong> 50% reported participating in more than 10 hours.<br />
• Pr<strong>of</strong>essional Development Content: Lead teachers also reported <strong>the</strong> content <strong>of</strong><br />
in-service training in which <strong>the</strong>y participated during <strong>the</strong> past year. The most<br />
common topic among infant/toddler <strong>and</strong> preschool lead teachers was child health<br />
<strong>and</strong> safety. Table 9 shows <strong>the</strong> percentage <strong>of</strong> lead teachers who participated in<br />
in-service training about various topics during <strong>the</strong> past year.<br />
Assistant Teachers<br />
Most classes had at least one assistant teacher b (55% <strong>of</strong> infant/toddler classes, 62% <strong>of</strong><br />
preschool classes). A few classes had more than one assistant teacher (19% <strong>of</strong> infant<br />
toddler classes, 15% <strong>of</strong> preschool classes).<br />
• <strong>Education</strong>:<br />
In infant/toddler classes, 20% <strong>of</strong> assistant teachers had an Associate’s<br />
degree or higher. In preschool classes, 30% <strong>of</strong> assistant teachers had an Associate’s<br />
degree or higher (see Figure 7 <strong>and</strong> Figure 8).<br />
• Major: In both infant/toddler <strong>and</strong> preschool classrooms, less than 15% <strong>of</strong><br />
assistant teachers majored in early childhood education (see Table 10).<br />
• Experience: Assistant teachers <strong>of</strong> infant/toddler classes reported a mean <strong>of</strong> 8<br />
years <strong>of</strong> experience working in child care (median = 5, range = 0 to 50). Assistant<br />
teachers in preschool classes reported a mean <strong>of</strong> 7 years <strong>of</strong> experience working in<br />
child care (median = 6, range = 0 to 35).<br />
• Pr<strong>of</strong>essional Development Hours: Assistant teachers <strong>of</strong> infant/toddler classes<br />
reported participating in a mean <strong>of</strong> 17 hours <strong>of</strong> in-service training in <strong>the</strong> past<br />
year (median = 10, range = 0 to 180). Forty-two percent (42%) <strong>of</strong> infant/toddler<br />
assistant teachers reported participating in fewer than <strong>the</strong> 10 hours required<br />
by <strong>the</strong> state, 17% reported participating in exactly 10 hours, <strong>and</strong> 42% reported<br />
participating in more than 10 hours. Assistant teachers <strong>of</strong> preschool classes<br />
b For purposes <strong>of</strong> this report, we defined ‘assistant teacher’ as any paid adult o<strong>the</strong>r than <strong>the</strong><br />
lead teacher who was present in <strong>the</strong> classroom on <strong>the</strong> day that <strong>the</strong> observers visited. In cases<br />
where <strong>the</strong>re was more than one assistant in a classroom, <strong>the</strong> education, major, experience,<br />
<strong>and</strong> pr<strong>of</strong>essional development activities <strong>of</strong> <strong>the</strong> assistant who reported spending <strong>the</strong> most<br />
hours in <strong>the</strong> past week in that class are reported.
Table 8. Highest Degree <strong>and</strong> Major for<br />
Lead Teachers<br />
Associate’s degree with major in early<br />
childhood<br />
Bachelor’s degree with major in early<br />
childhood<br />
Graduate degree with major in early<br />
childhood<br />
8% Associate’s<br />
Figure 7. <strong>Education</strong> Level <strong>of</strong><br />
Infant/Toddler Assistant Teachers<br />
8% Bachelor’s<br />
4% Master’s<br />
40% Some College<br />
Infant/<br />
Toddler<br />
6% Some High<br />
School<br />
34% High School<br />
Preschool<br />
7% 11%<br />
2% 4%<br />
1% 1%<br />
O<strong>the</strong>r education major, any degree 2% 5%<br />
O<strong>the</strong>r non-education major, any degree 10% 13%<br />
No Associate’s, Bachelor’s, or Graduate<br />
degree<br />
<strong>Georgia</strong> <strong>Study</strong> <strong>of</strong> <strong>Early</strong> <strong>Care</strong> <strong>and</strong> <strong>Education</strong>: <strong>Child</strong> <strong>Care</strong> Center Findings<br />
77% 67%<br />
Table 9. In-Service Training Topics for<br />
Lead Teachers in <strong>the</strong> Past Year<br />
About <strong>Child</strong>ren<br />
Figure 8. <strong>Education</strong> Level <strong>of</strong><br />
Preschool Assistant Teachers<br />
3% Master’s<br />
3% Some High<br />
School<br />
18% Bachelor’s 21% High School<br />
9% Associate’s<br />
46% Some College<br />
Infant/<br />
Toddler<br />
Preschool<br />
Health <strong>and</strong> safety practices 82% 82%<br />
Classroom management/discipline 68% 68%<br />
Observing, assessing, <strong>and</strong> documenting<br />
children’s progress <strong>and</strong> development<br />
58% 53%<br />
Social-emotional development 65% 71%<br />
<strong>Early</strong> language <strong>and</strong> literacy 39% 52%<br />
Using a curriculum 54% 70%<br />
Working with children with special needs 35% 44%<br />
Physical activity 53% 50%<br />
Working with children <strong>and</strong> families <strong>from</strong><br />
different cultures <strong>and</strong> races<br />
45% 47%<br />
<strong>Early</strong> science 19% 37%<br />
<strong>Early</strong> math 19% 32%<br />
Working with English Language Learners 16% 24%<br />
About Adults<br />
Managing conflicts in a pr<strong>of</strong>essional<br />
manner<br />
39% 40%<br />
Nutrition education for employees 23% 37%<br />
Wellness education for employees 30% 29%<br />
13
14 <strong>Georgia</strong> <strong>Study</strong> <strong>of</strong> <strong>Early</strong> <strong>Care</strong> <strong>and</strong> <strong>Education</strong>: <strong>Child</strong> <strong>Care</strong> Center Findings<br />
Table 10. Highest Degree <strong>and</strong> Major for<br />
Assistant Teachers<br />
Associate’s degree with major in early<br />
childhood<br />
Bachelor’s degree with major in early<br />
childhood<br />
Graduate degree with major in early<br />
childhood<br />
Infant/<br />
Toddler<br />
Preschool<br />
6% 7%<br />
2% 4%<br />
2% 1%<br />
O<strong>the</strong>r education major, any degree 2% 4%<br />
O<strong>the</strong>r non-education major, any degree 8% 12%<br />
No Associate’s, Bachelor’s, or Graduate<br />
degree<br />
81% 70%<br />
Table 11. In-Service Training Topics for<br />
Assistant Teachers in <strong>the</strong> Past Year<br />
About <strong>Child</strong>ren<br />
Infant/<br />
Toddler<br />
Preschool<br />
Health <strong>and</strong> safety practices 77% 74%<br />
Classroom management/discipline 57% 62%<br />
Observing, assessing, <strong>and</strong> documenting<br />
children’s progress <strong>and</strong> development<br />
47% 57%<br />
Social-emotional development 57% 65%<br />
<strong>Early</strong> language <strong>and</strong> literacy 30% 50%<br />
Using a curriculum 53% 59%<br />
Working with children with special needs 34% 43%<br />
Physical activity 40% 57%<br />
Working with children <strong>and</strong> families <strong>from</strong><br />
different cultures <strong>and</strong> races<br />
36% 50%<br />
<strong>Early</strong> science 25% 32%<br />
<strong>Early</strong> math 23% 32%<br />
Working with English Language Learners 19% 31%<br />
About Adults<br />
Managing conflicts in a pr<strong>of</strong>essional<br />
manner<br />
30% 49%<br />
Nutrition education for employees 30% 35%<br />
Wellness education for employees 23% 34%<br />
reported participating in a mean <strong>of</strong> 22 hours <strong>of</strong> in-service training in <strong>the</strong> past year<br />
(median = 10, range = 0 to 180). Twenty-six percent (26%) <strong>of</strong> preschool assistant<br />
teachers reported participating in fewer than <strong>the</strong> 10 hours required by <strong>the</strong> state,<br />
26% reported participating in exactly 10 hours, <strong>and</strong> 47% reported participating in<br />
more than 10 hours.<br />
• Pr<strong>of</strong>essional Development Content: The most common in-service training topic<br />
reported among assistant teachers in infant/toddler <strong>and</strong> preschool classrooms was<br />
health <strong>and</strong> safety practices. Table 11 shows <strong>the</strong> percentage <strong>of</strong> assistant teachers<br />
who participated in in-service training around various topics during <strong>the</strong> past year.
Program Characteristics <strong>and</strong> Services<br />
This section <strong>of</strong> <strong>the</strong> report includes information about program-level characteristics, such<br />
as <strong>the</strong> use <strong>of</strong> curricula <strong>and</strong> family support activities.<br />
Curricula <strong>and</strong> <strong>Child</strong> Assessments<br />
Most directors reported that a curriculum was used in<br />
<strong>the</strong>ir program. According to directors, 74% <strong>of</strong> infant<br />
classes, 89% <strong>of</strong> toddler classes, <strong>and</strong> 94% <strong>of</strong> preschool<br />
classes used a curriculum. The most commonly<br />
reported curricula in infant, toddler, <strong>and</strong> preschool<br />
classes were Creative Curriculum, HighReach Learning,<br />
Pinnacle, <strong>and</strong> High/Scope (see Table 12).<br />
Overall, 89% <strong>of</strong> center directors reported that <strong>the</strong>ir<br />
program used some kind <strong>of</strong> assessment <strong>of</strong> young<br />
children to help teachers plan for or adapt <strong>the</strong>ir<br />
teaching. According to directors, 43% <strong>of</strong> infant<br />
classes, 60% <strong>of</strong> toddler classes, 77% <strong>of</strong> preschool<br />
classes used assessment to help guide instruction. The<br />
most commonly used assessments for this purpose<br />
in centers were a written record or informal notes <strong>of</strong><br />
teacher observations, <strong>Georgia</strong>’s Pre-K Assessment,<br />
<strong>and</strong> <strong>the</strong> Creative Curriculum Development Continuum<br />
Assessment.<br />
Thirty-nine percent (39%) <strong>of</strong> center directors reported<br />
having written documentation <strong>of</strong> individual children’s<br />
progress/learning for all children.<br />
Screenings<br />
<strong>Georgia</strong> <strong>Study</strong> <strong>of</strong> <strong>Early</strong> <strong>Care</strong> <strong>and</strong> <strong>Education</strong>: <strong>Child</strong> <strong>Care</strong> Center Findings<br />
Table 12. Reported Curricula Use by Age Group<br />
Some programs have children’s vision, hearing, teeth,<br />
or general development checked or screened. The<br />
program can do this or work with someone <strong>from</strong> <strong>the</strong><br />
health department or o<strong>the</strong>r community group to come<br />
Learning/Development 35%<br />
to <strong>the</strong> center to do <strong>the</strong> screenings. Table 13 shows <strong>the</strong> percentage <strong>of</strong> programs that<br />
reported providing <strong>the</strong>se services.<br />
Among <strong>the</strong> 35% <strong>of</strong> centers that conducted learning/development screenings, nearly<br />
half (46%) reported using Ages & Stages Questionnaire. Of <strong>the</strong> centers that reported<br />
conducting learning/development screenings, 46% conducted <strong>the</strong> screenings in <strong>the</strong> first<br />
3 months <strong>of</strong> enrollment, 3% screened children within 6 months <strong>of</strong> enrollment, <strong>and</strong> 51%<br />
screened children as needed.<br />
Infants Toddlers<br />
Preschool<br />
Creative Curriculum 33% 34% 35%<br />
HighReach Learning 11% 18% 17%<br />
High/Scope 7% 7% 15%<br />
A Beka 2% 7% 10%<br />
Pinnacle 11% 12% 9%<br />
Montessori 2% 5% 6%<br />
Scholastic 1% 1% 2%<br />
Blueprint 0% 0% 1%<br />
OWL 0% 0% 0%<br />
Bank Street 0% 0% 0%<br />
O<strong>the</strong>r 18% 23% 25%<br />
None 26% 11% 6%<br />
Table 13. Screenings Conducted in Centers<br />
Percentage<br />
<strong>of</strong> Centers<br />
Vision 35%<br />
Hearing 33%<br />
Dental 29%<br />
15
16 <strong>Georgia</strong> <strong>Study</strong> <strong>of</strong> <strong>Early</strong> <strong>Care</strong> <strong>and</strong> <strong>Education</strong>: <strong>Child</strong> <strong>Care</strong> Center Findings<br />
Involving Families<br />
In order to learn about <strong>the</strong> role families play in programs, directors were asked about<br />
ways families participate; supports, information <strong>and</strong> services programs provide to<br />
families; <strong>and</strong> ways programs <strong>and</strong> families communicate.<br />
• Family Participation: More than 75% <strong>of</strong> program directors reported that <strong>the</strong>y<br />
<strong>of</strong>fered families an opportunity to read to children in classrooms, participate in<br />
program activities for <strong>the</strong> whole family, or share a family or cultural tradition with<br />
children. Fewer programs (36%) reported <strong>of</strong>fering parents an opportunity to serve<br />
as a member <strong>of</strong> an advisory board.<br />
• Information Provided to Families: More than 75% <strong>of</strong> directors reported that in<br />
<strong>the</strong> past year <strong>the</strong>y provided families with information about <strong>the</strong> following topics<br />
related to <strong>the</strong>ir children’s development <strong>and</strong> health: early literacy; overall child<br />
development; general safety issues; parenting, managing challenging behaviors or<br />
positive guidance strategies; nutrition; general health <strong>and</strong> well-being <strong>of</strong> children;<br />
<strong>and</strong> dental health. Directors were less likely to provide families information about<br />
health insurance: 51% <strong>of</strong> center directors reported providing information about<br />
Peach<strong>Care</strong> for Kids, 35% provided information about Medicaid, <strong>and</strong> 26% provided<br />
information about o<strong>the</strong>r health coverage.<br />
• Services <strong>and</strong> Supports Provided to Families: Seventy percent (70%) or more <strong>of</strong> <strong>the</strong><br />
center directors reported that <strong>the</strong>y provided <strong>the</strong> following services to <strong>the</strong> families<br />
<strong>the</strong>y serve: help families find community activities, help families find needed social<br />
services, provide a lending library for families, <strong>and</strong> send home reading activity<br />
packs.<br />
• Communicating with Families: Communication among teachers, programs, <strong>and</strong><br />
families is a key to successful, high-quality experiences for children. Most center<br />
directors reported using various ways <strong>of</strong> communicating with families, including<br />
phone calls (96%), program-wide communications such as newsletters (84%),<br />
<strong>and</strong> parent conferences (69%). Of centers that <strong>of</strong>fered parent conferences, 79%<br />
reported scheduling conferences two or more times per year; 12% scheduled <strong>the</strong>m<br />
annually; <strong>and</strong> 9% reported that <strong>the</strong>y do not schedule conferences regularly.
<strong>Study</strong> Limitations<br />
<strong>Georgia</strong> <strong>Study</strong> <strong>of</strong> <strong>Early</strong> <strong>Care</strong> <strong>and</strong> <strong>Education</strong>: <strong>Child</strong> <strong>Care</strong> Center Findings<br />
These data provide rich information with regard to <strong>the</strong> early care <strong>and</strong> education<br />
system in <strong>Georgia</strong>. Information was obtained <strong>from</strong> many different individuals (i.e.,<br />
administrators, teachers, assistant teachers) using multiple methods (i.e., observations,<br />
interview, questionnaire, review <strong>of</strong> documents).<br />
The information in this study, however, is not perfect. For instance, some data are<br />
<strong>from</strong> teachers’ answers to written surveys where sometimes questions are misread or<br />
misunderstood. Likewise, some administrators may not be aware <strong>of</strong> how programs<br />
are funded or managed, possibly leading to some mistakes when reporting on issues<br />
such as pr<strong>of</strong>it versus not-for-pr<strong>of</strong>it or Head Start participation. All data collectors<br />
were trained to a high level <strong>of</strong> reliability on <strong>the</strong> classroom observation measures.<br />
None<strong>the</strong>less, observational measures always contain a certain amount <strong>of</strong> observer<br />
error. Fur<strong>the</strong>r, <strong>the</strong>re is high probability that higher quality programs were more likely<br />
to participate than lower quality. Thus, <strong>the</strong> findings may be somewhat higher/better<br />
than that found in <strong>the</strong> general population. Readers should keep <strong>the</strong>se study limitations<br />
in mind when interpreting <strong>the</strong> findings. Even with <strong>the</strong>se cautions, though, we believe<br />
<strong>the</strong> study provides important information about <strong>the</strong> quality <strong>of</strong> early care <strong>and</strong> education<br />
<strong>and</strong> services in licensed child care centers throughout <strong>the</strong> state <strong>of</strong> <strong>Georgia</strong>.<br />
17
18 <strong>Georgia</strong> <strong>Study</strong> <strong>of</strong> <strong>Early</strong> <strong>Care</strong> <strong>and</strong> <strong>Education</strong>: <strong>Child</strong> <strong>Care</strong> Center Findings<br />
Conclusions <strong>and</strong> Recommendations<br />
This report focuses on <strong>the</strong> findings <strong>from</strong> <strong>the</strong> sample <strong>of</strong> child care centers included in<br />
<strong>the</strong> statewide study. A companion report, <strong>Georgia</strong> <strong>Study</strong> <strong>of</strong> <strong>Early</strong> <strong>Care</strong> <strong>and</strong> <strong>Education</strong>:<br />
Findings <strong>from</strong> <strong>Georgia</strong>’s Pre-K Program, describes <strong>the</strong> quality <strong>of</strong> <strong>Georgia</strong>’s Pre-K programs<br />
(in both centers <strong>and</strong> schools). Please read both reports to underst<strong>and</strong> <strong>the</strong> quality <strong>of</strong><br />
care in child care centers <strong>and</strong> <strong>Georgia</strong>’s Pre-K programs serving young children in<br />
<strong>Georgia</strong>.<br />
Findings <strong>from</strong> this study suggest that administrators <strong>and</strong> teachers in licensed<br />
child care centers are working hard to serve young children <strong>and</strong> <strong>the</strong>ir families.<br />
Almost all <strong>of</strong> <strong>the</strong> programs met or exceeded <strong>the</strong> basic state licensing requirements for<br />
group size <strong>and</strong> ratio <strong>of</strong> children per adult. About one-third <strong>of</strong> infant/toddler teachers<br />
<strong>and</strong> one-half <strong>of</strong> preschool teachers participated in more than <strong>the</strong> required hours <strong>of</strong><br />
pr<strong>of</strong>essional development in <strong>the</strong> past year. Most program administrators reported<br />
using a curriculum in <strong>the</strong>ir program. Most also reported providing a range <strong>of</strong> services<br />
<strong>and</strong> supports to <strong>the</strong> families <strong>the</strong>y serve.<br />
The findings <strong>of</strong> this study underscore <strong>the</strong> need for improving <strong>the</strong> quality <strong>of</strong><br />
center-based care for children across <strong>Georgia</strong>. The data <strong>from</strong> this study suggest<br />
that very few young children receive <strong>the</strong> care that is generally considered “high” quality.<br />
Specifically, only 5% <strong>of</strong> infant/toddler classrooms <strong>and</strong> 5% <strong>of</strong> preschool classrooms were<br />
rated as high quality (i.e., ITERS–R or ECERS–R mean total score ≥ 5). If <strong>Georgia</strong> wants<br />
to support young children’s development <strong>and</strong> success in school, many more child care<br />
classrooms need to provide high quality care.<br />
Of equal, if not greater concern, is <strong>the</strong> percentage <strong>of</strong> classrooms rated as having “low”<br />
quality <strong>of</strong> care. Thirty-five percent (35%) <strong>of</strong> preschool classrooms <strong>and</strong> 67% <strong>of</strong> infant/<br />
toddler classrooms were rated as having low quality (i.e., ITERS–R or ECERS–R mean<br />
total score < 3). <strong>Child</strong>ren in <strong>the</strong>se classrooms likely experience environments that are<br />
inadequate for <strong>the</strong>ir health <strong>and</strong> safety <strong>and</strong> do not promote <strong>the</strong>ir cognitive <strong>and</strong> social<br />
emotional development. Although every classroom is unique, looking at <strong>the</strong> subscale<br />
scores suggests that <strong>the</strong>se low quality classrooms are generally characterized by all <strong>of</strong><br />
<strong>the</strong> following: children likely have few toys that are appropriate for <strong>the</strong>ir age, teachers’<br />
expectations about children’s behavior are likely inappropriate (e.g., expect children<br />
to sit still for long periods <strong>of</strong> time), teachers’ language is likely to be used to control<br />
children’s behavior (e.g., “stop” “come here”) ra<strong>the</strong>r than for learning (e.g., “Do you<br />
want <strong>the</strong> green or blue ball?”), multiple safety hazards exist (e.g., unprotected electrical<br />
outlets, staples on <strong>the</strong> floor, outdoor surfaces not cushioned to protect against<br />
possible falls), <strong>and</strong> adults <strong>and</strong> children do not follow recommended health practices<br />
(e.g., washing h<strong>and</strong>s thoroughly to prevent <strong>the</strong> spread <strong>of</strong> germs).
<strong>Georgia</strong> <strong>Study</strong> <strong>of</strong> <strong>Early</strong> <strong>Care</strong> <strong>and</strong> <strong>Education</strong>: <strong>Child</strong> <strong>Care</strong> Center Findings<br />
Similar findings <strong>of</strong> low quality were evident in <strong>the</strong> more specific measure <strong>of</strong> quality<br />
related to children’s language <strong>and</strong> literacy. The data <strong>from</strong> <strong>the</strong> ELLCO suggest that<br />
most preschool children are not in environments that support <strong>the</strong>ir language/literacy<br />
skills. None <strong>of</strong> <strong>the</strong> preschool classrooms in child care centers were in <strong>the</strong> “strong”<br />
or “exemplary” categories on <strong>the</strong> ELLCO Language <strong>and</strong> Literacy Environment.<br />
Eighty percent <strong>of</strong> preschool classrooms were, in fact, rated as having “deficient” or<br />
“inadequate” language <strong>and</strong> literacy practices.<br />
Additional efforts are needed to improve <strong>the</strong> quality <strong>of</strong> infant/toddler centerbased<br />
care in <strong>Georgia</strong>. The fact that two-thirds <strong>of</strong> infant/toddler classrooms in <strong>the</strong><br />
study were rated as low quality is particularly troubling. With research documenting<br />
<strong>the</strong> importance <strong>of</strong> early brain development, 16 it seems especially important to<br />
streng<strong>the</strong>n <strong>the</strong> quality <strong>of</strong> center-based care for infants <strong>and</strong> toddlers in <strong>Georgia</strong>.<br />
Continued education <strong>and</strong> pr<strong>of</strong>essional development are important strategies<br />
for improving <strong>the</strong> quality <strong>of</strong> care for <strong>Georgia</strong>’s children in child care centers.<br />
The variability among teacher education levels will require careful planning <strong>of</strong> <strong>the</strong><br />
specific in-service pr<strong>of</strong>essional development efforts <strong>and</strong> supports that best match<br />
a teacher’s needs for streng<strong>the</strong>ning her teaching practices. Extra supports may be<br />
needed to meet <strong>the</strong> needs <strong>of</strong> <strong>the</strong> sizable portion <strong>of</strong> teachers without degrees beyond<br />
high school. Of lead teachers, 77% in infant/toddler classrooms <strong>and</strong> 67% in preschool<br />
classrooms did not have an Associate’s, Bachelor’s, or Graduate degree. Of assistant<br />
teachers, 81% in infant/toddler classrooms <strong>and</strong> 70% in preschool classrooms did not<br />
have an Associate’s, Bachelor’s, or Graduate degree. With so many classrooms in <strong>the</strong><br />
low quality range, special supports also may be needed to first emphasize basic health<br />
<strong>and</strong> safety issues <strong>of</strong> caring for young children as well as a general underst<strong>and</strong>ing <strong>of</strong><br />
appropriate expectations for young children.<br />
The amount <strong>and</strong> quality <strong>of</strong> pr<strong>of</strong>essional development may also need to be improved.<br />
For example, although most directors (63%) <strong>and</strong> preschool teachers (52%) reported<br />
receiving in-service training related to language <strong>and</strong> literacy in <strong>the</strong> past year, <strong>the</strong><br />
data suggest that <strong>the</strong> in-service training has not yet translated into literacy-rich<br />
classroom environments <strong>and</strong> teaching practices. It is likely that more or different<br />
pr<strong>of</strong>essional development <strong>and</strong> supports are needed to ensure that children have <strong>the</strong><br />
materials, activities, <strong>and</strong> experiences necessary to support <strong>the</strong>ir language <strong>and</strong> literacy<br />
development. As ano<strong>the</strong>r example, many teachers reported participating in more than<br />
<strong>the</strong> required annual in-service training hours, <strong>and</strong> yet quality <strong>of</strong> care was still in <strong>the</strong><br />
low to medium range. It may be useful for DECAL to examine <strong>the</strong> existing training <strong>and</strong><br />
technical assistance supports <strong>of</strong>fered to child care center teachers <strong>and</strong> make revisions,<br />
moving toward building a system <strong>of</strong> pr<strong>of</strong>essional development that is aligned with <strong>the</strong><br />
state’s early learning st<strong>and</strong>ards <strong>and</strong> goals for quality improvement <strong>and</strong> is guided by<br />
research on effective training <strong>and</strong> technical assistance. 17, 18, 19<br />
19
20 <strong>Georgia</strong> <strong>Study</strong> <strong>of</strong> <strong>Early</strong> <strong>Care</strong> <strong>and</strong> <strong>Education</strong>: <strong>Child</strong> <strong>Care</strong> Center Findings<br />
The quality <strong>of</strong> center-based care<br />
in <strong>Georgia</strong> is lower than that in<br />
some o<strong>the</strong>r states. Figure 9 provides<br />
ITERS–R <strong>and</strong> ECERS–R data <strong>from</strong> three<br />
o<strong>the</strong>r states: Kentucky, Tennessee, <strong>and</strong><br />
Rhode Isl<strong>and</strong>. c The states included for<br />
comparison were chosen carefully. Many<br />
studies <strong>of</strong> child care rely on samples<br />
<strong>of</strong> convenience or <strong>of</strong> a specific subpopulation<br />
(e.g., those applying for a high<br />
level on a state’s rated licensure). Such<br />
samples do not reflect <strong>the</strong> broader early<br />
care <strong>and</strong> education system. Tennessee<br />
data are <strong>from</strong> <strong>the</strong> entire population<br />
<strong>of</strong> licensed centers (<strong>and</strong> <strong>the</strong>refore<br />
representative <strong>of</strong> <strong>the</strong> child care system).<br />
The data <strong>from</strong> Kentucky <strong>and</strong> Rhode Isl<strong>and</strong><br />
were obtained <strong>from</strong> r<strong>and</strong>omly selected<br />
programs across those states (<strong>the</strong>ir<br />
sample sizes were smaller than <strong>the</strong> sample<br />
size in <strong>the</strong> current study). Although no<br />
state is exactly like any o<strong>the</strong>r state in<br />
terms <strong>of</strong> <strong>the</strong>ir investments in child care<br />
quality, child population, or political<br />
context, <strong>the</strong>se o<strong>the</strong>r state scores help<br />
place <strong>the</strong> <strong>Georgia</strong> findings in a broader<br />
context.<br />
Data <strong>from</strong> North Carolina <strong>and</strong> Tennessee<br />
document that improvements in quality<br />
are possible with investments over time.<br />
When Smart Start first began in North<br />
Carolina in 1994, a study <strong>of</strong> 180 preschool<br />
classrooms across <strong>the</strong> state found that only 13% were <strong>of</strong> high quality. Five years later, 29% <strong>of</strong> 133 preschool<br />
classrooms visited were rated as high quality. 23 When Tennessee first began its Report Card <strong>and</strong> Star Quality<br />
Program, 31% <strong>of</strong> centers were rated as high quality. Seven years later, 46% <strong>of</strong> centers were rated as high<br />
quality. 24 These documented changes in quality demonstrate <strong>the</strong> improvements possible when investments are<br />
made to streng<strong>the</strong>n <strong>the</strong> quality <strong>of</strong> care.<br />
c Figure 9 presents mean ITERS–R <strong>and</strong> ECERS–R data. It is important to note that <strong>the</strong>re is variability in quality within<br />
each state.<br />
Figure 9. Cross-State Comparisons <strong>of</strong> Center-Based<br />
Quality: Mean ECERS–R <strong>and</strong> ITERS–R Scores<br />
5<br />
4.5<br />
4<br />
3.5<br />
3<br />
2.5<br />
2<br />
1.5<br />
1<br />
ITERS–R<br />
ECERS–R<br />
GA KY TN RI<br />
States<br />
Kentucky: These data were collected in 2007–08<br />
<strong>from</strong> 39 infant/toddler classrooms <strong>and</strong> 61 preschool<br />
classrooms in a sample <strong>of</strong> 99 r<strong>and</strong>omly selected<br />
licensed centers. 20<br />
Tennessee: These data were collected in 2007–08 as<br />
part <strong>of</strong> <strong>the</strong> TN STARS program <strong>from</strong> all licensed child<br />
care centers (1,315 infant/toddler classrooms <strong>and</strong><br />
1,972 preschool classrooms). 21<br />
Rhode Isl<strong>and</strong>: These data were collected in 2008–09<br />
<strong>from</strong> 50 r<strong>and</strong>omly selected infant/toddler classrooms<br />
<strong>and</strong> 50 r<strong>and</strong>omly selected preschool classrooms. 22
<strong>Georgia</strong> <strong>Study</strong> <strong>of</strong> <strong>Early</strong> <strong>Care</strong> <strong>and</strong> <strong>Education</strong>: <strong>Child</strong> <strong>Care</strong> Center Findings<br />
In closing, <strong>Bright</strong> <strong>from</strong> <strong>the</strong> Start: <strong>the</strong> Department <strong>of</strong> <strong>Early</strong> <strong>Care</strong> <strong>and</strong> Learning<br />
should be commended for conducting a statewide representative study <strong>of</strong> child<br />
care <strong>and</strong> <strong>Georgia</strong>’s Pre-K. This study provides objective information about <strong>the</strong> range<br />
<strong>of</strong> quality in centers <strong>and</strong> pre-k programs across <strong>the</strong> state. We hope that <strong>the</strong>se study<br />
findings will inform policymakers as <strong>the</strong>y develop strategies <strong>and</strong> make decisions about<br />
investments to maximize <strong>the</strong> quality <strong>of</strong> care for <strong>Georgia</strong>’s young children. Multiple<br />
strategies will likely be needed to improve <strong>the</strong> quality <strong>of</strong> center-based care, such as<br />
continued education, training <strong>and</strong> technical assistance for teachers <strong>and</strong> administrators;<br />
licensing revisions; teacher compensation initiatives; <strong>and</strong> program incentives for<br />
quality improvement. 25 Finally, we hope that <strong>the</strong>se findings will provide important<br />
baseline data <strong>from</strong> which to measure <strong>Georgia</strong>’s future investments in improving <strong>the</strong><br />
quality <strong>of</strong> care for young children.<br />
21
22 <strong>Georgia</strong> <strong>Study</strong> <strong>of</strong> <strong>Early</strong> <strong>Care</strong> <strong>and</strong> <strong>Education</strong>: <strong>Child</strong> <strong>Care</strong> Center Findings<br />
References<br />
1. National Center for <strong>Education</strong> Statistics, National Households <strong>Education</strong> Survey<br />
Program, U.S. Department <strong>of</strong> <strong>Education</strong> NCES 2006-078, 2001-05 electronic<br />
codebook <strong>and</strong> public use data files.<br />
2. Burchinal, M., Kainz, K., Cai, K., Tout, K., Zaslow, M., Martinez-Beck, I., et al.<br />
(2009). <strong>Early</strong> care <strong>and</strong> education quality <strong>and</strong> child outcomes. Washington, DC: Office<br />
<strong>of</strong> Planning, Research, <strong>and</strong> Evaluation.<br />
3. National Institute <strong>of</strong> <strong>Child</strong> Health <strong>and</strong> Human Development <strong>Early</strong> <strong>Child</strong> <strong>Care</strong><br />
Research Network (2000). The relation <strong>of</strong> child care to cognitive <strong>and</strong> language<br />
development. <strong>Child</strong> Development, 71(4), 960-980.<br />
4. Peisner-Feinberg, E., & Burchinal, M. R. (1997). Relations between preschool<br />
children’s child-care experiences <strong>and</strong> concurrent development: The cost, quality,<br />
<strong>and</strong> outcomes study. Merrill-Palmer Quarterly, 43. (3), 451-477.<br />
5. Peisner-Feinberg, E., Burchinal, M. R., Clifford, R. M., Culkin, M. L., Howes, C.,<br />
Kagan, S. L., et al. (2001). The relation <strong>of</strong> preschool child-care quality to children’s<br />
cognitive <strong>and</strong> social developmental trajectories through second grade, <strong>Child</strong><br />
Development, 72. (5), 1534-1553.<br />
6. National Research Council <strong>and</strong> Institute <strong>of</strong> Medicine (2000). From neurons to<br />
neighborhoods: The science <strong>of</strong> early childhood development. Washington, DC: National<br />
Academy Press.<br />
7. National Scientific Council on <strong>the</strong> Developing <strong>Child</strong> (2007). The timing <strong>and</strong> quality<br />
<strong>of</strong> early experiences combine to shape brain architecture: Working paper #5. Retrieved<br />
November 2, 2009 <strong>from</strong> http://www.developingchild.harvard.edu<br />
8. Maxwell, K. L., & Kraus, S. (2008). Quality early care <strong>and</strong> education: <strong>Georgia</strong>’s quality<br />
system indicators. Feasibility report. Chapel Hill: The University <strong>of</strong> North Carolina,<br />
FPG <strong>Child</strong> Development Institute.<br />
9. See reference 4.<br />
10. Clifford, R. M., Barbarin, O., Chang, F., <strong>Early</strong>, D. M., Bryant, D., Howes, C., et al.<br />
(2005). What is pre-kindergarten? Characteristics <strong>of</strong> public pre-kindergarten<br />
programs. Applied Developmental Science, 9. (3), 126-143.<br />
11. Harms, T., Cryer, D., & Clifford, R. M. (2006). Infant/toddler environment rating<br />
scale: Revised edition. New York: Teachers College Press.<br />
12. Harms, T., Clifford, R. M., & Cryer, D. (2005). <strong>Early</strong> childhood environment rating<br />
scale: Revised edition. New York: Teachers College Press.<br />
13. Smith, M. W., Brady, J. P., & Anastasopoulos, L. (2008). <strong>Early</strong> language & literacy<br />
classroom observation (ELLCO): Pre-k tool. Baltimore, MD: Paul H. Brookes.<br />
14. Pianta, R. C., La Paro, K. M., & Hamre, B. (2008). Classroom assessment scoring<br />
system (CLASS): Pre-k version. Baltimore: Paul H. Brookes.
15. Modified <strong>from</strong> Ritchie, S., Howes, C., Kraft-Sayre, M., & Weiser, B. (2008).<br />
Emerging academic snapshot. Unpublished.<br />
16. See reference 7.<br />
17. Desimone, L.M. (2009). Improving impact studies <strong>of</strong> teachers’ pr<strong>of</strong>essional<br />
development: Toward better conceptualizations <strong>and</strong> measures. <strong>Education</strong>al<br />
Researcher, 38(3), 181-199.<br />
18. Fixsen, D.L., Naoom, S.F., Blase, K.A., Friedman, R.M., & Wallace, F. (2005).<br />
Implementation research: A syn<strong>the</strong>sis <strong>of</strong> <strong>the</strong> literature (FMHI Publication #231).<br />
Tampa, FL: University <strong>of</strong> South Florida, Louis de la Parte Florida Mental Health<br />
Institute, The National Implementation Research Network. Retrieved November<br />
2, 2009 <strong>from</strong> http://www.fpg.unc.edu/~nirn/resources/publications/Monograph/<br />
pdf/Monograph_full.pdf<br />
19. Winton, P. (in press). Pr<strong>of</strong>essional development <strong>and</strong> quality initiatives: Two<br />
essential components <strong>of</strong> an early childhood system. In P. Wesley <strong>and</strong> V. Buysse<br />
(Eds.), The quest for quality: Promising innovations for early childhood programs.<br />
Baltimore, MD: Paul H. Brookes.<br />
20. Grisham-Brown, J., Gravil, M., Gao, X, & Missall, K. (2009). KIDS NOW<br />
evaluation. Lexington, KY: University <strong>of</strong> Kentucky.<br />
21. Pope, B. & Magda, J. (2009). Tennessee report card <strong>and</strong> star quality program: Year 7.<br />
annual report. Knoxville, TN: The University <strong>of</strong> Tennessee, College <strong>of</strong> Social Work,<br />
Office <strong>of</strong> Research <strong>and</strong> Public Service.<br />
22. Maxwell, K. L. (2009, October). Rhode Isl<strong>and</strong>’s 2009 child care center <strong>and</strong> preschool<br />
quality study. Presentation to <strong>the</strong> <strong>Bright</strong>Stars steering committee, Providence, RI.<br />
23. Bryant, D., Maxwell, K., Taylor, K., Poe, M., Peisner-Feinberg, E., & Bernier, K.<br />
(2003). Smart Start <strong>and</strong> preschool child care quality in NC: Change over time <strong>and</strong><br />
relation to children’s readiness. Chapel Hill, NC: The University <strong>of</strong> North Carolina,<br />
FPG <strong>Child</strong> Development Institute.<br />
24. See reference 21.<br />
<strong>Georgia</strong> <strong>Study</strong> <strong>of</strong> <strong>Early</strong> <strong>Care</strong> <strong>and</strong> <strong>Education</strong>: <strong>Child</strong> <strong>Care</strong> Center Findings<br />
25. Kagan, S. L., & Rigby, E. (2003). Improving <strong>the</strong> readiness <strong>of</strong> children for school:<br />
Recommendations for state policy. Washington, DC: Center for <strong>the</strong> <strong>Study</strong> <strong>of</strong> Social<br />
Policy. Retrieved November 2, 2009 <strong>from</strong> http://www.cssp.org/policymatters/<br />
background.html<br />
23
<strong>Georgia</strong><br />
<strong>Study</strong> <strong>of</strong><br />
<strong>Early</strong> <strong>Care</strong><br />
<strong>and</strong><strong>Education</strong><br />
Findings <strong>from</strong><br />
<strong>Georgia</strong>’s<br />
Pre-K Program<br />
December 2009<br />
<strong>Georgia</strong><br />
<strong>Study</strong> <strong>of</strong><br />
<strong>Early</strong> <strong>Care</strong><br />
<strong>and</strong><strong>Education</strong><br />
<strong>Child</strong> <strong>Care</strong><br />
Center<br />
Findings<br />
December 2009<br />
In 2008–09, FPG <strong>Child</strong> Development Institute<br />
conducted a statewide study <strong>of</strong> r<strong>and</strong>omly selected<br />
licensed child care centers <strong>and</strong> <strong>Georgia</strong>’s Pre-K<br />
programs, collecting data on <strong>the</strong> observed<br />
classroom quality <strong>and</strong> characteristics <strong>of</strong> <strong>the</strong>se<br />
programs. Findings <strong>from</strong> this study are described in<br />
two reports. The report <strong>Georgia</strong> <strong>Study</strong> <strong>of</strong> <strong>Early</strong> <strong>Care</strong><br />
<strong>and</strong> <strong>Education</strong>: <strong>Child</strong> <strong>Care</strong> Center Findings describes<br />
<strong>the</strong> overall study <strong>and</strong> summarizes results for infant,<br />
toddler, <strong>and</strong> preschool classrooms (o<strong>the</strong>r than<br />
<strong>Georgia</strong>’s Pre-K) in child care centers. The report<br />
<strong>Georgia</strong> <strong>Study</strong> <strong>of</strong> <strong>Early</strong> <strong>Care</strong> <strong>and</strong> <strong>Education</strong>: Findings<br />
<strong>from</strong> <strong>Georgia</strong>’s Pre-K Program describes <strong>the</strong> overall<br />
study <strong>and</strong> summarizes results <strong>from</strong> <strong>Georgia</strong>’s Pre-K<br />
classes in schools <strong>and</strong> child care centers. Please read<br />
both reports to underst<strong>and</strong> <strong>the</strong> quality <strong>of</strong> early care<br />
<strong>and</strong> education in child care centers <strong>and</strong> <strong>Georgia</strong>’s<br />
Pre-K programs serving <strong>Georgia</strong>’s young children.