Georgia Study of Early Care and Education: Child - Bright from the ...
Georgia Study of Early Care and Education: Child - Bright from the ...
Georgia Study of Early Care and Education: Child - Bright from the ...

You also want an ePaper? Increase the reach of your titles
YUMPU automatically turns print PDFs into web optimized ePapers that Google loves.
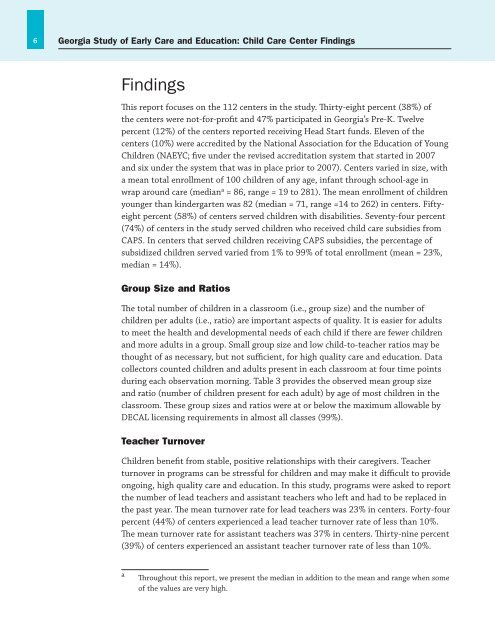
6 <strong>Georgia</strong> <strong>Study</strong> <strong>of</strong> <strong>Early</strong> <strong>Care</strong> <strong>and</strong> <strong>Education</strong>: <strong>Child</strong> <strong>Care</strong> Center Findings<br />
Findings<br />
This report focuses on <strong>the</strong> 112 centers in <strong>the</strong> study. Thirty-eight percent (38%) <strong>of</strong><br />
<strong>the</strong> centers were not-for-pr<strong>of</strong>it <strong>and</strong> 47% participated in <strong>Georgia</strong>’s Pre-K. Twelve<br />
percent (12%) <strong>of</strong> <strong>the</strong> centers reported receiving Head Start funds. Eleven <strong>of</strong> <strong>the</strong><br />
centers (10%) were accredited by <strong>the</strong> National Association for <strong>the</strong> <strong>Education</strong> <strong>of</strong> Young<br />
<strong>Child</strong>ren (NAEYC; five under <strong>the</strong> revised accreditation system that started in 2007<br />
<strong>and</strong> six under <strong>the</strong> system that was in place prior to 2007). Centers varied in size, with<br />
a mean total enrollment <strong>of</strong> 100 children <strong>of</strong> any age, infant through school-age in<br />
wrap around care (median a = 86, range = 19 to 281). The mean enrollment <strong>of</strong> children<br />
younger than kindergarten was 82 (median = 71, range =14 to 262) in centers. Fiftyeight<br />
percent (58%) <strong>of</strong> centers served children with disabilities. Seventy-four percent<br />
(74%) <strong>of</strong> centers in <strong>the</strong> study served children who received child care subsidies <strong>from</strong><br />
CAPS. In centers that served children receiving CAPS subsidies, <strong>the</strong> percentage <strong>of</strong><br />
subsidized children served varied <strong>from</strong> 1% to 99% <strong>of</strong> total enrollment (mean = 23%,<br />
median = 14%).<br />
Group Size <strong>and</strong> Ratios<br />
The total number <strong>of</strong> children in a classroom (i.e., group size) <strong>and</strong> <strong>the</strong> number <strong>of</strong><br />
children per adults (i.e., ratio) are important aspects <strong>of</strong> quality. It is easier for adults<br />
to meet <strong>the</strong> health <strong>and</strong> developmental needs <strong>of</strong> each child if <strong>the</strong>re are fewer children<br />
<strong>and</strong> more adults in a group. Small group size <strong>and</strong> low child-to-teacher ratios may be<br />
thought <strong>of</strong> as necessary, but not sufficient, for high quality care <strong>and</strong> education. Data<br />
collectors counted children <strong>and</strong> adults present in each classroom at four time points<br />
during each observation morning. Table 3 provides <strong>the</strong> observed mean group size<br />
<strong>and</strong> ratio (number <strong>of</strong> children present for each adult) by age <strong>of</strong> most children in <strong>the</strong><br />
classroom. These group sizes <strong>and</strong> ratios were at or below <strong>the</strong> maximum allowable by<br />
DECAL licensing requirements in almost all classes (99%).<br />
Teacher Turnover<br />
<strong>Child</strong>ren benefit <strong>from</strong> stable, positive relationships with <strong>the</strong>ir caregivers. Teacher<br />
turnover in programs can be stressful for children <strong>and</strong> may make it difficult to provide<br />
ongoing, high quality care <strong>and</strong> education. In this study, programs were asked to report<br />
<strong>the</strong> number <strong>of</strong> lead teachers <strong>and</strong> assistant teachers who left <strong>and</strong> had to be replaced in<br />
<strong>the</strong> past year. The mean turnover rate for lead teachers was 23% in centers. Forty-four<br />
percent (44%) <strong>of</strong> centers experienced a lead teacher turnover rate <strong>of</strong> less than 10%.<br />
The mean turnover rate for assistant teachers was 37% in centers. Thirty-nine percent<br />
(39%) <strong>of</strong> centers experienced an assistant teacher turnover rate <strong>of</strong> less than 10%.<br />
a Throughout this report, we present <strong>the</strong> median in addition to <strong>the</strong> mean <strong>and</strong> range when some<br />
<strong>of</strong> <strong>the</strong> values are very high.