Georgia Study of Early Care and Education: Child - Bright from the ...
Georgia Study of Early Care and Education: Child - Bright from the ...
Georgia Study of Early Care and Education: Child - Bright from the ...

Create successful ePaper yourself
Turn your PDF publications into a flip-book with our unique Google optimized e-Paper software.
Classroom Quality<br />
Figure 1. Quality <strong>of</strong> Infant/Toddler<br />
Classrooms in <strong>Child</strong> <strong>Care</strong> Centers<br />
(ITERS–R total mean = 2.74)<br />
Percentage <strong>of</strong> Classrooms<br />
8 <strong>Georgia</strong> <strong>Study</strong> <strong>of</strong> <strong>Early</strong> <strong>Care</strong> <strong>and</strong> <strong>Education</strong>: <strong>Child</strong> <strong>Care</strong> Center Findings<br />
100<br />
80<br />
60<br />
40<br />
20<br />
0<br />
28%<br />
1.0–1.9<br />
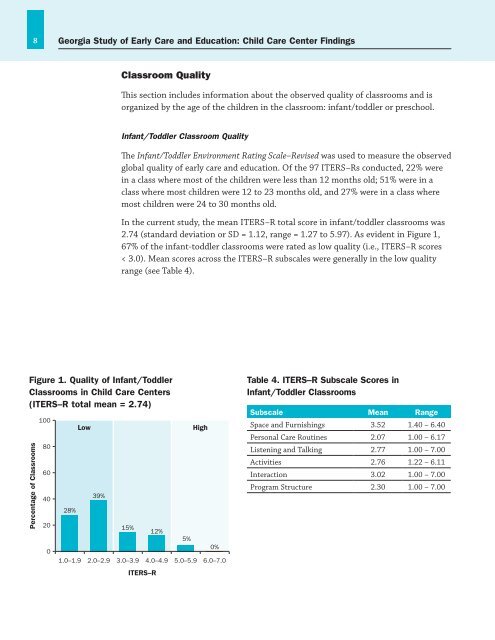
This section includes information about <strong>the</strong> observed quality <strong>of</strong> classrooms <strong>and</strong> is<br />
organized by <strong>the</strong> age <strong>of</strong> <strong>the</strong> children in <strong>the</strong> classroom: infant/toddler or preschool.<br />
Infant/Toddler Classroom Quality<br />
The Infant/Toddler Environment Rating Scale–Revised was used to measure <strong>the</strong> observed<br />
global quality <strong>of</strong> early care <strong>and</strong> education. Of <strong>the</strong> 97 ITERS–Rs conducted, 22% were<br />
in a class where most <strong>of</strong> <strong>the</strong> children were less than 12 months old; 51% were in a<br />
class where most children were 12 to 23 months old, <strong>and</strong> 27% were in a class where<br />
most children were 24 to 30 months old.<br />
In <strong>the</strong> current study, <strong>the</strong> mean ITERS–R total score in infant/toddler classrooms was<br />
2.74 (st<strong>and</strong>ard deviation or SD = 1.12, range = 1.27 to 5.97). As evident in Figure 1,<br />
67% <strong>of</strong> <strong>the</strong> infant-toddler classrooms were rated as low quality (i.e., ITERS–R scores<br />
< 3.0). Mean scores across <strong>the</strong> ITERS–R subscales were generally in <strong>the</strong> low quality<br />
range (see Table 4).<br />
Low High<br />
39%<br />
2.0–2.9<br />
15%<br />
3.0–3.9<br />
ITERS–R<br />
12%<br />
4.0–4.9<br />
5%<br />
5.0–5.9<br />
0%<br />
6.0–7.0<br />
Table 4. ITERS–R Subscale Scores in<br />
Infant/ Toddler Classrooms<br />
Subscale Mean Range<br />
Space <strong>and</strong> Furnishings 3.52 1.40 – 6.40<br />
Personal <strong>Care</strong> Routines 2.07 1.00 – 6.17<br />
Listening <strong>and</strong> Talking 2.77 1.00 – 7.00<br />
Activities 2.76 1.22 – 6.11<br />
Interaction 3.02 1.00 – 7.00<br />
Program Structure 2.30 1.00 – 7.00