Georgia Study of Early Care and Education: Child - Bright from the ...
Georgia Study of Early Care and Education: Child - Bright from the ...
Georgia Study of Early Care and Education: Child - Bright from the ...

You also want an ePaper? Increase the reach of your titles
YUMPU automatically turns print PDFs into web optimized ePapers that Google loves.
Program Characteristics <strong>and</strong> Services<br />
This section <strong>of</strong> <strong>the</strong> report includes information about program-level characteristics, such<br />
as <strong>the</strong> use <strong>of</strong> curricula <strong>and</strong> family support activities.<br />
Curricula <strong>and</strong> <strong>Child</strong> Assessments<br />
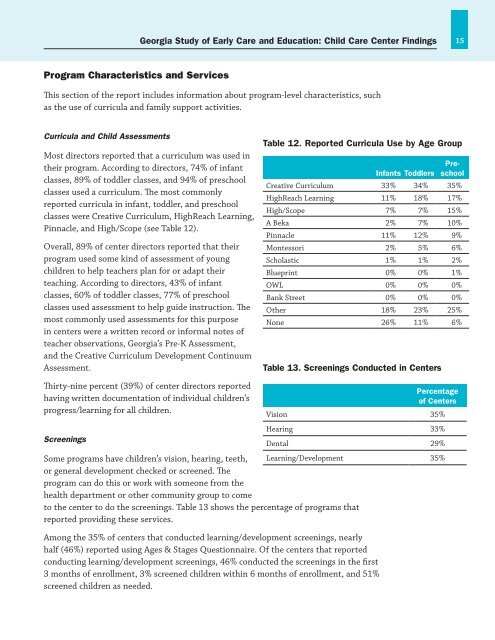
Most directors reported that a curriculum was used in<br />
<strong>the</strong>ir program. According to directors, 74% <strong>of</strong> infant<br />
classes, 89% <strong>of</strong> toddler classes, <strong>and</strong> 94% <strong>of</strong> preschool<br />
classes used a curriculum. The most commonly<br />
reported curricula in infant, toddler, <strong>and</strong> preschool<br />
classes were Creative Curriculum, HighReach Learning,<br />
Pinnacle, <strong>and</strong> High/Scope (see Table 12).<br />
Overall, 89% <strong>of</strong> center directors reported that <strong>the</strong>ir<br />
program used some kind <strong>of</strong> assessment <strong>of</strong> young<br />
children to help teachers plan for or adapt <strong>the</strong>ir<br />
teaching. According to directors, 43% <strong>of</strong> infant<br />
classes, 60% <strong>of</strong> toddler classes, 77% <strong>of</strong> preschool<br />
classes used assessment to help guide instruction. The<br />
most commonly used assessments for this purpose<br />
in centers were a written record or informal notes <strong>of</strong><br />
teacher observations, <strong>Georgia</strong>’s Pre-K Assessment,<br />
<strong>and</strong> <strong>the</strong> Creative Curriculum Development Continuum<br />
Assessment.<br />
Thirty-nine percent (39%) <strong>of</strong> center directors reported<br />
having written documentation <strong>of</strong> individual children’s<br />
progress/learning for all children.<br />
Screenings<br />
<strong>Georgia</strong> <strong>Study</strong> <strong>of</strong> <strong>Early</strong> <strong>Care</strong> <strong>and</strong> <strong>Education</strong>: <strong>Child</strong> <strong>Care</strong> Center Findings<br />
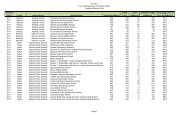
Table 12. Reported Curricula Use by Age Group<br />
Some programs have children’s vision, hearing, teeth,<br />
or general development checked or screened. The<br />
program can do this or work with someone <strong>from</strong> <strong>the</strong><br />
health department or o<strong>the</strong>r community group to come<br />
Learning/Development 35%<br />
to <strong>the</strong> center to do <strong>the</strong> screenings. Table 13 shows <strong>the</strong> percentage <strong>of</strong> programs that<br />
reported providing <strong>the</strong>se services.<br />
Among <strong>the</strong> 35% <strong>of</strong> centers that conducted learning/development screenings, nearly<br />
half (46%) reported using Ages & Stages Questionnaire. Of <strong>the</strong> centers that reported<br />
conducting learning/development screenings, 46% conducted <strong>the</strong> screenings in <strong>the</strong> first<br />
3 months <strong>of</strong> enrollment, 3% screened children within 6 months <strong>of</strong> enrollment, <strong>and</strong> 51%<br />
screened children as needed.<br />
Infants Toddlers<br />
Preschool<br />
Creative Curriculum 33% 34% 35%<br />
HighReach Learning 11% 18% 17%<br />
High/Scope 7% 7% 15%<br />
A Beka 2% 7% 10%<br />
Pinnacle 11% 12% 9%<br />
Montessori 2% 5% 6%<br />
Scholastic 1% 1% 2%<br />
Blueprint 0% 0% 1%<br />
OWL 0% 0% 0%<br />
Bank Street 0% 0% 0%<br />
O<strong>the</strong>r 18% 23% 25%<br />
None 26% 11% 6%<br />
Table 13. Screenings Conducted in Centers<br />
Percentage<br />
<strong>of</strong> Centers<br />
Vision 35%<br />
Hearing 33%<br />
Dental 29%<br />
15