Lawrence et al., 2012: DRAFT: JGR: Ambient Noise Numerical ...
Lawrence et al., 2012: DRAFT: JGR: Ambient Noise Numerical ...
Lawrence et al., 2012: DRAFT: JGR: Ambient Noise Numerical ...
You also want an ePaper? Increase the reach of your titles
YUMPU automatically turns print PDFs into web optimized ePapers that Google loves.
<strong>Lawrence</strong> <strong>et</strong> <strong>al</strong>., <strong>2012</strong>: <strong>DRAFT</strong>: <strong>JGR</strong>: <strong>Ambient</strong> <strong>Noise</strong> Numeric<strong>al</strong> Ev<strong>al</strong>uation<br />
We explore the param<strong>et</strong>er domain within which equation 10 is v<strong>al</strong>id to characterize the<br />
appropriate ambient seismic field. The three dimension sc<strong>al</strong>es, the source-length sc<strong>al</strong>e Ls,<br />
the receiver-length sc<strong>al</strong>e Lx and the source-receiver separation Δsx reflect the radiation<br />
aperture with the ratios Ls/Δsx and Ls/Lx (i.e, Figure 1). Another factor to consider is the<br />
number of sources, Ns, relative to the magnitude distribution, Ms. The larger the range of<br />
source amplitudes used to generate the synth<strong>et</strong>ic spectra the fewer the sources dominate<br />
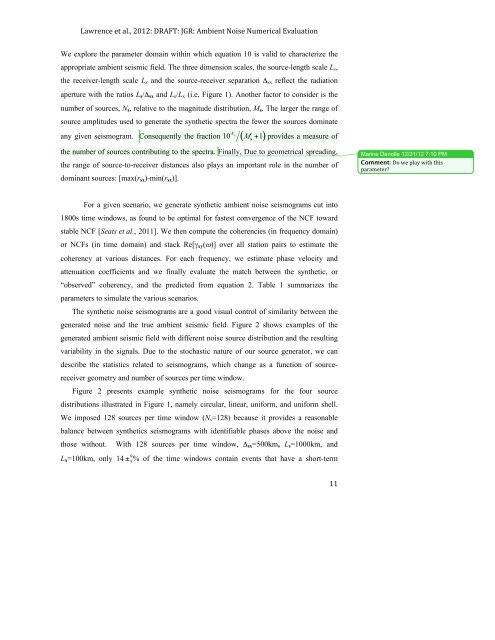
any given seismogram. Consequently the fraction provides a measure of<br />
the number of sources contributing to the spectra. Fin<strong>al</strong>ly, Due to geom<strong>et</strong>ric<strong>al</strong> spreading,<br />
the range of source-to-receiver distances <strong>al</strong>so plays an important role in the number of<br />
dominant sources: [max(rsx)-min(rsx)].<br />
For a given scenario, we generate synth<strong>et</strong>ic ambient noise seismograms cut into<br />
1800s time windows, as found to be optim<strong>al</strong> for fastest convergence of the NCF toward<br />
stable NCF [Seats <strong>et</strong> <strong>al</strong>., 2011]. We then compute the coherencies (in frequency domain)<br />
or NCFs (in time domain) and stack Re[γxy(ω)] over <strong>al</strong>l station pairs to estimate the<br />
coherency at various distances. For each frequency, we estimate phase velocity and<br />
attenuation coefficients and we fin<strong>al</strong>ly ev<strong>al</strong>uate the match b<strong>et</strong>ween the synth<strong>et</strong>ic, or<br />
“observed” coherency, and the predicted from equation 2. Table 1 summarizes the<br />
param<strong>et</strong>ers to simulate the various scenarios.<br />
The synth<strong>et</strong>ic noise seismograms are a good visu<strong>al</strong> control of similarity b<strong>et</strong>ween the<br />
generated noise and the true ambient seismic field. Figure 2 shows examples of the<br />
generated ambient seismic field with different noise source distribution and the resulting<br />
variability in the sign<strong>al</strong>s. Due to the stochastic nature of our source generator, we can<br />
describe the statistics related to seismograms, which change as a function of source-<br />
receiver geom<strong>et</strong>ry and number of sources per time window.<br />
Figure 2 presents example synth<strong>et</strong>ic noise seismograms for the four source<br />
distributions illustrated in Figure 1, namely circular, linear, uniform, and uniform shell.<br />
We imposed 128 sources per time window (Ns=128) because it provides a reasonable<br />
b<strong>al</strong>ance b<strong>et</strong>ween synth<strong>et</strong>ics seismograms with identifiable phases above the noise and<br />
those without. With 128 sources per time window, Δsx=500km, Ls=1000km, and<br />
Lx=100km, only 14 % of the time windows contain events that have a short-term<br />
11<br />
Marine Denolle 12/31/12 7:10 PM<br />
Comment: Do we play with this<br />
param<strong>et</strong>er?


