

Lawrence et al., 2012: DRAFT: JGR: Ambient Noise Numerical ...
Lawrence et al., 2012: DRAFT: JGR: Ambient Noise Numerical ...
Lawrence et al., 2012: DRAFT: JGR: Ambient Noise Numerical ...

Create successful ePaper yourself
Turn your PDF publications into a flip-book with our unique Google optimized e-Paper software.
<strong>Lawrence</strong> <strong>et</strong> <strong>al</strong>., <strong>2012</strong>: <strong>DRAFT</strong>: <strong>JGR</strong>: <strong>Ambient</strong> <strong>Noise</strong> Numeric<strong>al</strong> Ev<strong>al</strong>uation<br />
Source Array<br />
Geom<strong>et</strong>ry*<br />
Table 1: Description of Synth<strong>et</strong>ic Scenarios<br />
Ns/1800s Days Overlap Lx<br />
(km)<br />
Ls<br />
(km)<br />
Δsx<br />
(km)<br />
A (151 runs) 25 30 50% 100 10 1 -10 4 10 1 -10 4 2<br />
B (151 runs) 25 30 50% 100 10 1 -10 4 10 1 -10 4 2<br />
C (151 runs) 25 30 50% 100 10 1 -10 4 10 1 -10 4 2<br />
D (151 runs) 25 30 50% 100 10 1 -10 4 10 1 -10 4 2<br />
B (24 runs) 2 0-8 30 50% 100 10 3 5×10 2<br />
Ms<br />
1,2,4,8<br />
B (24 runs) 2 0-4 365 50% 100 10 3 5×10 2 1,2,4,8<br />
* The labels correspond to the sub-panels (A-D) in figure 1. A is a circle source.<br />
B is a linear source. C is a uniformly random filled circle. D is a uniformly<br />
random filled circular shell.<br />
Figure 1<br />
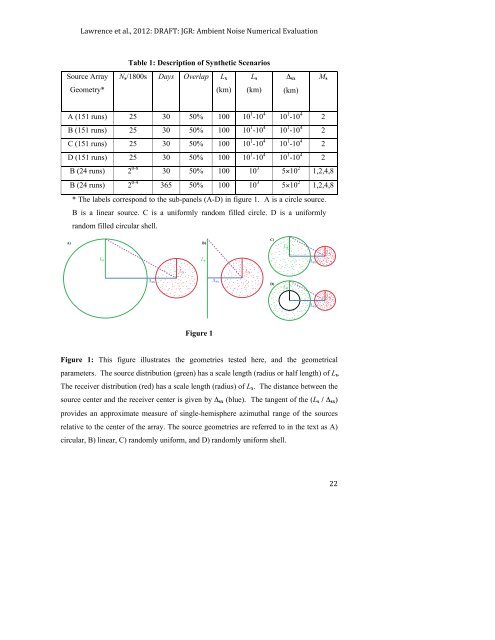
Figure 1: This figure illustrates the geom<strong>et</strong>ries tested here, and the geom<strong>et</strong>ric<strong>al</strong><br />
param<strong>et</strong>ers. The source distribution (green) has a sc<strong>al</strong>e length (radius or h<strong>al</strong>f length) of Ls.<br />
The receiver distribution (red) has a sc<strong>al</strong>e length (radius) of Lx. The distance b<strong>et</strong>ween the<br />
source center and the receiver center is given by Δsx (blue). The tangent of the (Ls / Δsx)<br />
provides an approximate measure of single-hemisphere azimuth<strong>al</strong> range of the sources<br />
relative to the center of the array. The source geom<strong>et</strong>ries are referred to in the text as A)<br />
circular, B) linear, C) randomly uniform, and D) randomly uniform shell.<br />
22


