The Inktomi Climate Lab: An Integrated Environment for ... - Events
The Inktomi Climate Lab: An Integrated Environment for ... - Events
The Inktomi Climate Lab: An Integrated Environment for ... - Events

Create successful ePaper yourself
Turn your PDF publications into a flip-book with our unique Google optimized e-Paper software.
<strong>The</strong> <strong>Inktomi</strong> <strong>Climate</strong> <strong>Lab</strong>: <strong>An</strong> <strong>Integrated</strong> <strong>Environment</strong> <strong>for</strong><br />
<strong>An</strong>alyzing and Simulating Customer Network Traffic<br />
Stephane Gigandet, Ashok Sudarsanam, and <strong>An</strong>shu Aggarwal<br />
{stephane, ashok, anshu}@inktomi.com<br />
<strong>Inktomi</strong> Corporation<br />
4100 East 3 rd Avenue, Foster City, CA 94404<br />
tel 650 653 6980<br />
fax 650 653 1848<br />
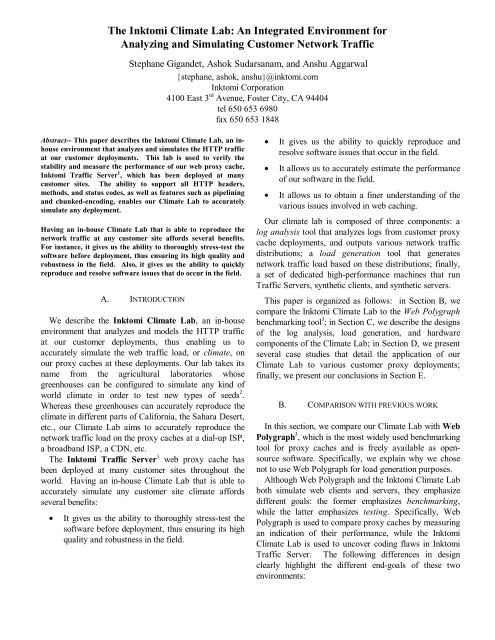
Abstract-- This paper describes the <strong>Inktomi</strong> <strong>Climate</strong> <strong>Lab</strong>, an inhouse<br />
environment that analyzes and simulates the HTTP traffic<br />
at our customer deployments. This lab is used to verify the<br />
stability and measure the per<strong>for</strong>mance of our web proxy cache,<br />
<strong>Inktomi</strong> Traffic Server 1 , which has been deployed at many<br />
customer sites. <strong>The</strong> ability to support all HTTP headers,<br />
methods, and status codes, as well as features such as pipelining<br />
and chunked-encoding, enables our <strong>Climate</strong> <strong>Lab</strong> to accurately<br />
simulate any deployment.<br />
Having an in-house <strong>Climate</strong> <strong>Lab</strong> that is able to reproduce the<br />
network traffic at any customer site af<strong>for</strong>ds several benefits.<br />
For instance, it gives us the ability to thoroughly stress-test the<br />
software be<strong>for</strong>e deployment, thus ensuring its high quality and<br />
robustness in the field. Also, it gives us the ability to quickly<br />
reproduce and resolve software issues that do occur in the field.<br />
A. INTRODUCTION<br />
We describe the <strong>Inktomi</strong> <strong>Climate</strong> <strong>Lab</strong>, an in-house<br />
environment that analyzes and models the HTTP traffic<br />
at our customer deployments, thus enabling us to<br />
accurately simulate the web traffic load, or climate, on<br />
our proxy caches at these deployments. Our lab takes its<br />
name from the agricultural laboratories whose<br />
greenhouses can be configured to simulate any kind of<br />
world climate in order to test new types of seeds 2 .<br />
Whereas these greenhouses can accurately reproduce the<br />
climate in different parts of Cali<strong>for</strong>nia, the Sahara Desert,<br />
etc., our <strong>Climate</strong> <strong>Lab</strong> aims to accurately reproduce the<br />
network traffic load on the proxy caches at a dial-up ISP,<br />
abroadbandISP,aCDN,etc.<br />
<strong>The</strong> <strong>Inktomi</strong> Traffic Server 1 web proxy cache has<br />
been deployed at many customer sites throughout the<br />
world. Having an in-house <strong>Climate</strong> <strong>Lab</strong> that is able to<br />
accurately simulate any customer site climate af<strong>for</strong>ds<br />
several benefits:<br />
• It gives us the ability to thoroughly stress-test the<br />
software be<strong>for</strong>e deployment, thus ensuring its high<br />
quality and robustness in the field.<br />
• It gives us the ability to quickly reproduce and<br />
resolve software issues that occur in the field.<br />
• It allows us to accurately estimate the per<strong>for</strong>mance<br />
of our software in the field.<br />
• It allows us to obtain a finer understanding of the<br />
various issues involved in web caching.<br />
Our climate lab is composed of three components: a<br />
log analysis tool that analyzes logs from customer proxy<br />
cache deployments, and outputs various network traffic<br />
distributions; a load generation tool that generates<br />
network traffic load based on these distributions; finally,<br />
a set of dedicated high-per<strong>for</strong>mance machines that run<br />
Traffic Servers, synthetic clients, and synthetic servers.<br />
This paper is organized as follows: in Section B, we<br />
compare the <strong>Inktomi</strong> <strong>Climate</strong> <strong>Lab</strong> to the Web Polygraph<br />
benchmarking tool 3 ; in Section C, we describe the designs<br />
of the log analysis, load generation, and hardware<br />
components of the <strong>Climate</strong> <strong>Lab</strong>; in Section D, we present<br />
several case studies that detail the application of our<br />
<strong>Climate</strong> <strong>Lab</strong> to various customer proxy deployments;<br />
finally, we present our conclusions in Section E.<br />
B. COMPARISON WITH PREVIOUS WORK<br />
In this section, we compare our <strong>Climate</strong> <strong>Lab</strong> with Web<br />
Polygraph 3 , which is the most widely used benchmarking<br />
tool <strong>for</strong> proxy caches and is freely available as opensource<br />
software. Specifically, we explain why we chose<br />
not to use Web Polygraph <strong>for</strong> load generation purposes.<br />
Although Web Polygraph and the <strong>Inktomi</strong> <strong>Climate</strong> <strong>Lab</strong><br />
both simulate web clients and servers, they emphasize<br />
different goals: the <strong>for</strong>mer emphasizes benchmarking,<br />
while the latter emphasizes testing. Specifically, Web<br />
Polygraph is used to compare proxy caches by measuring<br />
an indication of their per<strong>for</strong>mance, while the <strong>Inktomi</strong><br />
<strong>Climate</strong> <strong>Lab</strong> is used to uncover coding flaws in <strong>Inktomi</strong><br />
Traffic Server. <strong>The</strong> following differences in design<br />
clearly highlight the different end-goals of these two<br />
environments:
• Since the <strong>Climate</strong> <strong>Lab</strong> aims to exercise every<br />
control path of Traffic Server code, it provides<br />
complete support <strong>for</strong> all HTTP protocols 4,5,6 . In<br />
particular, the <strong>Climate</strong> <strong>Lab</strong> is able to generate web<br />
traffic that includes all HTTP methods, request and<br />
response headers, and response status codes. In<br />
•<br />
contrast, the web traffic that Web Polygraph is<br />
capable of generating includes support <strong>for</strong> the<br />
HTTP GET method only, and just a few headers<br />
and status codes.<br />
Both Web Polygraph and the <strong>Inktomi</strong> <strong>Climate</strong> <strong>Lab</strong><br />
simulate network conditions such as initial delay,<br />
burstiness, bandwidth limitations, etc. Web<br />
Polygraph relies exclusively on FreeBSD’s<br />
Dummynet tool 7<br />
to simulate these network<br />
conditions at the kernel level. In order to achieve<br />
greater flexibility, our <strong>Climate</strong> <strong>Lab</strong> simulates these<br />
network conditions at the application level, thus<br />
enabling us to simulate differing and changing<br />
network conditions across, and even within, client<br />
sessions. We have observed, however, that<br />
operating system buffering does interfere with our<br />
application-level implementation. Consequently,<br />
we are in the process of evaluating new solutions<br />
by coupling our implementation with Dummynet,<br />
as well as hardware WAN simulators such as<br />
Shunra Storm 8 .<br />
• <strong>The</strong> most important design difference is that the<br />
<strong>Inktomi</strong> <strong>Climate</strong> <strong>Lab</strong> features a log analysis<br />
component while Web Polygraph does not. For<br />
benchmarking purposes, Web Polygraph provides<br />
several versions of two well-defined workloads,<br />
PolyMix and WebAxe, that are used to evaluate<br />
the per<strong>for</strong>mance of every caching product.<br />
However, in order to fully test a web caching<br />
product, an environment must be able to generate<br />
many different workloads. Ideally, each customer<br />
deployment should have a corresponding workload.<br />
Furthermore, given the highly dynamic nature of<br />
the Internet, each customer deployment should<br />
have multiple corresponding workloads. <strong>The</strong> log<br />
analysis component of the <strong>Inktomi</strong> <strong>Climate</strong> <strong>Lab</strong><br />
aims to generate representative workloads in a<br />
practical manner. As will be described in the<br />
following section, this component analyzes<br />
customer cache access logs in order to create<br />
representative workload plans.<br />
Web Polygraph does implement some interesting features<br />
that are currently not implemented in the <strong>Climate</strong> <strong>Lab</strong>,<br />
such as the ability to vary workload over time and DNS<br />
simulation. However, the primary reason why the<br />
Customer Deployment<br />
Internet<br />
<strong>Inktomi</strong><br />
Traffic<br />
Servers<br />
Users<br />
Loggen<br />
logs<br />
<strong>Climate</strong> <strong>Lab</strong> does not interface directly to Web Polygraph<br />
and automatically generate Polygraph configuration files<br />
is because of our need <strong>for</strong> complete HTTP support during<br />
load generation.<br />
C. CLIMATE LAB DESIGN<br />
In order to fully test our web proxy cache, it is<br />
necessary to have a tool that simulates both web clients<br />
and servers. We have developed a load generation tool<br />
that can simulate thousands of clients and servers on a<br />
single machine. This tool is configured through test<br />
plans, which specify the distributions of various web<br />
traffic parameters. <strong>The</strong>se test plans are generated by<br />
per<strong>for</strong>ming log analysis on the logs from customer proxy<br />
cache deployments. <strong>The</strong> overall design of our <strong>Climate</strong><br />
<strong>Lab</strong> is illustrated in Figure 1. We now describe in detail<br />
the log analysis, load generation, and hardware<br />
components of our <strong>Climate</strong> <strong>Lab</strong>.<br />
1st. Log <strong>An</strong>alysis Tool: Loggen<br />
Loadgen<br />
test plan<br />
<strong>Inktomi</strong> <strong>Climate</strong> <strong>Lab</strong><br />
Loadgen<br />
servers<br />
<strong>Inktomi</strong><br />
Traffic<br />
Servers<br />
Loadgen<br />
clients<br />
Fig. 1. Interaction between the components of the<br />
<strong>Inktomi</strong> <strong>Climate</strong> <strong>Lab</strong>.<br />
Our log analysis tool, Loggen, generates test plans that<br />
shape the web traffic that is generated by our load<br />
generation tool, Loadgen. We have used Traffic Server's<br />
built-in custom logging facility to enable our customers’<br />
caches to log a variety of useful in<strong>for</strong>mation. This<br />
in<strong>for</strong>mation, which is unavailable in standard Squid log<br />
files 9 , includes the set of all HTTP headers in each client<br />
request and server response, the size of each request and<br />
response body, and transfer times. Loggen also supports<br />
standard Squid log files at the expense of using default<br />
values <strong>for</strong> most header distributions.
Loggen then parses the custom logs and computes<br />
various statistics, such as the probability of a specific<br />
HTTP header being in a client request or server response.<br />
More complex properties, such as the frequency of a<br />
document, can be defined using Zipf-like distributions 10 .<br />
However, fitting log data to theoretical distributions is a<br />
very complex task (see the discussion on the SURGE<br />
Scalable URL Request Generator 11 ). Thus, to model<br />
some properties such as the document size, we are<br />
currently using distributions of discrete intervals <strong>for</strong><br />
which parameters and pseudo-random numbers are easier<br />
to compute and that can model non-expected distributions<br />
from a particular customer.<br />
Loggen also keeps track of individual client sessions to<br />
compute distributions <strong>for</strong> the number of clicks per session<br />
and the number of requests per clicks and to estimate<br />
network conditions <strong>for</strong> the client and server.<br />
It is important to note that we are primarily interested<br />
in the network load as seen by the proxy. For instance,<br />
other proxies or dynamic allocation of IP addresses might<br />
result in two client sessions by two different individuals<br />
being identified as one, but it is consistent with what the<br />
proxy actually sees.<br />
<strong>The</strong> log analysis results are then used to generate an<br />
XML-based test plan that Loadgen uses to generate web<br />
traffic. A small extract of a sample test plan is presented<br />
and described in Figure 2.<br />
It should be noted that <strong>for</strong> user confidentiality<br />
purposes, customer logs are not provided to us. Instead,<br />
log analysis is per<strong>for</strong>med at the customer site itself, and<br />
only the resulting test plans that contain distributions but<br />
no actual access data are provided to us.<br />
2nd. Load Genation Tool: Loadgen<br />
Our load generation tool, Loadgen, is able to simulate<br />
both clients and servers. For per<strong>for</strong>mance reasons, it is<br />
implemented as a single-threaded process that constantly<br />
polls client and server connections within a tight loop.<br />
<strong>The</strong>re are three reasons why we chose to simulate web<br />
servers within Loadgen, as opposed to replaying the<br />
logged URLs and allowing <strong>Inktomi</strong> Traffic Server to<br />
contact the origin servers directly:<br />
• <strong>The</strong> amount of bandwidth needed to fully stresstest<br />
a proxy cache on real URLs is essentially<br />
unaf<strong>for</strong>dable.<br />
• It is considered very bad etiquette to send a large<br />
amount of traffic to real web sites <strong>for</strong> testing<br />
purposes.<br />
• Stress-testing becomes non-deterministic due to<br />
origin server down-times and content changes, etc.<br />
<br />
Cache-Control 0.05<br />
<br />
public 0.10<br />
private 0.10<br />
no-cache 0.10<br />
no-store 0.10<br />
no-trans<strong>for</strong>m 0.10<br />
must-revalidate 0.10<br />
proxy-revalidate 0.10<br />
max-age=60 0.10<br />
s-maxage=45 0.10<br />
community="INKT" 0.10<br />
<br />
<br />
Fig. 2. Specification of the Cache-Control request header in<br />
a sample XML test plan: the Cache-Control header is<br />
present in 5% of the requests and its arguments are commaseparated<br />
values, which have a 10% probability. If none are<br />
selected, then one is chosen at random.<br />
Each simulated client attempts to reproduce the<br />
behavior of a user interacting with a browser. Each client<br />
session consists of one or more clicks on a particular<br />
web-site -- the individual clicks are separated by a userthink<br />
time. To model temporal locality, the web-site is<br />
chosen according to a site popularity distribution. To<br />
model spatial locality, all the documents requested during<br />
the session are considered to belong to the site and are<br />
chosen according to a page popularity distribution. <strong>The</strong><br />
requested url is a combination of the site and the page<br />
identifiers.<br />
Each click begins by requesting a document from the<br />
chosen web-site. As soon as the client begins to receive<br />
the response body, it may generate additional requests <strong>for</strong><br />
more documents from this site. <strong>The</strong>se requests correspond<br />
to images and files that are embedded within the initiallyrequested<br />
document. <strong>The</strong> client may send these requests<br />
to the server using a combination of the following three<br />
methods: establishing a new connection to the server <strong>for</strong><br />
each request, reusing the existing connection to send a<br />
new request after the response has been received, and<br />
pipelining all requests over a single connection.<br />
In order to be able to generate realistic web traffic,<br />
Loadgen provides support <strong>for</strong> every feature that is<br />
defined in the HTTP specifications 4,5,6 , such as persistent<br />
connections, request pipelining, chunked-encoding, and<br />
range requests. Additionally, client requests and server<br />
responses are capable of employing every request<br />
method, header, and response status code defined in the<br />
HTTP specifications. A very important feature that has<br />
been implemented in Loadgen is the ability to maintain<br />
state in<strong>for</strong>mation, which includes:
• Managing cookie jars <strong>for</strong> each client session so<br />
that clients can send back cookies that have been<br />
sent by a particular web-site.<br />
• Managing Last-Modified times and ETags so that<br />
servers can respond realistically to If-Modified-<br />
Since and If-None-Match conditional requests.<br />
Loadgen also has the ability to simulate network<br />
conditions such as initial delay, burstiness, and<br />
bandwidth limitations. We chose to model network<br />
conditions at the application level rather than using<br />
hardware WAN simulators 8 or kernel-level simulators<br />
such as Dummynet 7 . This choice of implementation<br />
enables Loadgen to simulate completely different network<br />
conditions <strong>for</strong> each client session, and to also dynamically<br />
change them within a single session.<br />
Finally, web proxy caches must be robust enough to<br />
handle all abnormal conditions, such as broken HTTP<br />
implementations in clients and servers and unexpected<br />
aborts. Consequently, Loadgen provides support <strong>for</strong><br />
generating HTTP headers and bodies that have been<br />
corrupted in a number of ways (e.g. errors in time-based<br />
header values 12 ), and the ability of clients and servers to<br />
abort transactions at any time.<br />
3rd. Hardware and Network Configuration<br />
We have dedicated a total of 16 high-per<strong>for</strong>mance<br />
machines to the operation of the <strong>Inktomi</strong> <strong>Climate</strong> <strong>Lab</strong>: 8<br />
Solaris PCs, 6 SUN E220s, and 2 Linux PCs. All<br />
machines belong to the same sub-net and are configured<br />
to use virtual IP addresses. A single machine can simulate<br />
thousands of clients and servers which use up to 256<br />
different IP addresses. Furthermore, depending on the<br />
desired traffic, one machine can generate up to 1,000<br />
HTTP transactions per second.<br />
D. CASE STUDIES<br />
We have generated and analyzed custom web traffic<br />
logs at two major ISP deployments. We have also<br />
analyzed the logs of our own internal proxy.<br />
Customer A logged 3 million operations during a 2<br />
hour period, Customer B logged 2 million operations<br />
during a 24 hour period and our proxy (referred to as<br />
Customer C) logged 330,000 operations during a 24 hour<br />
period. Note that the legend in Fig.3 also applies to all<br />
other figures. In the frequency density graphs, the area<br />
below the graph is proportional to the number of samples<br />
whose values are in a given range of the X axis.<br />
Hits<br />
Density<br />
Density<br />
Density<br />
800<br />
600<br />
400<br />
200<br />
0<br />
600<br />
500<br />
400<br />
300<br />
200<br />
100<br />
0<br />
Fig. 4. Frequency density of the number of requests per<br />
click distribution.<br />
100000<br />
10000<br />
1000<br />
100<br />
1<br />
1 100<br />
Popularity rank<br />
10000<br />
Fig. 5. Site popularity distribution. (double log scale)<br />
0.1<br />
0.08<br />
0.06<br />
0.04<br />
0.02<br />
10<br />
0<br />
Customer A<br />
Customer B<br />
Customer C<br />
0 1 2 3 4 5 6 7 8 9 10<br />
Number of clicks<br />
Fig. 3. Frequency density of the number of clicks<br />
distribution.<br />
0 1 2 3 4 5 6 7 8 9 10 11 1213 14 15<br />
Number of requests per click<br />
0 2000 4000 6000 8000 10000<br />
Document size (bytes)<br />
Fig. 6. Frequency density of the document size distribution.
In these figures, we present the number of clicks, number<br />
of requests per click, site popularity and document size<br />
empirical distributions because they can be rendered<br />
visually and they illustrate our click model. <strong>The</strong> following<br />
observations can be made:<br />
• <strong>The</strong> distributions of the three deployments are<br />
similar.<br />
• <strong>The</strong> site popularity distribution plotted in a double<br />
algorithmic scale <strong>for</strong>ms a line. This verifies earlier<br />
observations 10 that site popularity follows Zipf’s<br />
Law. <strong>The</strong> slope is similar <strong>for</strong> the three<br />
deployments.<br />
• <strong>The</strong> document size distributions show numerous<br />
spikes. One could reason that those spikes<br />
correspond to the most popular documents.<br />
However, the spike locations are different <strong>for</strong> the<br />
three deployments. A more in-depth analysis of<br />
Customer C’s logs has shown that they result from<br />
very few individuals who access pages that autoupdate<br />
very frequently such as stock quotes or<br />
more customer specific pages such as our own real<br />
time proxy statistics.<br />
We have used test plans generated by Loggen and<br />
sample test plans to configure Loadgen, and it has<br />
uncovered several software flaws that other internal load<br />
generation tools did not previously uncover. This is<br />
primarily due to the fact that unlike other tools, Loadgen<br />
provides complete support <strong>for</strong> all HTTP methods,<br />
headers and status codes. <strong>The</strong> flaws included small<br />
memory leaks that occurred in rare occasions and bad<br />
handling of unexpected headers and status codes.<br />
We are currently in the process of validating the<br />
<strong>Climate</strong> <strong>Lab</strong> model. Although quantifying the degree of<br />
accuracy of the reproduction of customer deployments is<br />
a very complex issue, we have identified several possible<br />
approaches:<br />
• Compare the caching proxy statistics generated<br />
during the log collection and during a <strong>Climate</strong> <strong>Lab</strong><br />
simulation.<br />
• Compare the test plan resulting from the analysis<br />
of customer logs with the test plan resulting from<br />
the analysis of logs collected during a simulation<br />
using the first test plan. Using this approach, we<br />
confirmed that due to insufficient timing data, the<br />
network condition distributions currently computed<br />
by Loggen were inaccurate.<br />
• Attempt to reproduce bugs reported by customers<br />
on previous versions of Traffic Server.<br />
E. CONCLUSIONS<br />
We have presented the <strong>Inktomi</strong> <strong>Climate</strong> <strong>Lab</strong>, a<br />
powerful in-house environment that analyzes and<br />
simulates real-world HTTP traffic. <strong>The</strong> <strong>Inktomi</strong> <strong>Climate</strong><br />
<strong>Lab</strong> represents our ef<strong>for</strong>ts at applying Internet traffic<br />
measurement to solving real-world problems. In<br />
particular, the ability to accurately reproduce in-house<br />
the HTTP traffic at any customer deployment allows us<br />
to stress-test our <strong>Inktomi</strong> Traffic Server proxy cache with<br />
a very high degree of confidence that no software issues<br />
will arise in the field (in fact, our <strong>Climate</strong> <strong>Lab</strong> may be<br />
used to stress-test any web proxy caching product). In<br />
the event that software issues do arise in the field, our<br />
<strong>Climate</strong> <strong>Lab</strong> allows us to quickly reproduce and resolve<br />
these issues.<br />
We have generated custom logs at several major ISP<br />
deployments as well as at our own internal deployment.<br />
<strong>The</strong> results of per<strong>for</strong>ming log analysis on these logs have<br />
enabled us to simulate several real-world climates. We<br />
are currently working on evaluating the accuracy of these<br />
simulations, but even in its present state, the <strong>Climate</strong> <strong>Lab</strong><br />
has already been deployed in-house, and is being used to<br />
uncover bugs and test the stability of Traffic Server.<br />
References<br />
[1] <strong>Inktomi</strong> Traffic Server. http://www.inktomi.com.<br />
[2] Monsanto.com. http://www.monsanto.com.<br />
[3] Web Polygraph. http://www.web-polygraph.org.<br />
[4] W3C. Hypertext Transfer Protocol – HTTP/0.9.<br />
1991.<br />
[5] T. Berners-Lee, R. Fielding, and H. Frystyk.<br />
Hypertext Transfer Protocol – HTTP/1.0. RFC 1945,<br />
May 1996.<br />
[6] R. Fielding, J. Gettys, J.C. Mogul, H. Frystyk, L.<br />
Masinter, P. Leach, and T. Berners-Lee. Hypertext<br />
Transfer Protocol – HTTP/1.1. RFC 2616, June 1999.<br />
[7] L. Rizzo. Dummynet: a simple approach to the<br />
evaluation of network protocols. ACM Computer<br />
Communication Review 27, 1. January 1997.<br />
[8] Shunra Storm WAN Simulator.<br />
http://www.shunra.com.<br />
[9] Squid Web Proxy Cache. http://www.squid-cache.org.<br />
[10] L. Breslau, P. Cao, L. Fan, G. Phillips and S.<br />
Shenker. Web Caching and Zipf-like distributions:<br />
Evidence and Implications. IEEE INFOCOM, March<br />
1999.<br />
[11] P. Bar<strong>for</strong>d and M. Crovella. Generating<br />
Representative Web Workloads <strong>for</strong> Network and Server<br />
Per<strong>for</strong>mance Evaluation. ACM SIGMETRICS, June<br />
1998.<br />
[12] J.C. Mogul. Errors in timestamp-based HTTP header<br />
values. WRL Research Report, December 1999.