Get PDF (2323K) - Wiley Online Library
Get PDF (2323K) - Wiley Online Library
Get PDF (2323K) - Wiley Online Library

You also want an ePaper? Increase the reach of your titles
YUMPU automatically turns print PDFs into web optimized ePapers that Google loves.
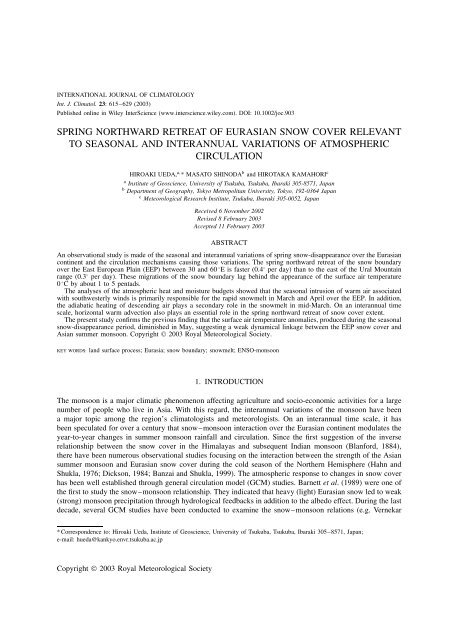
INTERNATIONAL JOURNAL OF CLIMATOLOGY<br />
Int. J. Climatol. 23: 615–629 (2003)<br />
Published online in <strong>Wiley</strong> InterScience (www.interscience.wiley.com). DOI: 10.1002/joc.903<br />
SPRING NORTHWARD RETREAT OF EURASIAN SNOW COVER RELEVANT<br />
TO SEASONAL AND INTERANNUAL VARIATIONS OF ATMOSPHERIC<br />
CIRCULATION<br />
HIROAKI UEDA, a, * MASATO SHINODA b and HIROTAKA KAMAHORI c<br />
a Institute of Geoscience, University of Tsukuba, Tsukuba, Ibaraki 305-8571, Japan<br />
b Department of Geography, Tokyo Metropolitan University, Tokyo, 192-0364 Japan<br />
c Meteorological Research Institute, Tsukuba, Ibaraki 305-0052, Japan<br />
Received 6 November 2002<br />
Revised 8 February 2003<br />
Accepted 11 February 2003<br />
ABSTRACT<br />
An observational study is made of the seasonal and interannual variations of spring snow-disappearance over the Eurasian<br />
continent and the circulation mechanisms causing those variations. The spring northward retreat of the snow boundary<br />
over the East European Plain (EEP) between 30 and 60 °E is faster (0.4° per day) than to the east of the Ural Mountain<br />
range (0.3° per day). These migrations of the snow boundary lag behind the appearance of the surface air temperature<br />
0 °C by about 1 to 5 pentads.<br />
The analyses of the atmospheric heat and moisture budgets showed that the seasonal intrusion of warm air associated<br />
with southwesterly winds is primarily responsible for the rapid snowmelt in March and April over the EEP. In addition,<br />
the adiabatic heating of descending air plays a secondary role in the snowmelt in mid-March. On an interannual time<br />
scale, horizontal warm advection also plays an essential role in the spring northward retreat of snow cover extent.<br />
The present study confirms the previous finding that the surface air temperature anomalies, produced during the seasonal<br />
snow-disappearance period, diminished in May, suggesting a weak dynamical linkage between the EEP snow cover and<br />
Asian summer monsoon. Copyright © 2003 Royal Meteorological Society.<br />
KEY WORDS: land surface process; Eurasia; snow boundary; snowmelt; ENSO-monsoon<br />
1. INTRODUCTION<br />
The monsoon is a major climatic phenomenon affecting agriculture and socio-economic activities for a large<br />
number of people who live in Asia. With this regard, the interannual variations of the monsoon have been<br />
a major topic among the region’s climatologists and meteorologists. On an interannual time scale, it has<br />
been speculated for over a century that snow–monsoon interaction over the Eurasian continent modulates the<br />
year-to-year changes in summer monsoon rainfall and circulation. Since the first suggestion of the inverse<br />
relationship between the snow cover in the Himalayas and subsequent Indian monsoon (Blanford, 1884),<br />
there have been numerous observational studies focusing on the interaction between the strength of the Asian<br />
summer monsoon and Eurasian snow cover during the cold season of the Northern Hemisphere (Hahn and<br />
Shukla, 1976; Dickson, 1984; Banzai and Shukla, 1999). The atmospheric response to changes in snow cover<br />
has been well established through general circulation model (GCM) studies. Barnett et al. (1989) were one of<br />
the first to study the snow–monsoon relationship. They indicated that heavy (light) Eurasian snow led to weak<br />
(strong) monsoon precipitation through hydrological feedbacks in addition to the albedo effect. During the last<br />
decade, several GCM studies have been conducted to examine the snow–monsoon relations (e.g. Vernekar<br />
* Correspondence to: Hiroaki Ueda, Institute of Geoscience, University of Tsukuba, Tsukuba, Ibaraki 305–8571, Japan;<br />
e-mail: hueda@kankyo.envr.tsukuba.ac.jp<br />
Copyright © 2003 Royal Meteorological Society
616 H. UEDA, M. SHINODA AND H. KAMAHORI<br />
et al., 1995, Douville and Royer, 1996). Yasunari et al. (1991) also found that the albedo effect dominated<br />
in the spring to reduce surface heating over the Tibetan Plateau. However, in summer, the albedo effect<br />
disappeared and excess water due to snowmelt caused the surface to cool, particularly at mid-latitudes. On<br />
the other hand, GCM experiments of Zwiers (1993) showed that the snow–monsoon relationship was weak.<br />
Recently, it has been found that the precursory land surface signals on an interannual time scale are not strong<br />
enough to determine the intensity of the broad-scale summer monsoon activities through GCM experiments<br />
(Shen et al., 1998) and observational studies (Shinoda, 2001; Shinoda et al., 2001). Although, Liu and Yanai<br />
(2001) showed that the springtime tropospheric temperature anomalies over the Eurasian continent positively<br />
correlate with the subsequent summer monsoon activity, they indicated that the temperature anomalies are<br />
mostly independent from those of the land surface conditions.<br />
Given the potential importance of the interannual variation of snow cover to the monsoon strength, it is no<br />
surprise that there have been many efforts to understand the extent of snow cover and its possible influence<br />
on the atmosphere. In contrast, there have been few studies that focus on the physical processes regulating<br />
the snow cover itself.<br />
Furthermore, it should be noted here that the results from the analyses of snow and ice charts data,<br />
produced by the National Oceanic and Atmospheric Administration’s (NOAA’s) National Environment<br />
Satellite Data and Information Service (NESDIS; e.g. Hahn and Shukla, 1976), include uncertainties in<br />
determining areal snow coverage due to cloud contamination. As pointed out by Shinoda et al. (2001), there<br />
are considerable differences between the NOAA/NESDIS satellite data and ground-based snow depth data<br />
observations. However, relatively little documentation of snow-depth climatology and its physical process has<br />
been conducted until now. Thus, before discussing the snow–monsoon relationship, it is vital to reveal the<br />
snow-disappearance mechanism during the spring and early summer.<br />
On a decadal time scale, it is found that the snow extent for the spring season has exhibited a marked<br />
decreasing trend over central Eurasia during recent decades, in conjunction with global warming (Folland<br />
et al., 2001). In this context, the circulation mechanisms causing the snow cover variations should also be<br />
examined. The snow depth data used here consist of long-term observations, providing an opportunity to<br />
explore the decadal-scale changes.<br />
Therefore, the purpose of this study is first to reveal the climatological features of the spring snowdisappearance<br />
based on in situ snow depth data, and second to relate these features to the atmospheric<br />
circulation based on an objective analysis. These analyses are conducted on the time scale of a pentad<br />
to detect abrupt changes that often occur during the spring (Shinoda et al., 2001). Third, we investigate<br />
year-to-year variations in the snow mass in relation to the atmospheric circulation.<br />
2. DATA<br />
The dataset utilized in this study comprises the daily station data of snow depth, surface temperature<br />
and precipitation for the former Soviet Union (FSU), archived by the All Union Research Institute of<br />
Hydrometeorological Information in Obninsk for the period between 1966 and 1990. This dataset is the<br />
same as used in Shinoda et al. (2001) and Shinoda (2001). The total number of stations consists of 223 points<br />
covering the Eurasian continent broadly from 20 °E through to 140 °E north of 40 °N except for Mongolia and<br />
the northern part of China (see Figure 1). Because of a number of missing observations, the data after 1990<br />
are not used in the present analysis. The observations are made to 1 cm accuracies for the snow depth, 1 °C<br />
for the temperature and 1 mm for the precipitation.<br />
Also used are twice-daily (0000 and 1200 GMT) European Centre for Medium Range Weather Forecasts<br />
(ECMWF) reanalysis data between 1980 and 1990. The data contain horizontal winds (u, v), temperature T<br />
and vertical p-velocity ω defined at every 2.5° longitude by 2.5° latitude grid point over 17 vertical levels<br />
from 1000 to 10 hPa. Since the purpose of the present study is to reveal the detailed seasonal change process,<br />
we have used 5-day (pentad) averaged data for the analysis.<br />
Copyright © 2003 Royal Meteorological Society Int. J. Climatol. 23: 615–629 (2003)
EURASIAN SNOW COVER AND ATMOSPHERIC CIRCULATION 617<br />
Figure 1. Spatial distributions of climatological (a) snow-disappearance pentads, and (b) surface temperature of 0 °C between 1966 and<br />
1990. 223 observation stations are denoted by filled circles. Light shaded regions indicate April, and dark shaded regions correspond<br />
to May<br />
3. SNOW DISAPPEARANCE AND WARM ADVECTION<br />
To illustrate the seasonal changes in snow cover and its association with surface temperature, we present<br />
climatological pentad numbers for the snow disappearance timing and appearance of the surface air<br />
temperature 0 °C (Figure 1). Generally, the East Eurasian Plain (EEP) is lower than 200 m, except for the<br />
Copyright © 2003 Royal Meteorological Society Int. J. Climatol. 23: 615–629 (2003)
618 H. UEDA, M. SHINODA AND H. KAMAHORI<br />
Ural mountain range, whereas Mongolia and the adjacent area are characterized by high elevation in excess<br />
of 1000 m. In this study, we masked out these highly elevated regions in Figure 1. The snow begins to<br />
disappear from the southwestern part of the FSU and migrates in a northerly direction until May. Glancing<br />
at this figure, it is clear that the northward retreat is not zonally uniform. The advance of the snow boundary<br />
exhibits an abrupt change in April over the EEP between 50 and 60 °N. This region corresponds to the location<br />
that reveals high interannual variability of snow depth and a negative correlation with the Indian summer<br />
monsoon rainfall (Kripalani and Kulkarni, 1999; Shinoda et al., 2001). One can notice that the northward<br />
migration of the 0 °C isotherm (Figure 1(b)) precedes that of snow-disappearance (Figure 1(a)) by about 1 to<br />
5 pentads. The surface air temperature exceeds 0 °C widely between 50–60 °N over the EEP in late March<br />
(pentads 17 and 18). This is followed by the wide disappearance of the snow in April.<br />
As described previously, we regard the EEP as the significant key region for which land surface processes<br />
may influence the monsoon activity. Figure 2(a) displays the latitude–time sections of surface air temperature<br />
averaged over the longitudes over 30–60 °E. Also superimposed are the snow-disappearance pentads, denoted<br />
as a dashed line. In general, the snow disappearance lags behind the 0 °C isotherm by about 1 to 5 pentads.<br />
The rapid surface warming between late March and April seems to be closely associated with atmospheric<br />
circulation, as is seen in Figure 2(b). This figure shows the same section but for 850 hPa winds. Throughout<br />
the winter to spring season, westerly winds dominate over the EEP. As for the meridional wind, the southerly<br />
wind intrusion during March and April is concurrent with the abrupt surface warming seen in Figure 2(a). In<br />
order to investigate the stability of the atmospheric vertical profile, we have calculated the vertical gradient<br />
of potential temperature θ between 850 and 700 hPa. The computation was performed using the following<br />
formula:<br />
γ = (θ700 − θ850)<br />
(Z700 − Z850)<br />
This parameter is a useful indicator for the stability of the boundary layer associated with the snow cover,<br />
as was proposed by Shinoda et al. (2001). The smaller values of γ less than 4.5 K km −1 , associated with<br />
an unstable boundary layer, are found to occur during mid March (>55 °N) and April. The atmosphere<br />
becomes more unstable with regard to stratification nearer the summer season, which might be attributed to<br />
surface heating.<br />
Figure 3 provides a description of the monthly mean atmospheric circulation from March to May. The<br />
wind vectors at 850 hPa are plotted with the mean vertical gradient of potential temperature (shaded areas)<br />
to indicate conditional instability in the lower troposphere. During March, the northwesterly winds prevail<br />
to the east of 60 °E, where the vertical θ differences are larger (>5.0). In contrast, the northern part of the<br />
EEP between 30 and 60 °E is under the influence of southwesterlies. At this time, the vertical profile θ over<br />
the northern part of the EEP exhibits a more unstable condition (γ < 5), which may be caused by low-level<br />
warm advection due to the southwesterly winds. The small γ is also found for April to the south of 50 °N<br />
and for May to the south of 60 °N, which may be attributed to a land surface effect resulting from the snow<br />
disappearance. Of particular interest in May is that the southwesterlies over the EEP become weak and the<br />
westerlies to the east of 60 °E are replaced by vigorous northwesterly winds.<br />
Figure 4 shows the seasonal change of the large-scale vertical circulation averaged over the 30–60 °E<br />
meridians between March and May. The shaded area denotes southerly winds stronger than 1 m s −1 . During<br />
March, the northward intrusion of lower winds with an upward component can be found between the surface<br />
and 700 hPa over 55–70 °N. There appears to be only weak motions in the middle and upper troposphere.<br />
By April, the region to the south of 50 °N is dominated by southerly winds up to 200 hPa, and the area to the<br />
north of 50 °N is replaced by northerly winds. It should be emphasized here that the southerly wind intrusion<br />
is remarkable in spring, particularly in March and April, and the winds gradually retreat southward toward<br />
the summer season.<br />
Copyright © 2003 Royal Meteorological Society Int. J. Climatol. 23: 615–629 (2003)<br />
(1)
EURASIAN SNOW COVER AND ATMOSPHERIC CIRCULATION 619<br />
Figure 2. Latitude–time sections showing (a) mean (1966–90) seasonal evolution of the surface temperature (degrees Celsius)<br />
along a longitude of 30–60 °E. Thick black contour indicates surface temperature 0 °C. The dashed contour denotes climatological<br />
snow-disappearance pentads. (b) The same as in (a), except for 850 hPa horizontal wind obtained from ECMWF reanalysis (1980–90).<br />
The southerly wind component greater than 1 m s −1 is denoted by two-tone shadings. (c) The same as in (a), but for static stability γ<br />
between 850 and 700 hPa. Shading is region of γ less than 5.0 K km −1<br />
Copyright © 2003 Royal Meteorological Society Int. J. Climatol. 23: 615–629 (2003)
620 H. UEDA, M. SHINODA AND H. KAMAHORI<br />
Figure 3. Monthly mean distributions of horizontal wind vector at 850 hPa and static stability γ between 850 and 700 hPa. Shaded area<br />
denotes the region of γ less than 5.0 K km −1<br />
Copyright © 2003 Royal Meteorological Society Int. J. Climatol. 23: 615–629 (2003)
EURASIAN SNOW COVER AND ATMOSPHERIC CIRCULATION 621<br />
200<br />
300<br />
400<br />
500<br />
600<br />
700<br />
800<br />
900<br />
1000<br />
40N 45N 50N 55N 60N 65N 70N<br />
200<br />
300<br />
400<br />
500<br />
600<br />
700<br />
800<br />
900<br />
1000<br />
40N 45N 50N 55N 60N 65N 70N<br />
200<br />
300<br />
400<br />
500<br />
600<br />
700<br />
800<br />
900<br />
1000<br />
40N 45N 50N 55N 60N 65N 70N<br />
Figure 4. The 11-year mean (1980–90) pressure–latitude sections of meridional and vertical wind fields along a longitudinal sector<br />
averaged over 30–60 °E for (a) March, (b) April and (c) May. The shaded regions are southerly wind components greater than 1 m s −1<br />
Copyright © 2003 Royal Meteorological Society Int. J. Climatol. 23: 615–629 (2003)
622 H. UEDA, M. SHINODA AND H. KAMAHORI<br />
4.1. Seasonal evolution<br />
4. MEAN HEAT AND MOISTURE BUDGETS<br />
To examine more quantitatively the heating and moisture processes relevant to the snow disappearance<br />
over the EEP, we examine the atmospheric heat and moisture budgets. The advective, diabatic, and adiabatic<br />
heating estimates are obtained by the thermodynamic and moisture balance equations from a 12 h sequence<br />
of upper air data:<br />
∂T<br />
∂t<br />
∂q<br />
∂t<br />
<br />
RT<br />
= −V ·∇T + ω<br />
cpP<br />
∂q Q2<br />
= −V ·∇q − ω −<br />
∂p Lc<br />
<br />
∂T<br />
− +<br />
∂p<br />
Q1<br />
Cp<br />
where T is temperature, q is the mixing ratio of water vapour, V is the horizontal wind, ω is the vertical<br />
p-velocity, cp is the specific heat for dry air, and Lc the latent heat of condensation. Q1 and Q2 are called<br />
the apparent heat source and moisture sink respectively, because of possible contributions resulting from<br />
unresolved eddies associated with dry thermal convection and moist convection (Yanai et al., 1973).<br />
As shown by Yanai et al. (1973), vertically integrating Equations (2) and (3) from the tropopause pressure<br />
PT to the surface pressure Ps, we obtain<br />
where<br />
〈Q1〉 = 〈QR〉 + LcP + S (4)<br />
〈Q2〉 = Lc(P − E) (5)<br />
〈〉 = 1<br />
g<br />
Ps<br />
PT<br />
() dp (6)<br />
P, S, E and QR are respectively the precipitation rate, the sensible heat flux, the evaporation rate per unit<br />
area at the surface and the radiative heating rate.<br />
We compare the horizontal advection, vertical advection, and adiabatic heating terms averaged over the<br />
key region (30–60 °E, 45–60 °N) (Figure 5(a)). We recognize that the local warming over the EEP in March<br />
and April (thin solid line) is indeed the result of horizontal (meridional plus zonal) warm advection by<br />
southwesterly winds and, particularly in mid March, the adiabatic warming by descending air contributes,<br />
in part, to the local temperature increase. Then, the horizontal warm advection tends to decrease toward the<br />
summer season. The time series of the 〈Q1〉 and 〈Q2〉 (as expressed in Equations (2) and (3)) reveal drastic<br />
seasonal changes during April–May of the snow-disappearance timing (Figure 5). Prior to this period, a large<br />
amplitude of negative 〈Q1〉 is manifested during March through to early April, in conjunction with the course<br />
of marked snowmelt (Shinoda, 2001; Shinoda et al., 2001). This fact indicates that the heat, gained through the<br />
above-mentioned horizontal warm advection and adiabatic process, is largely used for the snowmelt through<br />
the sensible heat flux included in 〈Q1〉 (see Equation (4)). Aizen (2000) also pointed out that the advective<br />
energy is the same as the heat used for snowmelt in a central area of the EEP during early April, which<br />
coincides with our results. Their estimates of the heat consumed for snowmelt have amplitudes comparable<br />
to our 〈Q1〉 values. The EEP region reveals a moisture sink (a positive 〈Q2〉) between winter and the end<br />
of April, indicating snowfall. 〈Q2〉 values abruptly turn to negative from early May, which is concurrent<br />
with the enhanced surface evaporation, as will be found in Figure 7. The moisture advection terms changed<br />
in conjunction with those of the heat budget. Namely, the large meridional transport of water vapour is<br />
recognizable in April, whereas it decreases abruptly in May. These variations are closely associated with the<br />
northward advection of warm and moist air in April and the southward intrusion of cold and dry air in May.<br />
Copyright © 2003 Royal Meteorological Society Int. J. Climatol. 23: 615–629 (2003)<br />
(2)<br />
(3)
a)<br />
80<br />
60<br />
40<br />
20<br />
0<br />
-20<br />
-40<br />
-60<br />
-80<br />
b)<br />
20<br />
10<br />
0<br />
-10<br />
JAN<br />
JAN<br />
EURASIAN SNOW COVER AND ATMOSPHERIC CIRCULATION 623<br />
FEB MAR APR MAY JUN<br />
5 10 15 20<br />
[Wm -2 ]<br />
Q2<br />
zonal adv<br />
meridional adv<br />
adiabatic<br />
local change<br />
5 10 15 20<br />
pentad number<br />
Q1<br />
zonal adv<br />
meridional adv<br />
adiabatic<br />
local change<br />
25 30 35<br />
FEB MAR APR MAY JUN<br />
25 30 35<br />
Figure 5. Climatological (1980–90) time series of atmospheric vertically integrated (a) heat and (b) moisture budgets for the EEP<br />
(45–60 °N, 30–60 °E) in units of W m −2 . Diabatic heat source (Q1; thick line), zonal heat advection (−u∇T ; open circles), meridional<br />
heat advection (−v∇T ; filled circles), vertical advection plus adiabatic compression (ω∇T − ωRT /Cpp; dashed line) and local time<br />
change (∂T /∂t thin line) are shown. Moisture sink (Q2), zonal moisture advection (−u∇q; open circles), meridional moisture advection<br />
(−v∇q; filled circles), vertical moisture advection (ω∂q/∂p; dashed line) and local time change (∂q/∂t; thin line) are shown<br />
4.2. Vertical cross-sections<br />
Figure 6(a) shows the mean vertical distribution of the heating rate Q1/cp in the latitudinal plane along<br />
30–60 °E. Over the EEP region, an apparent cooling is dominant in the lower troposphere below 700 hPa,<br />
which is compensated by the advection heating (Figures, 6(b) and (c)) as well as the adiabatic heating<br />
Copyright © 2003 Royal Meteorological Society Int. J. Climatol. 23: 615–629 (2003)
624 H. UEDA, M. SHINODA AND H. KAMAHORI<br />
200<br />
300<br />
400<br />
500<br />
600<br />
700<br />
800<br />
900<br />
1000<br />
40N 45N 50N 55N 60N 65N 70N<br />
200<br />
300<br />
400<br />
500<br />
600<br />
700<br />
800<br />
900<br />
1000<br />
40N 45N 50N 55N 60N 65N 70N<br />
200<br />
300<br />
400<br />
500<br />
600<br />
700<br />
800<br />
900<br />
1000<br />
40N 45N 50N 55N 60N 65N 70N<br />
200<br />
300<br />
400<br />
500<br />
600<br />
700<br />
800<br />
900<br />
1000<br />
40N 45N 50N 55N 60N 65N 70N<br />
Figure 6. North–south vertical cross-sections during March and April over the EEP (30–60 °E) showing (a) heating rate (Q1/cp), (b)<br />
zonal advection, (c) meridional advection and (d) adiabatic component<br />
Copyright © 2003 Royal Meteorological Society Int. J. Climatol. 23: 615–629 (2003)
EURASIAN SNOW COVER AND ATMOSPHERIC CIRCULATION 625<br />
(Figure 6(d)). This heat balance was also observed in the time series of each component (Figure 5). The<br />
zonal (eastward) advection is a main component for the heating north of 60 °N, whereas the meridional<br />
(northward) advection is a dominant player south of 60 °N, including the key area in the EEP (Figure 5).<br />
These features are consistent with the atmospheric circulation fields (see Figure 4).<br />
We can also estimate the vertically integrated values of 〈LcE〉 as residuals of surface precipitation 〈LcP 〉<br />
minus 〈Q2〉 (see Equation (5)). Figure 7 shows the time series of calculated values of 〈LcE〉 and observed<br />
〈LcP 〉 for the key region. The estimated evaporation is relatively small in winter and gradually increases from<br />
April toward the summer season. Interestingly, the evaporation begins to exceed the precipitation in early<br />
May, following the snow-disappearance period over the EEP region. This suggests that the increased 〈LcE〉<br />
may reflect the wet soil conditions due to the addition of the melting snow. Recently, Suzuki et al. (1998)<br />
estimated the evaporation and vegetation activity over western Siberia (50–60 °N, 60–80E). They found that<br />
the evaporation increased abruptly from May toward the subsequent summer after snow disappearance. The<br />
absolute values of the evaporation are also consistent with our computed values.<br />
5. INTERANNUAL VARIATION<br />
Figure 8 shows the interannual variation of the snow-disappearance pentad for the key region between<br />
1966 and 1990. Positive values mean late snow-disappearance and negative values indicate early snowdisappearance.<br />
To reveal its spatial variations, we produced the map of differences in snow-disappearance<br />
timing in Figure 9. In this figure, large positive values are roughly located north of the Black Sea, around<br />
50 °N. There are also remarkable differences over the EEP region, whereas these signals are not found over<br />
the entire Eurasian continent. Shinoda et al. (2001) indicated that the year-to-year variations of snow field<br />
contain a mode having anomalies of opposite signs between the EEP and Siberian regions.<br />
To examine the relationship between the land surface conditions and snow boundaries in view of the<br />
interannual and seasonal time scales, the time–latitude section of the surface air temperature differences<br />
is displayed in Figure 10. We also superimposed the snow boundary lines for the early and late snowdisappearance<br />
years. In general, the surface temperature was lower between December and April for the late<br />
snow-disappearance years. Interestingly, this signal abruptly diminished in May and there was no remarkable<br />
difference during the summer season. This result is consistent with recent studies (Shen et al., 1998; Shinoda,<br />
2001; Shinoda et al., 2001). The surface air temperature anomalies prior to March are related to the snowmelting<br />
speeds and subsequent snow-disappearance timings. On the other hand, the temperature differences<br />
in April may be due, in part, to the land-surface conditions of snow cover or non-snow-cover. Another<br />
[Wm -2 ]<br />
E, P<br />
JAN<br />
80<br />
70<br />
60<br />
50<br />
40<br />
30<br />
20<br />
10<br />
0<br />
45-60N, 30-60E<br />
climate<br />
FEB MAR APR MAY JUN<br />
E(Era15)<br />
P(USSR)<br />
5 10 15 20 25 30 35<br />
pentad number<br />
Figure 7. Time series of estimated evaporation (solid line) and precipitation (dashed line) for the EEP (45–60 °N, 30–60 °E)<br />
Copyright © 2003 Royal Meteorological Society Int. J. Climatol. 23: 615–629 (2003)
626 H. UEDA, M. SHINODA AND H. KAMAHORI<br />
pentad<br />
1.5<br />
0.0<br />
-1.5<br />
Snow-disappearance Pentads<br />
66 67 68 69 70 71 72 73 74 75 76 77 78 79<br />
year<br />
anomaly (45-60N, 30-60E)<br />
80 81 82 83 84 85 86 87 88 89 90<br />
Figure 8. Year-to-year variations of snow-disappearance pentads anomalies for the EEP (45–60 °N, 30–60 °E)<br />
Figure 9. Composite difference of snow boundary between late-disappearance years (1979, 1980, 1987) minus early disappearance years<br />
(1975, 1983, 1990). Positive (negative) values mean slow (rapid) northward retreat of snow-cover extent<br />
interesting feature in Figure 10 is that differences of surface temperature between the extreme years are<br />
absent in February and early March, whereas they are much enhanced in mid winter and in late March and<br />
April. This might suggest a periodicity of atmospheric circulation patterns across the continent that may<br />
be associated with seasonal change of the so-called North Atlantic oscillation (Portis et al., 2001) or other<br />
atmospheric teleconnection patterns.<br />
In order to confirm the atmospheric conditions relevant to early snow-disappearance, we present the<br />
composite differences of vertically integrated meridional advection during March and April (Figure 11). Larger<br />
heating anomalies can be found to the northeast of the Black sea. This pattern resembles those found in the<br />
horizontal (meridional plus zonal) advection (not shown) and wind fields (Figure 3(a) and (b)). These results<br />
Copyright © 2003 Royal Meteorological Society Int. J. Climatol. 23: 615–629 (2003)
EURASIAN SNOW COVER AND ATMOSPHERIC CIRCULATION 627<br />
Figure 10. Latitude–time section of composite anomalies of the surface temperature between late years (1979, 1980, 1987) years minus<br />
early years (1975, 1983, 1990). Solid (dashed) line denotes poleward retreat of snow boundary for late (early) years. Light (dark)<br />
shading indicates temperature anomaly below −4 °C (−8 °C)<br />
Figure 11. Composite anomaly of vertical integrated meridional advection (W m −2 ) for March and April between late years (1979,<br />
1980, 1987) minus early years (1975, 1983, 1990)<br />
suggest that the enhanced advection of warm southwesterly air in the lower troposphere during the snowdecreasing<br />
phase of March and April is an important factor for the regulation of snow-disappearance timing.<br />
6. CONCLUSIONS AND DISCUSSIONS<br />
The seasonal and interannual features of snow-disappearance timing over the Eurasian continent and its<br />
relation to the surface temperature were investigated by using station data for the FSU between 1966 and<br />
Copyright © 2003 Royal Meteorological Society Int. J. Climatol. 23: 615–629 (2003)
628 H. UEDA, M. SHINODA AND H. KAMAHORI<br />
1990. In addition to this, the heat and moisture budgets were computed by use of twice-daily ECMWF<br />
reanalysis data for the period of 1980–90. The major results of the present study are summarized as follows:<br />
1. The springtime northward retreat of the snow boundary is about 0.4° in latitude per day over the EEP<br />
(30–60 °E), whereas the migrating speed is slower east of the Ural mountain range, at about 0.3° per<br />
day. The northward retreat of the snow boundary takes place following the appearance of surface air<br />
temperature 0 °C. In particular, the surface air temperature increases abruptly over the EEP during March.<br />
The northward shift of the 0 °C isotherm is very rapid in late March and early April, and is approximately<br />
1.0° in latitude per day.<br />
2. A pronounced northward intrusion of southwesterly winds in the lower troposphere occurs during March<br />
and April over the EEP region. Later in spring, the northwesterly winds in the lower troposphere replaced<br />
the southwesterlies and dominated north of 60 °N. The diabatic heating Ql over the northern part of the EEP<br />
(north of 60 °N) is characterized by a cooling concentrated in the lower layer. This is mainly compensated<br />
by the zonal warm advection due to westerlies and the adiabatic warming relevant to descending air. On<br />
the other hand, the southern part of the EEP is under the strong influence of meridional warm air advection.<br />
This warm advection nearly balances with the negative Ql, having a peak value of −0.8 K day −1 in the<br />
lower troposphere.<br />
3. The atmospheric moisture budget analyses showed that the evaporation began to exceed the condensation<br />
from early May, following the snow disappearance.<br />
4. The precursory signal of surface temperature anomalies can be found from December and persists until<br />
April, whereas the surface temperature anomalies diminish abruptly in May. It is worth noting that there<br />
are no significant anomalies in the subsequent summer. As for the atmospheric circulation for the early<br />
snow-disappearance years, the low-level warm air advection is enhanced during the snow-melting phase<br />
of March and April.<br />
The potentially important land–air interaction in the Eurasian continent has not been properly monitored<br />
and simulated by a coupled atmosphere–land model. In particular, the processes regulating the interannual<br />
variation of snow-cover extent and its connection with the previous tropospheric circulation have not been<br />
studied in detail. With this background in mind, the present study revealed that the winter–spring circulation<br />
(including the northward warm advection) anomalies control the spring snow-disappearance timing, and<br />
surface air temperature anomalies were attenuated as soon as snow-cover anomalies disappeared. This fact<br />
supports the previous findings that the land-surface anomalies over the study area might not be dynamically<br />
linked with the Indian monsoon activity (Shinoda, 2001; Shinoda et al., 2001).<br />
El Niño–southern oscillation (ENSO) has a vigorous impact on the change of mid-latitude westerly regimes<br />
(Yasunari and Seki, 1992). If the interannual variation of the snow-cover extent is closely linked to the<br />
tropospheric circulation, the modulation of the westerly jet due to the ENSO phenomenon may change the<br />
summer monsoon activity through land–atmosphere interaction. However, this snow–monsoon connection<br />
was not confirmed in the present study. On the other hand, many studies have shown that ocean–atmosphere<br />
interactions over the Indian Ocean play a significant role in the interannual variations of the Asian summer<br />
monsoon activities (e.g. Meehl, 1997; Kawamura, 1998). Recently, Kawamura et al. (2001) have revealed that<br />
the baroclinic Rossby wave response to tropical convective heating over the Indian Ocean, associated with<br />
ENSO, is found in the changes of tropospheric temperature over central Asia. This finding implies another<br />
mechanism regulating the Asian summer monsoon activity. Finally, it should be noted here that the station<br />
data for the FSU in the 1990s are not available at present. This decade exhibited some of the earliest snow<br />
disappearance of snow cover over the past century (Folland et al. 2001). Much research is needed in this area<br />
to further our understanding of the dynamics of snow-related thermal and hydrological processes and their<br />
relations to the westerly regimes and monsoon variability.<br />
ACKNOWLEDGEMENTS<br />
We would like to thank Masatake E. Hori for helpful discussions, and thank the reviewers for constructive<br />
comments and suggestions. Most of the figures are made using the GMT System (Wessel and Smith, 1991).<br />
Copyright © 2003 Royal Meteorological Society Int. J. Climatol. 23: 615–629 (2003)
EURASIAN SNOW COVER AND ATMOSPHERIC CIRCULATION 629<br />
REFERENCES<br />
Aizen. 2000. Heat exchange during snow ablation in plains and mountains of Eurasia. Journal of Geographical Research 105:<br />
27 013–27 022.<br />
Banzai AS, Shukla J. 1999. Relation between Eurasian snow cover, snow depth, and the Indian summer monsoon: an observational<br />
study. Journal of Climate 12: 3117–3132.<br />
Barnett TP, Schlese L, Dümenil U, Roeckner E, Latif M. 1989. The effect of Eurasian snow cover on regional and global climate<br />
variations. Journal of the Atmospheric Sciences 46: 661–685.<br />
Blanford HF. 1884. On the connexion of Himalayan snowfall and seasons of drought in India. Proceedings of the Royal Society of<br />
London 37: 3–22.<br />
Dickson RR. 1984. Eurasian snow cover versus Indian monsoon rainfall — an extension of the Hahn–Shukla results. Journal of Climate<br />
and Applied Meteorology 23: 171–173.<br />
Douville H, Royer J-F. 1996. Sensitivity of Asian summer monsoon to an anomalous Eurasian snow cover within the Météo-France<br />
GCM. Climate Dynamics 12: 449–466.<br />
Hahn DG, Shukla J. 1976. An apparent relationship between Eurasian snow cover and Indian monsoon rainfall. Journal of the<br />
Atmospheric Sciences 33: 2461–2462.<br />
Folland CK, Karl TR, Christy JR, Clarke RA, Gruza GV, Jouzel J, Mann ME, Oerlemans J, Salinges MJ, Wang S-W. 2001. Observed<br />
climate variability and change. In Climate Change 2001: The Scientific Basis, IPCC Third assessment Report, Houghton JT, Ding Y,<br />
Griggs DJ, Nogues M, van der Linden PJ, Dai x, Maskell K, Johnson CA (eds). Cambridge University Press: Cambridge; chapter 2.<br />
Kawamura R. 1998. A possible mechanism of the Asian summer monsoon–ENSO coupling. Journal of the Meteorological Society of<br />
Japan 76: 1009–1027.<br />
Kawamura R, Matsuura T, Iizuka S. 2001. Interannual atmosphere–ocean variations in the tropical western North Pacific relevant to<br />
the Asian summer monsoon–ENSO coupling. Journal of the Meteorological Society of Japan 79: 883–898.<br />
Kripalani RH, Kulkarni A. 1999. Climatology and variability of historical Soviet snow depth data: some new perspectives in<br />
snow–Indian monsoon teleconnection. Climate Dynamics 15: 475–489.<br />
Liu X, Yanai M. 2001. Relationships between the Indian monsoon rainfall and tropospheric temperature over the Eurasian continent.<br />
Quarterly Journal of the Royal Meteorological Society 127: 909–937.<br />
Meehl GA. 1997. The south Asian monsoon and tropospheric biennial oscillation. Journal of Climate 10: 1921–1943.<br />
Portis DH, Walsh JE, Hamly ME, Lamb PJ. 2001. Seasonality of the North Atlantic oscillation. Journal of Climate 14: 2069–2078.<br />
Shen X, Kimoto M, Sumi A. 1998. Role of land surface processes associated with interannual variability of broad-scale Asian summer<br />
monsoon as simulated by the CCSR/NIES AGCM. Journal of the Meteorological Society of Japan 76: 217–236.<br />
Shinoda M. 2001. Climate memory of snow mass as soil moisture over central Eurasia. Journal of Geographical Research 106:<br />
33 393–33 403.<br />
Shinoda M, Utsugi H, Morishima W. 2001. Spring-snow disappearance timing and its possible influence on temperature fields over<br />
central Eurasia. Journal of the Meteorological Society of Japan 79: 37–59.<br />
Suzuki R, Yatagai A, Yasunari T. 1998. Satellite-derived vegetation index and evapotranspiration estimated by using assimilated<br />
atmospheric data over Asia. Journal of the Meteorological Society of Japan 76: 1663–1671.<br />
Vernekar AD, Zhou J, Shukla J. 1995. The effect of Eurasian snow cover on Indian monsoon. Journal of Climate 8: 248–266.<br />
Wessel P, Smith WHF. 1991. Free software helps map and display data. EOS Transactions AGU, bf72 441: 445–446.<br />
Yanai M, Esbensen S, Chu J-H. 1973. Determination of bulk properties of tropical cloud clusters from large-scale heat and moisture<br />
budgets. Journal of the Atmospheric Sciences 30: 611–627.<br />
Yasunari T, Seki Y. 1992. Role of the Asian monsoon on the interannual variability of the global climate system. Journal of the<br />
Meteorological Society of Japan 70: 131–166.<br />
Yasunari T, Kitoh A, Tokioka T. 1991. Local and remote responses to excessive snow mass over Eurasia appearing in the northern<br />
spring and summer climate — a study with the MRI GCM. Journal of the Meteorological Society of Japan 69: 473–487.<br />
Zwiers FW. 1993. Simulation of the Asian summer monsoon with the CCC GCM-1. Journal of Climate 6: 470–486.<br />
Copyright © 2003 Royal Meteorological Society Int. J. Climatol. 23: 615–629 (2003)