Get PDF (2323K) - Wiley Online Library
Get PDF (2323K) - Wiley Online Library
Get PDF (2323K) - Wiley Online Library
Create successful ePaper yourself
Turn your PDF publications into a flip-book with our unique Google optimized e-Paper software.
622 H. UEDA, M. SHINODA AND H. KAMAHORI<br />
4.1. Seasonal evolution<br />
4. MEAN HEAT AND MOISTURE BUDGETS<br />
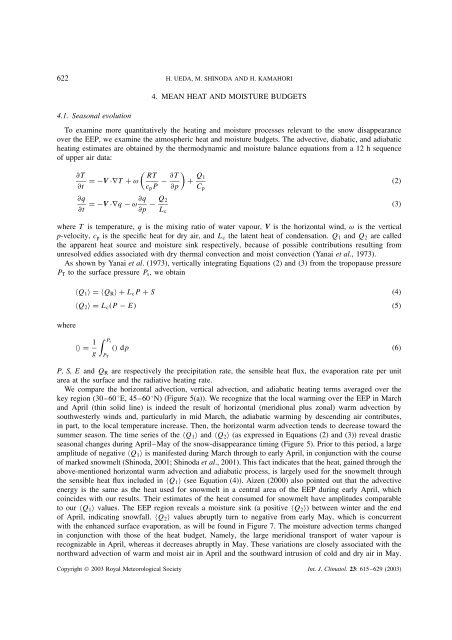
To examine more quantitatively the heating and moisture processes relevant to the snow disappearance<br />
over the EEP, we examine the atmospheric heat and moisture budgets. The advective, diabatic, and adiabatic<br />
heating estimates are obtained by the thermodynamic and moisture balance equations from a 12 h sequence<br />
of upper air data:<br />
∂T<br />
∂t<br />
∂q<br />
∂t<br />
<br />
RT<br />
= −V ·∇T + ω<br />
cpP<br />
∂q Q2<br />
= −V ·∇q − ω −<br />
∂p Lc<br />
<br />
∂T<br />
− +<br />
∂p<br />
Q1<br />
Cp<br />
where T is temperature, q is the mixing ratio of water vapour, V is the horizontal wind, ω is the vertical<br />
p-velocity, cp is the specific heat for dry air, and Lc the latent heat of condensation. Q1 and Q2 are called<br />
the apparent heat source and moisture sink respectively, because of possible contributions resulting from<br />
unresolved eddies associated with dry thermal convection and moist convection (Yanai et al., 1973).<br />
As shown by Yanai et al. (1973), vertically integrating Equations (2) and (3) from the tropopause pressure<br />
PT to the surface pressure Ps, we obtain<br />
where<br />
〈Q1〉 = 〈QR〉 + LcP + S (4)<br />
〈Q2〉 = Lc(P − E) (5)<br />
〈〉 = 1<br />
g<br />
Ps<br />
PT<br />
() dp (6)<br />
P, S, E and QR are respectively the precipitation rate, the sensible heat flux, the evaporation rate per unit<br />
area at the surface and the radiative heating rate.<br />
We compare the horizontal advection, vertical advection, and adiabatic heating terms averaged over the<br />
key region (30–60 °E, 45–60 °N) (Figure 5(a)). We recognize that the local warming over the EEP in March<br />
and April (thin solid line) is indeed the result of horizontal (meridional plus zonal) warm advection by<br />
southwesterly winds and, particularly in mid March, the adiabatic warming by descending air contributes,<br />
in part, to the local temperature increase. Then, the horizontal warm advection tends to decrease toward the<br />
summer season. The time series of the 〈Q1〉 and 〈Q2〉 (as expressed in Equations (2) and (3)) reveal drastic<br />
seasonal changes during April–May of the snow-disappearance timing (Figure 5). Prior to this period, a large<br />
amplitude of negative 〈Q1〉 is manifested during March through to early April, in conjunction with the course<br />
of marked snowmelt (Shinoda, 2001; Shinoda et al., 2001). This fact indicates that the heat, gained through the<br />
above-mentioned horizontal warm advection and adiabatic process, is largely used for the snowmelt through<br />
the sensible heat flux included in 〈Q1〉 (see Equation (4)). Aizen (2000) also pointed out that the advective<br />
energy is the same as the heat used for snowmelt in a central area of the EEP during early April, which<br />
coincides with our results. Their estimates of the heat consumed for snowmelt have amplitudes comparable<br />
to our 〈Q1〉 values. The EEP region reveals a moisture sink (a positive 〈Q2〉) between winter and the end<br />
of April, indicating snowfall. 〈Q2〉 values abruptly turn to negative from early May, which is concurrent<br />
with the enhanced surface evaporation, as will be found in Figure 7. The moisture advection terms changed<br />
in conjunction with those of the heat budget. Namely, the large meridional transport of water vapour is<br />
recognizable in April, whereas it decreases abruptly in May. These variations are closely associated with the<br />
northward advection of warm and moist air in April and the southward intrusion of cold and dry air in May.<br />
Copyright © 2003 Royal Meteorological Society Int. J. Climatol. 23: 615–629 (2003)<br />
(2)<br />
(3)


