The Use of Radar Remote Sensing for Identifying Environmental ...
The Use of Radar Remote Sensing for Identifying Environmental ...
The Use of Radar Remote Sensing for Identifying Environmental ...

You also want an ePaper? Increase the reach of your titles
YUMPU automatically turns print PDFs into web optimized ePapers that Google loves.
while preserving edges. Texture analysis was also<br />
carried out on the original images to extract in<strong>for</strong>mation<br />
about the variations in image tone.<br />
Image analysis was per<strong>for</strong>med using eCognition<br />
s<strong>of</strong>tware - a classification analysis package that uses<br />
an object-based approach rather than the traditional<br />
pixel-based routine. Image data is classified based on<br />
parcels <strong>of</strong> pixels known as ‘objects’ that are created<br />
using a segmentation routine, which separates<br />
significantly contrasted adjacent regions in an image<br />
based on image brightness values, and extracts the<br />
homogeneous regions as individual objects [1].<br />
Following segmentation, a classification was per<strong>for</strong>med<br />
using the multi-temporal filtered and texture analysis<br />
images as input. A standard nearest neighbour<br />
classification was per<strong>for</strong>med based on user-specified<br />
training objects. <strong>The</strong> resulting classification was<br />
validated with test sites.<br />
Classified polygons were extracted as GIS layers <strong>for</strong><br />
use in the malaria risk map generation procedure. <strong>The</strong><br />
premise <strong>for</strong> assessing areas at risk <strong>of</strong> malaria infection<br />
is based on the maximum distance a malaria-carrying<br />
mosquito can travel from its breeding ground to infect<br />
human hosts. For this study, a two-kilometre buffer<br />
zone around the classified larval breeding grounds was<br />
used [2] [3], and the wetland class was considered to<br />
be most conducive to larval breeding [4] [5] [6] [7]. With<br />
this in<strong>for</strong>mation, a risk map was generated to show the<br />
populated areas that lie within the two-kilometre buffer<br />
zone around the wetland areas.<br />
IV. RESULTS<br />
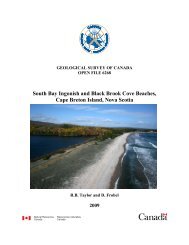
<strong>The</strong> resulting classification was assessed at 85.5%<br />
overall accuracy. Figure 1 shows the classification<br />
results <strong>for</strong> the populated areas. <strong>The</strong> town <strong>of</strong> Mombasa<br />
(island in south part <strong>of</strong> image) is clearly identified as<br />
populated, as well as smaller villages found in the<br />
middle part <strong>of</strong> the image. <strong>The</strong> bright radar backscatter<br />
response and textural in<strong>for</strong>mation allowed <strong>for</strong> accurate<br />
classification <strong>of</strong> the populated areas, at 93.2%.<br />
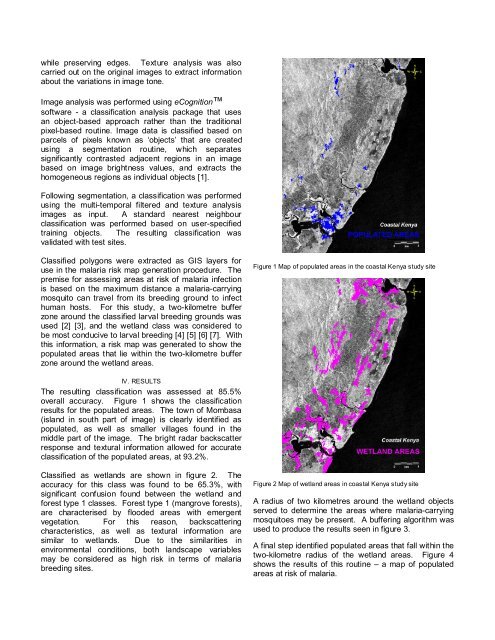
Classified as wetlands are shown in figure 2. <strong>The</strong><br />
accuracy <strong>for</strong> this class was found to be 65.3%, with<br />
significant confusion found between the wetland and<br />
<strong>for</strong>est type 1 classes. Forest type 1 (mangrove <strong>for</strong>ests),<br />
are characterised by flooded areas with emergent<br />
vegetation. For this reason, backscattering<br />
characteristics, as well as textural in<strong>for</strong>mation are<br />
similar to wetlands. Due to the similarities in<br />
environmental conditions, both landscape variables<br />
may be considered as high risk in terms <strong>of</strong> malaria<br />
breeding sites.<br />
Figure 1 Map <strong>of</strong> populated areas in the coastal Kenya study site<br />
Figure 2 Map <strong>of</strong> wetland areas in coastal Kenya study site<br />
A radius <strong>of</strong> two kilometres around the wetland objects<br />
served to determine the areas where malaria-carrying<br />
mosquitoes may be present. A buffering algorithm was<br />
used to produce the results seen in figure 3.<br />
A final step identified populated areas that fall within the<br />
two-kilometre radius <strong>of</strong> the wetland areas. Figure 4<br />
shows the results <strong>of</strong> this routine – a map <strong>of</strong> populated<br />
areas at risk <strong>of</strong> malaria.