You also want an ePaper? Increase the reach of your titles
YUMPU automatically turns print PDFs into web optimized ePapers that Google loves.
Financial Review<br />
Borrowings and capital<br />
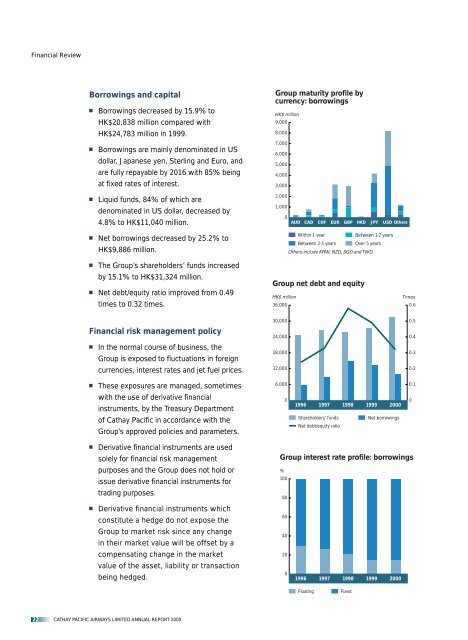
Borrowings decreased by 15.9% to<br />
HK$20,838 million compared with<br />
HK$24,783 million in 1999.<br />
Borrowings are mainly denominated in US<br />
dollar, Japanese yen, Sterling and Euro, and<br />
are fully repayable by 2016 with 85% being<br />
at fixed rates of interest.<br />
Liquid funds, 84% of which are<br />
denominated in US dollar, decreased by<br />
4.8% to HK$11,040 million.<br />
Net borrowings decreased by 25.2% to<br />
HK$9,886 million.<br />
The Group’s shareholders’ funds increased<br />
by 15.1% to HK$31,324 million.<br />
Net debt/equity ratio improved from 0.49<br />
times to 0.32 times.<br />
Financial risk management policy<br />
In the normal course of business, the<br />
Group is exposed to fluctuations in foreign<br />
currencies, interest rates and jet fuel prices.<br />
These exposures are managed, sometimes<br />
with the use of derivative financial<br />
instruments, by the Treasury Department<br />
of <strong>Cathay</strong> <strong>Pacific</strong> in accordance with the<br />
Group’s approved policies and parameters.<br />
Derivative financial instruments are used<br />
solely for financial risk management<br />
purposes and the Group does not hold or<br />
issue derivative financial instruments for<br />
trading purposes.<br />
Derivative financial instruments which<br />
constitute a hedge do not expose the<br />
Group to market risk since any change<br />
in their market value will be offset by a<br />
compensating change in the market<br />
value of the asset, liability or transaction<br />
being hedged.<br />
22 CATHAY PACIFIC AIRWAYS LIMITED ANNUAL REPORT <strong>2000</strong><br />
Group maturity profile by<br />
currency: borrowings<br />
HK$ million<br />
9,000<br />
8,000<br />
7,000<br />
6,000<br />
5,000<br />
4,000<br />
3,000<br />
2,000<br />
1,000<br />
0<br />
AUD<br />
CAD<br />
CHF<br />
EUR<br />
GBP<br />
HKD<br />
JPY<br />
USD Others<br />
Within 1 year<br />
Between 1-2 years<br />
Between 2-5 years Over 5 years<br />
Others include KRW, NZD, SGD and TWD.<br />
Group net debt and equity<br />
HK$ million Times<br />
36,000<br />
30,000<br />
24,000<br />
18,000<br />
12,000<br />
6,000<br />
0<br />
1996<br />
1997<br />
Shareholders’ funds<br />
Net debt/equity ratio<br />
1998<br />
1999<br />
<strong>2000</strong><br />
Net borrowings<br />
Group interest rate profile: borrowings<br />
%<br />
100<br />
80<br />
60<br />
40<br />
20<br />
0<br />
1996<br />
1997<br />
1998<br />
Floating Fixed<br />
1999<br />
<strong>2000</strong><br />
0.6<br />
0.5<br />
0.4<br />
0.3<br />
0.2<br />
0.1<br />
0


