
You also want an ePaper? Increase the reach of your titles
YUMPU automatically turns print PDFs into web optimized ePapers that Google loves.
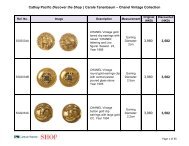
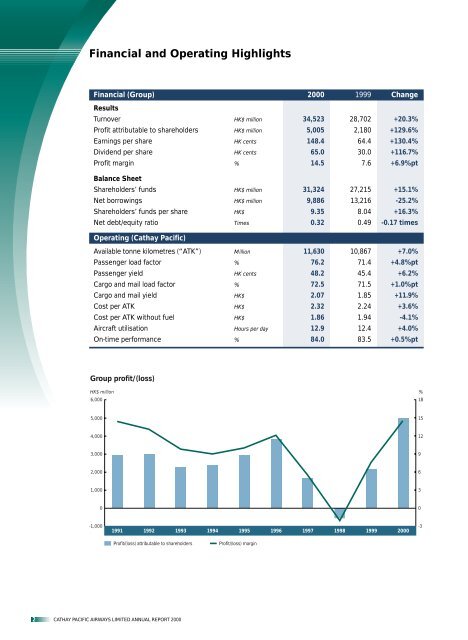
Financial and Operating Highlights<br />
Financial (Group) <strong>2000</strong> 1999 Change<br />
Results<br />
Turnover HK$ million 34,523 28,702 +20.3%<br />
Profit attributable to shareholders HK$ million 5,005 2,180 +129.6%<br />
Earnings per share HK cents 148.4 64.4 +130.4%<br />
Dividend per share HK cents 65.0 30.0 +116.7%<br />
Profit margin % 14.5 7.6 +6.9%pt<br />
Balance Sheet<br />
Shareholders’ funds HK$ million 31,324 27,215 +15.1%<br />
Net borrowings HK$ million 9,886 13,216 -25.2%<br />
Shareholders’ funds per share HK$ 9.35 8.04 +16.3%<br />
Net debt/equity ratio Times 0.32 0.49 -0.17 times<br />
Operating (<strong>Cathay</strong> <strong>Pacific</strong>)<br />
Available tonne kilometres (“ATK”) Million 11,630 10,867 +7.0%<br />
Passenger load factor % 76.2 71.4 +4.8%pt<br />
Passenger yield HK cents 48.2 45.4 +6.2%<br />
Cargo and mail load factor % 72.5 71.5 +1.0%pt<br />
Cargo and mail yield HK$ 2.07 1.85 +11.9%<br />
Cost per ATK HK$ 2.32 2.24 +3.6%<br />
Cost per ATK without fuel HK$ 1.86 1.94 -4.1%<br />
Aircraft utilisation Hours per day 12.9 12.4 +4.0%<br />
On-time performance % 84.0 83.5 +0.5%pt<br />
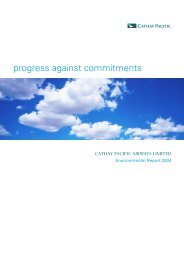
Group profit/(loss)<br />
HK$ million %<br />
6,000<br />
5,000<br />
4,000<br />
3,000<br />
2,000<br />
1,000<br />
0<br />
-1,000<br />
1991<br />
1992<br />
1993<br />
2 CATHAY PACIFIC AIRWAYS LIMITED ANNUAL REPORT <strong>2000</strong><br />
1994<br />
1995<br />
Profit/(loss) attributable to shareholders Profit/(loss) margin<br />
1996<br />
1997<br />
1998<br />
1999<br />
<strong>2000</strong><br />
18<br />
15<br />
12<br />
9<br />
6<br />
3<br />
0<br />
-3