
Create successful ePaper yourself
Turn your PDF publications into a flip-book with our unique Google optimized e-Paper software.
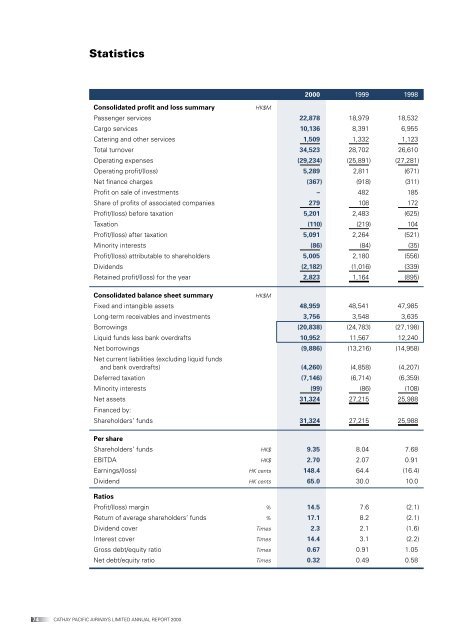
Statistics<br />
74 CATHAY PACIFIC AIRWAYS LIMITED ANNUAL REPORT <strong>2000</strong><br />
<strong>2000</strong> 1999 1998<br />
Consolidated profit and loss summary HK$M<br />
Passenger services 22,878 18,979 18,532<br />
Cargo services 10,136 8,391 6,955<br />
Catering and other services 1,509 1,332 1,123<br />
Total turnover 34,523 28,702 26,610<br />
Operating expenses (29,234) (25,891) (27,281)<br />
Operating profit/(loss) 5,289 2,811 (671)<br />
Net finance charges (367) (918) (311)<br />
Profit on sale of investments – 482 185<br />
Share of profits of associated companies 279 108 172<br />
Profit/(loss) before taxation 5,201 2,483 (625)<br />
Taxation (110) (219) 104<br />
Profit/(loss) after taxation 5,091 2,264 (521)<br />
Minority interests (86) (84) (35)<br />
Profit/(loss) attributable to shareholders 5,005 2,180 (556)<br />
Dividends (2,182) (1,016) (339)<br />
Retained profit/(loss) for the year 2,823 1,164 (895)<br />
Consolidated balance sheet summary HK$M<br />
Fixed and intangible assets 48,959 48,541 47,985<br />
Long-term receivables and investments 3,756 3,548 3,635<br />
Borrowings (20,838) (24,783) (27,198)<br />
Liquid funds less bank overdrafts 10,952 11,567 12,240<br />
Net borrowings<br />
Net current liabilities (excluding liquid funds<br />
(9,886) (13,216) (14,958)<br />
and bank overdrafts) (4,260) (4,858) (4,207)<br />
Deferred taxation (7,146) (6,714) (6,359)<br />
Minority interests (99) (86) (108)<br />
Net assets 31,324 27,215 25,988<br />
Financed by:<br />
Shareholders’ funds 31,324 27,215 25,988<br />
Per share<br />
Shareholders’ funds HK$ 9.35 8.04 7.68<br />
EBITDA HK$ 2.70 2.07 0.91<br />
Earnings/(loss) HK cents 148.4 64.4 (16.4)<br />
Dividend HK cents 65.0 30.0 10.0<br />
Ratios<br />
Profit/(loss) margin % 14.5 7.6 (2.1)<br />
Return of average shareholders’ funds % 17.1 8.2 (2.1)<br />
Dividend cover Times 2.3 2.1 (1.6)<br />
Interest cover Times 14.4 3.1 (2.2)<br />
Gross debt/equity ratio Times 0.67 0.91 1.05<br />
Net debt/equity ratio Times 0.32 0.49 0.58