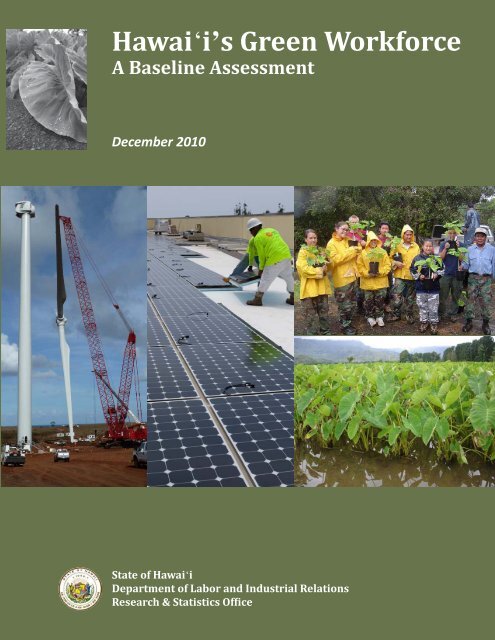
Hawai i's Green Workforce A Baseline Assessment December 2010
Hawai i's Green Workforce A Baseline Assessment December 2010
Hawai i's Green Workforce A Baseline Assessment December 2010

You also want an ePaper? Increase the reach of your titles
YUMPU automatically turns print PDFs into web optimized ePapers that Google loves.
<strong>Hawai</strong>ÿi’s <strong>Green</strong> <strong>Workforce</strong><br />
A <strong>Baseline</strong> <strong>Assessment</strong><br />
<strong>December</strong> <strong>2010</strong><br />
State of <strong>Hawai</strong>ÿi<br />
Department of Labor and Industrial Relations<br />
Research & Statistics Office
State of <strong>Hawai</strong>‘i<br />
NEIL ABERCROMBIE, GOVERNOR<br />
Department of Labor and Industrial Relations<br />
Dwight Takamine, Interim Director<br />
Audrey Hidano, Deputy Director<br />
Research & Statistics Office<br />
Francisco P. Corpuz, Chief<br />
Jeffrey Matsu, Lead Researcher<br />
Anders Corr<br />
Robin Komoto<br />
Ryan Morita<br />
www.<strong>Green</strong>Jobs<strong>Hawai</strong>i.org • DLIR.RS.<strong>Green</strong>Jobs<strong>Hawai</strong>i@hawaii.gov • (808)586-8999
Table of Contents<br />
List of Exhibits 4<br />
Acknowledgements 5<br />
Executive Summary 7<br />
Introduction 8<br />
Methodology 10<br />
Current <strong>Green</strong> Jobs 14<br />
<strong>Green</strong> Job Vacancies 23<br />
<strong>Green</strong> Jobs Projected in 2012 27<br />
Qualifications and Employee Training Requirements 38<br />
<strong>Green</strong> Practices 42<br />
Conclusion 47<br />
References 49<br />
Appendix A: Methodological Details 50<br />
Appendix B: NAICS in Sample 55<br />
Appendix C: <strong>Green</strong> Job Occupations 65<br />
Appendix D: Survey Instrument 69
List of Exhibits<br />
TABLES<br />
1. <strong>Green</strong> Jobs by Core Area and County . . . . . 14<br />
2. <strong>Green</strong> Jobs by Core Area and Industry . . . . 14<br />
3. <strong>Green</strong> Jobs by County . . . . . . . . . . . . . 15<br />
4. <strong>Green</strong> Jobs by Industry and County . . . . . . 16<br />
5. Top Industries for <strong>Green</strong> Jobs . . . . . . . . . 17<br />
6. Top Industries for <strong>Green</strong> Jobs by County . . . 17<br />
7. <strong>Green</strong> Jobs by Worksite Size . . . . . . . . . 18<br />
8. Top <strong>Green</strong> Occupations and<br />
SOC Characteristics . . . . . . . . . . . . . . 21<br />
9. Top Occupational Groups with <strong>Green</strong> Jobs . . 22<br />
10. <strong>Green</strong> Job Vacancies by County<br />
and Worksite Size . . . . . . . . . . . . . . . 23<br />
11. <strong>Green</strong> Job Vacancies by County<br />
and Industry . . . . . . . . . . . . . . . . . . 23<br />
12. Top 25 <strong>Green</strong> Job Vacancies by<br />
SOC Major Groups: <strong>2010</strong> . . . . . . . . . . 264<br />
13. <strong>Green</strong> Job Projections by County<br />
and Industry: 2012 . . . . . . . . . . . . . . . 29<br />
14. Growth in <strong>Green</strong> Jobs by County<br />
and Industry: <strong>2010</strong>-2012. . . . . . . . . . . . 30<br />
15. <strong>Green</strong> Job Projections by County<br />
and Worksite Size: 2012 . . . . . . . . . . . . 32<br />
16. Growth in <strong>Green</strong> Jobs by County<br />
and Worksite Size: <strong>2010</strong>-2012 . . . . . . . . . 32<br />
17. <strong>Green</strong> Job Projections by<br />
Occupation: 2012 . . . . . . . . . . . . . . . 34<br />
18. Top 25 <strong>Green</strong> Occupations by<br />
Growth: <strong>2010</strong>-2012 . . . . . . . . . . . . . . 35<br />
19. <strong>Green</strong> Practices by County<br />
and Worksite Size, Share of Total . . . . . . . 43<br />
20. <strong>Green</strong> Practices by Industry, Share of Total . . 45<br />
21. Sample Size by Industry . . . . . . . . . . . . 51<br />
FIGURES<br />
1. <strong>Green</strong> Labor Life Cycle . . . . . . . . . . . . . 9<br />
2. Statistical Sampling Methodology. . . . . . . 13<br />
3. <strong>Green</strong> Jobs by Core Area and Worksite Size . 15<br />
4. Total Employment by County . . . . . . . . . 15<br />
5. <strong>Green</strong> Jobs by County . . . . . . . . . . . . . 15<br />
6. Total Employment by Worksite Size. . . . . . 18<br />
7. <strong>Green</strong> Job Vacancies by County . . . . . . . . 23<br />
8. <strong>Green</strong> Job Vacancies as a Share of Total<br />
Unemployment. . . . . . . . . . . . . . . . . 23<br />
9. <strong>Green</strong> Job Vacancies by Core Areas<br />
and County . . . . . . . . . . . . . . . . . . 24<br />
10. <strong>Green</strong> Job Vacancies by Core Areas<br />
and Worksite Size . . . . . . . . . . . . . . . 25<br />
11. <strong>Green</strong> Jobs by Core Area: 2012 . . . . . . . . 27<br />
12. <strong>Green</strong> Job Growth by County: <strong>2010</strong>-2012. . . 27<br />
13. Growth in <strong>Green</strong> Jobs by Industry:<br />
<strong>2010</strong>-2012 . . . . . . . . . . . . . . . . . . . 28<br />
14. <strong>Green</strong> Job Projections by Industry: 2012 . . . 31<br />
15. Absolute Growth in <strong>Green</strong> Jobs by<br />
Worksite Size: <strong>2010</strong>-2012 . . . . . . . . . . . 32<br />
16. Percent Growth in <strong>Green</strong> Jobs by<br />
Worksite Size: <strong>2010</strong>-2012 . . . . . . . . . . . 32<br />
17. Formal <strong>Green</strong> Training. . . . . . . . . . . . . 38<br />
18. On-the-Job <strong>Green</strong> Training . . . . . . . . . . 38<br />
19. Projected Growth Rate of Top-Five <strong>Green</strong><br />
Occupations by Education: <strong>2010</strong>-2012 . . . . 40<br />
20. <strong>Green</strong> Practices per Worksite . . . . . . . . . 42<br />
BOX ITEMS<br />
1. What is the NAICS? . . . . . . . . . . . . . . 12<br />
2. What is the SOC? . . . . . . . . . . . . . . . 19<br />
3. The Depth and Breadth of <strong>Green</strong> Jobs:<br />
Janitors, Cleaners, and Security Guards . . . . 20<br />
4. New and Emerging <strong>Green</strong> Occupation:<br />
Sustainability Specialist . . . . . . . . . . . . 30<br />
5. Industry Focus: Wind Energy . . . . . . . . . 33<br />
6. <strong>Green</strong> Finance: Innovation Spurs Clean<br />
Energy Projects . . . . . . . . . . . . . . 36-37<br />
7. Leadership in Energy & Environmental<br />
Design (LEED) . . . . . . . . . . . . . . . . 39<br />
8. <strong>Green</strong> Certification. . . . . . . . . . . . . . . 44
Acknowledgements<br />
The authors would like to acknowledge support from Francisco Corpuz, Chief of the DLIR Research<br />
& Statistics Office. James Hardway and the <strong>Workforce</strong> Development Council provided a coordinating<br />
role throughout the grant’s procurement and implementation. Peter Quigley at the University of <strong>Hawai</strong>ÿi<br />
Community Colleges, Michael Hamnett at the Research Corporation of the University of <strong>Hawai</strong>ÿi, and<br />
members of the <strong>Green</strong> <strong>Workforce</strong> Intelligence Network (GWIN), <strong>Hawai</strong>ÿi Department of Business, Economic<br />
Development and Tourism (DBEDT), <strong>Workforce</strong> Development Division, and Local <strong>Workforce</strong> Investment<br />
Boards provided expertise and insights.<br />
Katalina McGlone made significant contributions to survey design, statistical sampling and data collection.<br />
Albert Tou, Sarah Goodale, and Ed Robison from the US Bureau of Labor Statistics shared useful insights in<br />
sampling methodology, as did staff from statistical agencies in states such as Washington, Oregon, California,<br />
and Michigan. Casey Cho and James Doi were instrumental with website and database design. Phyllis<br />
Dayao assisted with the report’s graphical design and layout. Naomi Harada, Holly Nagamine, Allen Choy,<br />
Marc Fabian, Vicki Lau, Jeri Arucan, Jeri Sato, Deana Boswell, Anna Powell, Stan Fichtman, Phyllis Dayao,<br />
Lisa Langit, LoriAnn Nishigaya-Chung, Shannon Lee, and Victor Gong provided assistance during the data<br />
collection phase of the survey.<br />
There are numerous other stakeholders in both the public and private sectors that helped make this report<br />
possible, and we thank them collectively for their invaluable feedback and guidance at critical stages throughout<br />
the project.<br />
Lastly, a very big “thank you” goes to the thousands of <strong>Hawai</strong>ÿi businesses that participated in this inaugural<br />
survey.<br />
This report is intended for educational and informational purposes. References to specific products, services or<br />
companies are for illustrative purposes only, and do not reflect an endorsement by the State of <strong>Hawai</strong>ÿi or DLIR.<br />
Unless specified within this report, all data and analysis should be sourced as “State of <strong>Hawai</strong>ÿi, Department of<br />
Labor and Industrial Relations, Research & Statistics Office, ‘<strong>Hawai</strong>ÿi’s <strong>Green</strong> <strong>Workforce</strong> Report, <strong>2010</strong>’”.<br />
<strong>Hawai</strong>ÿi’s <strong>Green</strong> <strong>Workforce</strong>: A <strong>Baseline</strong> <strong>Assessment</strong> 5
State of <strong>Hawai</strong>ÿi: County Profiles<br />
KAUAÿI<br />
460 green jobs<br />
1.9% of county jobs<br />
71 additional green<br />
jobs by 2012<br />
OÿAHU<br />
6,866 green jobs<br />
2.0% of county jobs<br />
1,885 additional green<br />
jobs by 2012<br />
6 <strong>Hawai</strong>ÿi’s <strong>Green</strong> <strong>Workforce</strong>: A <strong>Baseline</strong> <strong>Assessment</strong><br />
MAUI<br />
2,597 green jobs<br />
4.6% of county jobs<br />
437 additional green<br />
jobs by 2012<br />
HAWAIÿI<br />
1,222 green jobs<br />
2.5% of total jobs<br />
510 additional green<br />
jobs by 2012
Executive Summary<br />
This report provides a comprehensive framework for assessing green jobs in the private sector of the State of<br />
<strong>Hawai</strong>ÿi. Survey responses, from a stratified random sample of all <strong>Hawai</strong>ÿi businesses, provided data on 4,008<br />
worksites for the first quarter of <strong>2010</strong>. This represents a 44 percent overall response rate.<br />
<strong>Green</strong> jobs are defined as those that engage in at least one of five core green areas: (1) Generate clean,<br />
renewable, sustainable energy; (2) Reduce pollution and waste, conserve natural resources, recycle; (3) Energy<br />
efficiency; (4) Education, training and support of a green workforce; and (5) Natural, environmentally-friendly<br />
production.<br />
Key findings include:<br />
• <strong>Green</strong> jobs in the private sector of <strong>Hawai</strong>’i are estimated at 11,145, which accounts for 2.4 percent of<br />
total private employment. <strong>Green</strong> jobs are identified in 203 occupations across 19 major industry groups.<br />
Sixty-five percent of <strong>Hawai</strong>ÿi’s green jobs are found in three major industries – Construction, Professional<br />
Services, and Administrative & Support, Waste Management & Remediation Services. Five occupations —<br />
Janitors & Cleaners, Forest & Conservation Technicians, Security Guards, Electricians, and Heating & Air<br />
Conditioning Mechanics & Installers — account for 28 percent of the green workforce.<br />
• Current green job vacancies are estimated at 670, which represent 1.5 percent of <strong>Hawai</strong>ÿi’s total<br />
unemployment. Nearly three-quarters of these vacancies occur in three industries – Construction,<br />
Agriculture and Professional Services.<br />
• Businesses anticipate green employment to grow faster than the overall labor market in <strong>Hawai</strong>ÿi. Between<br />
<strong>2010</strong> and 2012, employer worksites project the number of green jobs to increase by 26 percent to<br />
14,048, accounting for 2.9 percent of total employment. Occupations expected to experience the most<br />
growth in green jobs during this period are solar and insulation technicians. All counties report an increase<br />
in the number of green jobs by 2012, with Oÿahu projecting the largest number (1,885 new green jobs) and<br />
<strong>Hawai</strong>ÿi County the highest rate of growth (42 percent).<br />
• Community colleges and trade schools fulfill 62 percent of the education and training requirements<br />
for reported green jobs. The Leadership in Energy and Environmental Design (LEED) certification is the<br />
most commonly cited qualification.<br />
• Businesses report an average of 3.5 green practices per worksite, with the largest numbers found in<br />
Maui and Kauaÿi counties. Recycling, use of recycled products, and energy-saving light bulbs are the most<br />
common practices. Over 90 percent of worksites report at least one green practice.<br />
<strong>Hawai</strong>ÿi’s <strong>Green</strong> <strong>Workforce</strong>: A <strong>Baseline</strong> <strong>Assessment</strong> 7
Introduction<br />
Context for the <strong>Hawai</strong>‘i <strong>Green</strong> Jobs Survey<br />
<strong>Hawai</strong>‘i experiences unique challenges in transitioning<br />
from a State that is 90 percent dependent on imported<br />
oil to one that meets the <strong>Hawai</strong>‘i Clean Energy<br />
Initiative (HCEI) vision of being 70 percent reliant on<br />
renewable energy by 2030. Promulgated in June 2009,<br />
the HCEI aims to bring together business leaders,<br />
policy makers and a civil society committed to leading<br />
<strong>Hawai</strong>‘i to energy independence. The HCEI focuses<br />
on two primary objectives to meet this aggressive<br />
energy independence goal:<br />
Conserve: Use What We Need Efficiently<br />
• Commit to a more energy-efficient lifestyle in<br />
our homes and on the road.<br />
• Establish energy-efficient building codes and<br />
lower energy use at work and in our schools.<br />
Convert: Harness What We Have Wisely<br />
• Stop building fossil fuel plants.<br />
• Generate 40 percent of energy locally by 2030.<br />
• Harness energy from solar, wind, ocean,<br />
geothermal, and biomass resources.<br />
• Establish a sustainable alternative-fuel strategy.<br />
• Modernize the power-grid system. 1<br />
The Department of Labor and Industrial Relations<br />
(DLIR) has actively sought to become a more<br />
effective partner in this endeavor. Recognizing the<br />
rapidly evolving needs of the clean energy sector and<br />
the limitations of existing labor market information<br />
(LMI), <strong>Hawai</strong>‘i was one of several states selected<br />
by the US Department of Labor’s Employment<br />
& Training Administration to receive an LMI<br />
Improvement Grant funded through the American<br />
Recovery and Reinvestment Act (ARRA). It is this<br />
funding that made possible the data collection and<br />
subsequent assessment of the inaugural <strong>Hawai</strong>‘i <strong>Green</strong><br />
Jobs Survey (“Survey”).<br />
1 www.<strong>Hawai</strong>iCleanEnergyInitiative.org<br />
8 <strong>Hawai</strong>ÿi’s <strong>Green</strong> <strong>Workforce</strong>: A <strong>Baseline</strong> <strong>Assessment</strong><br />
Photo courtesy of Tom Burke<br />
To support the State’s efforts to help build a workforce<br />
with the skills necessary to compete for green jobs,<br />
the DLIR conducted a statistical survey of <strong>Hawai</strong>‘i<br />
businesses over a two-month period, May to July<br />
<strong>2010</strong>. The purpose of this Survey was three-fold,<br />
to: (1) estimate the number of jobs that significantly<br />
contribute to environmental protection or preservation;<br />
(2) identify the occupations involved with the<br />
emerging green economy; and (3) identify the training<br />
needs of a green workforce. Businesses were also<br />
asked to provide information on their green practices,<br />
irrespective of whether or not green jobs were<br />
reported.<br />
This Survey addresses three programmatic areas: (1)<br />
collection of data necessary to guide the planning of<br />
training programs for the short-term skills needed<br />
for emerging green industries; (2) development<br />
of LMI tools and enhancements that facilitate<br />
the reemployment of an increasing number of<br />
displaced workers; and (3) assistance to clean energy<br />
stakeholders to understand the capacity of the State’s<br />
LMI system and its central role in building a skilled<br />
work force.<br />
To develop a more comprehensive picture of the<br />
greening economy and workforce, we employed
a survey that was supplemented with analysis of<br />
LMI and other resources. This initiative relies on<br />
the support and feedback of a <strong>Green</strong> <strong>Workforce</strong><br />
Intelligence Network (GWIN), a collaborative and<br />
expandable consortium of government, industry and<br />
education representatives, which builds upon the<br />
statewide Energy Sector Work Group for <strong>Workforce</strong><br />
Development. Given <strong>Hawai</strong>‘i ’s unique isolation<br />
from other energy and grid systems, labor markets,<br />
and education and workforce development systems,<br />
the GWIN steering committee consulted regularly<br />
with counterparties in other states and regions<br />
regarding issues, best practices and innovations in<br />
workforce development and LMI. Throughout the<br />
implementation phase of the Survey, an industry and<br />
LMI user-driven improvement process has been a<br />
strategic consideration.<br />
While a general understanding of what is meant by<br />
“green jobs” and a “green workforce” permeates<br />
various discussion forums, there is no widely accepted<br />
standard definition. To address this deficiency, the<br />
Survey provides parameters defining occupations<br />
and economic activities that qualify for inclusion.<br />
This working definition formed an objective basis<br />
for measuring the current number of green jobs, the<br />
qualifications and training necessary to compete for<br />
these positions, the green practices employers have<br />
adopted, and the trends that are shaping the industry.<br />
Responses from all businesses were later vetted by a<br />
staff panel with a voting procedure to ensure overall<br />
compliance. While no approach is absolute, adherence<br />
to a well-defined and consistent definition is needed<br />
for a more transparent interpretation of the data.<br />
Survey data form the basis of the baseline estimation<br />
presented in this report. From a functional<br />
perspective, the DLIR will use this as a benchmark in<br />
two related areas, to: (1) project future employment<br />
in green jobs at the 2, 5 and 10-year horizons; and (2)<br />
form a skills-gap assessment 2 focusing on training<br />
capacity and demographic characteristics, including<br />
the skills of existing and potential green workers.<br />
The baseline generated from this analysis will also<br />
2 A skills-gap assessment seeks to address the disparity between<br />
a worker’s current skills and those required to fill a green job<br />
through education and vocational training.<br />
underscore future data collection and labor market<br />
research that track green jobs and their respective<br />
industries. Policy makers, business leaders and the<br />
public can utilize this “green” intelligence to help<br />
guide their strategic decision-making in areas such as<br />
investment, education and workforce development.<br />
Practical applications from this baseline assessment<br />
are broad and far-reaching. Career counselors<br />
and other service providers rely on industry and<br />
occupation-based data to meet the needs of different<br />
clients, from displaced engineers who require training<br />
in green applications to lower-skilled job-seekers<br />
who require basic training to obtain entry-level jobs<br />
in the green sector. Information on green jobs and<br />
the requisite skills companies seek when filling them<br />
can also be used by leaders in the field of education<br />
to better identify relevant degrees, certifications and<br />
training programs. Universities, community colleges,<br />
and trade and vocational schools are important<br />
partners in bridging job-seekers and employers with<br />
innovative programs and curricula that address the<br />
needs of a rapidly evolving green economy. Within<br />
this context, the private sector becomes a vested<br />
stakeholder by providing the demand for a pool of<br />
skilled workers to grow its businesses. The education<br />
sector, in turn, generates revenue from expanded<br />
services (Figure 1). Such symbiosis spurs activity and<br />
innovation in the broader economy.<br />
Ultimately, the <strong>Hawai</strong>‘i <strong>Green</strong> Jobs Survey aims to lay<br />
the foundation upon which future initiatives can be<br />
built. Rather than being a terminus, it is the starting<br />
point from which the State of <strong>Hawai</strong>‘i can structure<br />
future endeavors that facilitate the expansion of green<br />
industries across the islands.<br />
Figure 1. <strong>Green</strong> Labor Life Cycle<br />
<strong>Hawai</strong>ÿi’s <strong>Green</strong> <strong>Workforce</strong>: A <strong>Baseline</strong> <strong>Assessment</strong> 9
Methodology<br />
Defining <strong>Green</strong> Jobs<br />
There is no standard definition of what constitutes<br />
a “green” job. At the national level, the US Bureau<br />
of Labor Statistics (BLS) recently released what it<br />
considers to be a final definition of green jobs based<br />
upon public comments solicited during a six-month<br />
period, March to September <strong>2010</strong>. According to<br />
this definition, “green jobs are either: (1) jobs in<br />
businesses that produce goods or provide services<br />
that benefit the environment or conserve natural<br />
resources, or (2) jobs in which workers’ duties involve<br />
making their establishment’s production processes<br />
more environmentally friendly or use fewer natural<br />
resources.” 3 The BLS will apply this definition for<br />
data collection beginning in FY 2011.<br />
Meanwhile, many states have already completed or<br />
are currently undertaking surveys to measure green<br />
jobs and related economic activity. Policy direction<br />
and objectives specific to each state ultimately<br />
determine the scope of what is considered green,<br />
but the <strong>Workforce</strong> Information Council (WIC), a<br />
consortium of state and federal statistical agencies,<br />
has proposed its own working definition: “A green<br />
job is one in which the work is essential to products<br />
or services that improve energy efficiency, expand the<br />
use of renewable energy, or support environmental<br />
sustainability.” 4<br />
In designing this survey and conducting its analyses,<br />
the DLIR sought a definition that was neither overly<br />
specific to be exclusionary nor so broad as to make<br />
it not useful. Given the nascence in data collection<br />
related to this area of the economy, and a recognition<br />
that an understanding of green jobs is in many ways<br />
shaped by the results of an initial assessment, we<br />
chose to supplement a broad definition with a vetting<br />
procedure. This approach provided a framework for<br />
3 Federal Register, Vol. 75, No. 182.<br />
4 <strong>Workforce</strong> Information Council <strong>Green</strong> Jobs Study Group, Final<br />
Report, October 2009.<br />
10 <strong>Hawai</strong>ÿi’s <strong>Green</strong> <strong>Workforce</strong>: A <strong>Baseline</strong> <strong>Assessment</strong><br />
Photo Courtesy of 21st Century Technologies <strong>Hawai</strong>ÿi<br />
the design of a robust scientific survey instrument and<br />
sampling procedure.<br />
We define five core areas as green:<br />
¾ Generate clean, renewable, sustainable energy<br />
¾ Reduce pollution and waste; conserve natural<br />
resources; recycle<br />
¾ Energy efficiency<br />
¾ Educational, training and support of a green<br />
workforce<br />
¾ Natural, environmental-friendly production<br />
For the purposes of this report, we consider a green<br />
job to be one that engages in economic activity that<br />
makes a positive impact on the environment or energy<br />
sustainability, either on a full- or part-time basis.<br />
• Generate Clean, Renewable, Sustainable<br />
Energy refers to jobs in research, development,<br />
production, storage and distribution, and<br />
maintenance of energy (electricity and fuel) from<br />
renewable resources such as solar, wind, hydro,<br />
geothermal, ocean, and biofuels. Clean energy<br />
must have a positive net energy yield, relatively<br />
reduce greenhouse gas emissions, and be produced<br />
and distributed in a sustainable and safe manner.
• Reduce Pollution and Waste refers to the<br />
prevention and control of commercial,<br />
transportation and industrial emissions and<br />
pollution; environmental cleanup; water treatment;<br />
and waste product management and treatment.<br />
Conserve natural resources refers to managing<br />
water and other finite resources more effectively.<br />
This includes land management, sustainable<br />
forestry and wildlife conservation. Recycling<br />
refers to re-use of materials in the production<br />
process. This area includes companies that collect<br />
aluminum, paper, glass, and other recyclable<br />
materials.<br />
• Energy Efficiency refers to reducing the amount<br />
of energy used to produce a unit of output. These<br />
jobs refer to the production, construction and<br />
installation of energy-efficient products, such as<br />
Energy Star appliances and more efficient lighting.<br />
This category also includes jobs related to bicycles<br />
and public transportation, and energy-efficiency<br />
services such as retrofitting and weatherization of<br />
buildings.<br />
• Education, Training and Support of <strong>Green</strong><br />
<strong>Workforce</strong> refers to the provision of services<br />
to the other four green areas. This category<br />
includes activities to increase public awareness<br />
of environmental issues, activities to develop<br />
and enforce environmental regulations, and the<br />
provision of training in green technologies and<br />
practices to develop <strong>Hawai</strong>‘i’s green workforce.<br />
• Natural, Sustainable, Environmentally-Friendly<br />
Production refers to practices that reduce<br />
the environmental impact resulting from the<br />
production of any good or service. Included<br />
are alternative methods for production, and<br />
products that require less energy, emit fewer<br />
greenhouse gases or otherwise reduce impact on<br />
the environment. Examples are net-zero energy<br />
buildings that use solar panels or photovoltaic<br />
cells, and businesses that generate energy from<br />
recycling waste created during a manufacturing<br />
process.<br />
Support staff positions are included as green jobs<br />
only when a business is 100 percent green. When<br />
a job containing green responsibilities is performed<br />
on a part-time basis, it is considered green whenever<br />
that responsibility occurs on a recurring basis. This<br />
recognizes that many green functions may be of a<br />
secondary or tertiary nature.<br />
Broadly considered, a distinction is made between jobs<br />
that are simply performed outdoors or with nature and<br />
those that significantly contribute to environmental<br />
protection or preservation. For example, professions<br />
such as groundskeepers, landscapers and tree<br />
trimmers are considered green only if a portion of<br />
their regular responsibilities is ostensibly green, such<br />
as composting. Lawn maintenance and soil tilling<br />
alone would not suffice. Alternatively, a pest-control<br />
technician who provides a green alternative using<br />
organic or bio-friendly chemicals would be considered<br />
green.<br />
Other examples of green jobs include: (1)<br />
in manufacturing, a chemist who produces<br />
environmentally-sound packaging, equipment and<br />
cleaning products that are less caustic than traditional<br />
products; (2) in construction, a worker who produces<br />
or installs green building materials such as alternative<br />
cement and manufactured wood products made from<br />
scraps, or a consultant who provides green building<br />
design and construction services; (3) in agriculture,<br />
a technician who installs smart irrigation systems, a<br />
farmer who uses organic and sustainable methods,<br />
or a biologist who researches alternative pest control<br />
methods; and (4) in materials, a product designer or<br />
engineer who develops biodegradable products, or<br />
a chemical engineer who researches a new chemical<br />
catalyst to decompose waste and reduce toxins<br />
naturally.<br />
<strong>Green</strong> practices are not equivalent to green jobs.<br />
While green practice data was collected in the Survey,<br />
it is reported separately and includes responses from<br />
all worksites, regardless of whether a green job is<br />
reported.<br />
For example, worksites that use recycled toner<br />
cartridges and paper, or food service establishments<br />
that recycle cans and bottles, are practitioners of<br />
green practices but do not fit the definition of green<br />
jobs unless they fulfill one of the five core areas noted<br />
above. Moreover, if an economic activity is known to<br />
be environmentally harmful, then any job associated<br />
directly with it would not be classified as green.<br />
<strong>Hawai</strong>ÿi’s <strong>Green</strong> <strong>Workforce</strong>: A <strong>Baseline</strong> <strong>Assessment</strong> 11
Statistical Sampling<br />
The data presented here is based on a survey<br />
conducted from May to July <strong>2010</strong> of a stratified<br />
random sample of 9,146 worksites drawn from the<br />
Quarterly Census of Employment and Wages (QCEW)<br />
database. The QCEW contains data on approximately<br />
37,674 private <strong>Hawai</strong>‘i worksites that report to the<br />
State’s Unemployment Insurance Division.<br />
To ensure a representative sample, the State<br />
Department of Labor and Industrial Relations (DLIR)<br />
mailed the survey to a stratified random sample of<br />
the QCEW, including all four counties – Honolulu<br />
(O‘ahu), <strong>Hawai</strong>’i, Maui, and Kaua‘i. O‘ahu accounts<br />
for about two-thirds of all QCEW worksites, so the<br />
first level of stratification was by county (Figure 2).<br />
Within each county, a cross-section of employers was<br />
randomly selected such that small (1-9 employees),<br />
medium (10-49 employees) and large worksites (50<br />
or more employees) would be represented. In order<br />
to obtain complete data on worksites with potentially<br />
very large numbers of green employees, all large<br />
worksites were sampled. This decreased the variance<br />
in our random sample of small and medium-sized<br />
worksites, thus increasing the power of the sample.<br />
The sample was further stratified to reflect a crosssection<br />
of industries, including traditional industries<br />
and those thought likely to have a large representation<br />
of green jobs. All 19 private sectors in the North<br />
American Industry Classification System (NAICS, see<br />
inset) were randomly sampled. Public Administration<br />
(NAICS 92) was not sampled, but we plan to include<br />
the public sector in the future.<br />
Survey Response and Estimation<br />
Businesses could respond to the survey via internet,<br />
mail, fax, or telephone within a ten-day period of the<br />
deadline. (Businesses that mailed responses prior<br />
to a ten-day grace period following the deadline are<br />
referred to as Wave 1). Based on this criterion, 2,285<br />
surveys were received, yielding an initial response<br />
rate of 25 percent. An aggressive follow-up strategy<br />
12 <strong>Hawai</strong>ÿi’s <strong>Green</strong> <strong>Workforce</strong>: A <strong>Baseline</strong> <strong>Assessment</strong><br />
What is the NAICS?<br />
The North American Industry Classification System<br />
(NAICS) is a system for classifying establishments<br />
by type of economic activity for statistical purposes.<br />
Its purposes are: (1) to facilitate the collection,<br />
tabulation, presentation, and analysis of data relating<br />
to establishments, and (2) to promote uniformity and<br />
comparability in the presentation and analysis of<br />
statistical data describing the economy.<br />
NAICS is used by federal statistical agencies that<br />
collect or publish data by industry. It is also widely<br />
used by State agencies, trade associations, private<br />
businesses, and other organizations. At the heart of<br />
NAICS is a production-based concept of classification;<br />
that is, NAICS classifies each establishment into a<br />
detailed industry based in the production processes<br />
it uses. The NAICS system provides five levels of<br />
classification on detailed codes that have a maximum<br />
of six digits. The classification levels are Sector,<br />
Subsector, Industry Group, NAICS Industry, and U.S.<br />
Industry.<br />
This report focuses on data analysis at the Sector<br />
(2-digit NAICS) level. Including Government (which<br />
is not included herein), there are 20 Sectors in NAICS.<br />
Source: U.S. Office of Management and Budget, Executive<br />
Office of the President.<br />
was pursued with non-responders, which yielded an<br />
additional 1,723 responses (Wave 2). This brought<br />
the total survey response to 4,008 of the original 9,146<br />
sampled worksites, or a final response rate of 43.8<br />
percent.<br />
Upon examination of the data, non-response bias was<br />
detected between Wave 1 and Wave 2 responders.<br />
To address this bias, a logistic regression was used<br />
to estimate propensity scores for prediction of likely<br />
responders and non-responders within the unsampled<br />
data. In the final estimation procedure, Wave 1<br />
sample weights were increased to estimate the number<br />
of green jobs for likely responders, and likewise,<br />
the weight of Wave 2 sample data was increased to<br />
estimate the number of green jobs for likely nonresponders.<br />
This method yields an unbiased estimate<br />
of total green jobs.
Figure 2. Statistical Sampling Methodology<br />
<strong>Hawai</strong>ÿi’s <strong>Green</strong> <strong>Workforce</strong>: A <strong>Baseline</strong> <strong>Assessment</strong> 13
Current <strong>Green</strong> Jobs<br />
<strong>Green</strong> Jobs by Core Areas<br />
There are an estimated 11,145 green jobs in <strong>Hawai</strong>i<br />
for the first quarter of <strong>2010</strong>, composing 2.4 percent of<br />
total private sector employment.<br />
<strong>Green</strong> jobs are classified into five core areas. These<br />
areas are defined based on how a particular green job<br />
best makes a positive impact on the environment or<br />
energy sustainability. Table 1 shows the number of<br />
green jobs estimated for each of these core areas with<br />
respect to geographic location.<br />
Table 1. <strong>Green</strong> Jobs by Core Area and County<br />
Table 2. <strong>Green</strong> Jobs by Core Area and Industry<br />
14 <strong>Hawai</strong>ÿi’s <strong>Green</strong> <strong>Workforce</strong>: A <strong>Baseline</strong> <strong>Assessment</strong><br />
Photo Courtesy of Kauaÿi County Recycling<br />
At the state level of aggregation, the largest core area<br />
of green employment is Reduce Pollution & Waste;<br />
Conserve Natural Resources; Recycle. Forty percent
of green jobs in the State are associated with this<br />
type of green activity. The second leading core area<br />
is Energy Efficiency, with 23 percent of green jobs.<br />
The next largest areas are Natural Environmentally-<br />
Friendly Production with approximately one in five<br />
green jobs, Generate Clean, Renewable, Sustainable<br />
Energy with 11 percent of green jobs, and Education,<br />
Training, and Support of a <strong>Green</strong> <strong>Workforce</strong>, which<br />
accounts for only about 7 percent of green jobs.<br />
At the county level, Reducing Pollution, Conservation,<br />
and Recycling is the leading category for O‘ahu<br />
(50 percent), Kaua‘i (43 percent) and <strong>Hawai</strong>‘i (36<br />
percent), while in Maui, Natural Environmentally-<br />
Friendly Production accounts for 53 percent of all<br />
green jobs.<br />
Most green jobs in medium and large worksites are<br />
in the Reducing Pollution category, at 44 percent and<br />
43 percent, respectively. Meanwhile, the core area<br />
of Energy Efficiency accounted for one-third of green<br />
jobs reported by small worksites, followed by Reduce<br />
Pollution at 28 percent (Figure 3).<br />
The largest number of green jobs is in the Reduce<br />
Pollution core area (Table 2), but there are a<br />
few notable exceptions in certain industries. In<br />
Agriculture, 62 percent of green jobs are categorized<br />
in the Natural Production area, while in the Utilities<br />
sector, 51 percent are in Generate Energy and 29<br />
percent are in Reduce Pollution. Energy Efficiency<br />
is the leading core area for Professional, Scientific<br />
and Technical Services (59 percent) and Construction<br />
employment (38 percent).<br />
<strong>Green</strong> Jobs by County<br />
Based on survey data, green jobs represent 2.4 percent<br />
of total employment in the State of <strong>Hawai</strong>‘i. With the<br />
exception of Maui, the share of total jobs reported as<br />
green by each county did not differ markedly from the<br />
Table 3. <strong>Green</strong> Jobs by County<br />
Figure 3. <strong>Green</strong> Jobs by Core Area and Worksite Size<br />
Figure 4. Total Employment by County<br />
Figure 5. <strong>Green</strong> Jobs by County<br />
<strong>Hawai</strong>ÿi’s <strong>Green</strong> <strong>Workforce</strong>: A <strong>Baseline</strong> <strong>Assessment</strong> 15
Table 4. <strong>Green</strong> Jobs by Industry and County<br />
16 <strong>Hawai</strong>ÿi’s <strong>Green</strong> <strong>Workforce</strong>: A <strong>Baseline</strong> <strong>Assessment</strong>
Table 5. Top Industries for <strong>Green</strong> Jobs<br />
statewide figure (Table 3). While the share of green<br />
jobs in other counties is within the range of 1.9 percent<br />
to 2.5 percent, Maui reported an outsized 4.6 percent.<br />
Maui accounts for 12 percent of the State’s total<br />
employment, yet its green jobs comprise 23 percent<br />
of the State’s total. Meanwhile, Kaua‘i and <strong>Hawai</strong>‘i<br />
counties’ share of total and green jobs relative to the<br />
State are comparable. In Kaua‘i, this equates to four<br />
percent of green and five percent of total jobs in the<br />
State. <strong>Hawai</strong>‘i County has 11 percent for both green<br />
and total jobs. In contrast, O‘ahu supports 62 percent<br />
of the State’s green jobs, against a 72 percent share of<br />
total employment (Figure 4 and Figure 5). Kaua‘i’s<br />
green jobs as a share of total jobs are the smallest at<br />
1.9 percent.<br />
Table 6. Top Industries for <strong>Green</strong> Jobs by County<br />
<strong>Green</strong> Jobs by Industry<br />
Construction is the fifth-largest private-industry sector<br />
as of the fourth quarter of 2009. Not coincidentally,<br />
Construction has the largest number of green jobs<br />
at 3,327, or 30 percent of the State’s total green jobs<br />
(Table 4 and Table 5). <strong>Green</strong> jobs represent 11 percent<br />
of that industry’s total employment. Construction led<br />
in O‘ahu and <strong>Hawai</strong>‘i, reporting 2,246 and 488 green<br />
jobs, respectively (Table 4). Over one of every eight<br />
Construction jobs in <strong>Hawai</strong>‘i County is green.<br />
The next largest industries with green jobs are in<br />
Administrative & Support & Waste Management<br />
& Remediation Services (ASWMRS); Professional,<br />
Scientific, & Technical Services; Wholesale Trade;<br />
and Retail Trade. Seventy-percent of all green jobs<br />
are concentrated within these five industries. While<br />
O‘ahu County reported the largest number of green<br />
<strong>Hawai</strong>ÿi’s <strong>Green</strong> <strong>Workforce</strong>: A <strong>Baseline</strong> <strong>Assessment</strong> 17
Table 7. <strong>Green</strong> Jobs by Worksite Size<br />
jobs in ASWMRS, Maui holds a disproportionately<br />
larger share of its green work force in this industry<br />
(Table 4).<br />
Given Oÿahu’s large number of technical and research<br />
institutions, a disproportionate share of its green jobs<br />
are in the Professional, Scientific & Technical Services<br />
industry, at 11 percent versus eight percent for the<br />
State (Table 6).<br />
In contrast to other counties, Maui has most of its<br />
green jobs in the Administrative and Support and<br />
Waste Management and Remediation Services sector.<br />
This sector includes 1,219 green jobs (Table 6),<br />
which makes 28 percent of the total sector in Maui<br />
green. Maui worksites reported the greatest number<br />
of green jobs in this sector as: Janitors and Cleaners,<br />
Landscaping and Groundskeeping Workers, Recycling<br />
and Reclamation Workers, Pest Control Workers,<br />
Commercial Divers, Sales Representatatives, Ship<br />
and Boat Captains, Environmental Science and<br />
Protection Technicians, Energy Engineers, and Retail<br />
Salespersons.<br />
Relative to other counties, <strong>Hawai</strong>‘i County has a<br />
large number of green jobs in Agriculture, Forestry,<br />
Fishing, & Hunting. In this industry, the county is<br />
estimated to have 183 green jobs, which accounts for<br />
15 percent of its green workforce and eight percent of<br />
its total employment (Table 6).<br />
Despite reporting fewer green jobs overall, Kaua‘i<br />
supports a relatively significant number in Arts,<br />
Entertainment and Recreation when compared to other<br />
counties and the State. Kaua‘i reports over 87 green<br />
jobs in this industry, which represents 19 percent of its<br />
green workforce and approximately 9 percent of the<br />
sector’s total employment within the county (Table 6).<br />
18 <strong>Hawai</strong>ÿi’s <strong>Green</strong> <strong>Workforce</strong>: A <strong>Baseline</strong> <strong>Assessment</strong><br />
Figure 6. Total Employment by Worksite Size<br />
<strong>Green</strong> Jobs by Worksite Size<br />
To report at the county level, it was necessary that the<br />
Survey query businesses based on the actual location<br />
of its employees whenever possible. Worksites were<br />
categorized as small (1-9 employees), medium (10-49<br />
employees) or large (50+ employees).<br />
Large employer worksites comprise over half of total<br />
employment, yet only one-third of green jobs are at<br />
the biggest employers (Table 7). In contrast, mediumsize<br />
worksites have the greatest number and share of<br />
total green jobs at 42 percent. Both medium and small<br />
worksites report a greater share of green jobs relative<br />
to total employment despite a less prominent role in<br />
the overall labor market (Figure 6). According to<br />
Survey estimates, 3.2 percent of total employment at<br />
medium and 3.7 percent of total employment at small<br />
worksites is green compared to just 1.5 percent at<br />
large worksites (Table 7).<br />
<strong>Green</strong> Jobs by Occupation<br />
Survey data estimate 11,145 green jobs in the State<br />
of <strong>Hawai</strong>’i. These jobs are distributed across 203<br />
occupations and classified under the Standard<br />
Occupational Classification (see inset).<br />
The SOC system reflects 23 major groups 5 . In the<br />
5 US Office of Management & Budget, Standard Occupational<br />
Classification Manual <strong>2010</strong>.
<strong>Hawai</strong>‘i <strong>Green</strong> Jobs Survey, green jobs were found<br />
to be represented in all but one group, Military<br />
Specific Occupations. We identify job titles with<br />
fifty or more reported green jobs, and the top five<br />
major occupational groups (Table 8 and Table 9).<br />
Construction and Extraction reports the largest<br />
number of green jobs, which at 2,690 jobs is 61<br />
percent larger than that of the second largest sector,<br />
Building and Grounds Cleaning and Maintenance.<br />
As reflected in the job titles associated with these<br />
occupational groups, many are skilled trades such as<br />
electricians, heating and air conditioner mechanics,<br />
and forest and conservation technicians. Some of<br />
these are quite new to the labor market, such as<br />
Sustainability Specialists. The Sales and Related<br />
category features jobs that facilitate the sales and<br />
distribution of green products and services.<br />
The depth and breadth of green jobs is thoughtprovoking.<br />
While there are occupations such as solar<br />
photovoltaic installers, recycling and reclamation<br />
workers, environmental science and protection<br />
technicians, and hazardous materials removal<br />
workers that are tasked with predominantly green<br />
responsibilities, others are far less so. Occupations<br />
that are green on occasion include architects,<br />
electricians and plumbers.<br />
Based on our working definition, a green job does<br />
not require its primary function or responsibility to<br />
be green. In many cases, the provisioning of a green<br />
good or service can be limited to a more secondary or<br />
tertiary role. Moreover, these jobs appear throughout<br />
the economy in occupations that are not routinely<br />
associated with green activity, such as with janitors<br />
and security guards (see inset article). Our survey<br />
data indicates that there are very few jobs dedicated<br />
entirely to environmental preservation or energy<br />
sustainability.<br />
While the SOC provides a useful conceptual<br />
framework for categorizing the assortment of reported<br />
job titles, it may limit the identification of new or<br />
emerging green occupations. Based on a multi-stage<br />
screening process, however, no new job titles were<br />
identified among survey responses. Furthermore, there<br />
did not appear to be an overt inclination for businesses<br />
to over-report green jobs; any potential overestimation<br />
was minimized with follow-up interviews.<br />
Wage data were beyond the scope of this survey, but<br />
for informational purposes these are reported by major<br />
What is the SOC?<br />
The Standard Occupational Classification (SOC)<br />
system is used by federal statistical agencies to<br />
classify workers into occupational categories<br />
for the purpose of collecting, calculating or<br />
disseminating data. All workers are classified into<br />
one of 840 detailed occupations according to their<br />
occupational definition.<br />
To facilitate classification, detailed occupations<br />
are combined to form 461 broad occupations,<br />
97 minor groups and 23 major groups. Detailed<br />
occupations in the SOC with similar job duties,<br />
and in some cases skills, education and/or training,<br />
are grouped together.<br />
This report focuses on data analysis at the detailed<br />
occupational level, although some data at the<br />
major group level will be reported as well.<br />
Source: U.S. Office of Management and Budget, Executive<br />
Office of the President.<br />
SOC occupational group based on the Occupational<br />
Employment Survey (Table 8). To identify more<br />
promising job opportunities, growth projections are<br />
also provided on this basis.<br />
<strong>Hawai</strong>ÿi’s <strong>Green</strong> <strong>Workforce</strong>: A <strong>Baseline</strong> <strong>Assessment</strong> 19
The Depth and Breadth of <strong>Green</strong> Jobs:<br />
Janitors, Cleaners and Security Guards<br />
<strong>Hawai</strong>ÿi’s unique combination of industries, natural assets and environmentally-aware population<br />
leads to some surprising conclusions with regard to the large number of janitors, cleaners and security<br />
guards considered “green”. Job title descriptions submitted by businesses to the <strong>Hawai</strong>ÿi <strong>Green</strong> Jobs<br />
Survey provide evidence of an emerging industry of janitors, cleaners and security guards that are<br />
making a significant contribution to green practices and employment in the State of <strong>Hawai</strong>ÿi. The SOC<br />
occupational groups of Janitors & Cleaners and Security Guards are among the Survey’s top-five green<br />
occupations when measured in total numbers (Table 8).<br />
While tourism is not classified as a NAICS industry, this broad services-based sector spans several<br />
major industry groups which collectively employ a large number of local workers. According to<br />
our research, a growing number of cleaning providers have incorporated eco-friendly products as a<br />
significant feature of their services. This has been coupled with the provisioning of extensive employee<br />
training and certification in areas such as water conservation, recycling and proper waste disposal.<br />
Given the principal and recurring nature of these responsibilities in such cases, this report treats these<br />
two occupations – janitors and cleaners – as green jobs and lists them under the core green area of<br />
Natural, Sustainable and Environmentally-Friendly Production. Based on survey data, of the estimated<br />
13,250 janitors and cleaners in <strong>Hawai</strong>ÿi, nine percent undergo special green training. These credentials<br />
are actively marketed by both employers and employees.<br />
While the majority of security guards are tasked with protecting real estate, capital assets and public<br />
safety, an increasing number are also responsible for pollution deterrence, environmental regulation<br />
enforcement and the safeguarding of hazardous materials from the general public. As a result, select<br />
positions within the Security Guard occupational group can be categorized under the core green area<br />
of Reduce Pollution and Waste; Conserve Our Natural Resources; Recycle. Based on this definition,<br />
survey data estimate that 5.4 percent of the 10,250 security guards in <strong>Hawai</strong>ÿi are green.<br />
One respondent to the Survey, a security company, notes clients with special “green” requirements.<br />
For example, a landfill hires security guards to monitor the quantity of dust pollution, and notify<br />
management when mitigation measures are required. This landfill also requires that the security<br />
guards check truck compliance with solid waste rules, such as regulations against dumping hazardous<br />
materials. Furthermore, the security guards limit the number of trucks so that the facility does not<br />
exceed its capacity. Other examples are piers and shippers. Security guards at these sites report to<br />
facility safety officers, following established protocols to monitor the water and containers for toxic<br />
spills and broken safety equipment that could lead to spills. The security guards also check hazardous<br />
materials documentation on the piers, which includes individual safety papers and the correct placarding<br />
of containers. In the event of a spill or other accident, these workers are responsible for cooperating<br />
with the coast guard to quickly staunch the flow and mitigate damages. According to a representative<br />
of this company, “I think green security guards will only increase, because people really care about that<br />
stuff now.”<br />
20 <strong>Hawai</strong>ÿi’s <strong>Green</strong> <strong>Workforce</strong>: A <strong>Baseline</strong> <strong>Assessment</strong>
Table 8. Top <strong>Green</strong> Occupations and Related SOC Characteristics<br />
<strong>Hawai</strong>ÿi’s <strong>Green</strong> <strong>Workforce</strong>: A <strong>Baseline</strong> <strong>Assessment</strong> 21
Table 9. Top Occupational Groups with <strong>Green</strong> Jobs<br />
22 <strong>Hawai</strong>ÿi’s <strong>Green</strong> <strong>Workforce</strong>: A <strong>Baseline</strong> <strong>Assessment</strong>
<strong>Green</strong> Job Vacancies<br />
Vacancies by County<br />
Survey data estimate 670 green job vacancies in the<br />
State of <strong>Hawai</strong>’i. With its significant job base relative<br />
to other counties, O‘ahu accounts for well over<br />
half of these green vacancies, followed by <strong>Hawai</strong>’i,<br />
Maui and Kaua‘i (Figure 7). Total green vacancies<br />
across counties represent about 1.5 percent of total<br />
unemployment in the State in the first quarter of <strong>2010</strong>.<br />
<strong>Hawai</strong>‘i County reports the largest share of green job<br />
vacancies when compared to overall unemployment<br />
(Figure 8). Relative to other counties, <strong>Hawai</strong>‘i has the<br />
potential to employ a disproportionately larger share<br />
of its inactive workforce in green occupations.<br />
Figure 7. <strong>Green</strong> Job Vacancies by County<br />
Table 10. <strong>Green</strong> Job Vacancies by County & Worksite Size<br />
Workers at Kahuku Wind Project. Photo Courtesy of First Wind.<br />
Vacancies by Industry and Worksite Size<br />
When examining green job vacancies by NAICS<br />
industry, we find that over 74 percent are concentrated<br />
among three major industry groups: (1) Construction,<br />
(2) Agriculture, Forestry, Fishing, and Hunting, and<br />
(3) Professional, Scientific & Technical Services.<br />
O‘ahu and Maui counties held the most vacancies<br />
in Construction, while <strong>Hawai</strong>‘i and Kaua‘i reported<br />
likewise in Agriculture, Forestry, Fishing, and<br />
Hunting and Administrative & Support & Waste<br />
Figure 8. <strong>Green</strong> Vacancies as a Share of Total<br />
Unemployment<br />
<strong>Hawai</strong>ÿi’s <strong>Green</strong> <strong>Workforce</strong>: A <strong>Baseline</strong> <strong>Assessment</strong> 23
Table 11. <strong>Green</strong> Job Vacancies by County and Industry<br />
24 <strong>Hawai</strong>ÿi’s <strong>Green</strong> <strong>Workforce</strong>: A <strong>Baseline</strong> <strong>Assessment</strong><br />
Vacancies<br />
Industry Sector <strong>Hawai</strong>’i Kaua’i Maui O’ahu Total<br />
Construction 18 3 61 192 273<br />
Agriculture, Forestry, Fishing, & Hunting 117 3 0 4 124<br />
Professional, Scientific, & Technical Services 1 0 0 95 97<br />
Other Services 51 3 2 0 56<br />
Administrative & Support & Waste Mgmt & Remediation Services 10 4 7 21 42<br />
Wholesale Trade 0 1 0 33 34<br />
Utilities 0 0 3 12 15<br />
Manufacturing 2 0 6 6 14<br />
Educational Services 0 0 6 0 6<br />
Health Care and Social Assistance 0 0 0 2 2<br />
Arts, Entertainment, and Recreation 0 2 0 0 2<br />
Retail Trade 0 2 0 0 2<br />
Mining 0 0 0 0 0<br />
Transportation and Warehousing 0 0 0 0 0<br />
Information 0 0 0 0 0<br />
Finance and Insurance 0 0 0 0 0<br />
Real Estate and Rental and Leasing 0 0 0 0 0<br />
Management of Companies & Enterprises 0 0 0 0 0<br />
Accommodation and Food Services 0 0 0 0 0<br />
Total 199 18 87 366 670<br />
Management & Remediation Services, respectively.<br />
Small and medium-size employer worksites account<br />
for 90 percent of all green job vacancies (Table 10).<br />
This may be a function of larger businesses being<br />
better capitalized and more able to attract and retain<br />
skilled talent, especially during periods of economic<br />
uncertainty. According to Survey data, 89 percent of<br />
green job vacancies can be found in the five largest<br />
NAICS industry sectors, with 84 percent in Oÿahu and<br />
<strong>Hawai</strong>ÿi counties (Table 10 and Table 11).<br />
Among the large firms, 57 percent of all green<br />
job vacancies can be attributed to two sectors:<br />
(1) Administrative, Support, Waste Management<br />
& Remediation Services, and (2) Construction.<br />
Moreover, 52 percent of O‘ahu’s green vacancies are<br />
in Construction.<br />
For mid-size employers, 82 percent of vacancies<br />
are concentrated in Construction and Agriculture,<br />
Forestry, Fishing & Hunting, while the Construction<br />
Figure 9. <strong>Green</strong> Job Vacancies by Core Areas & County<br />
and Professional, Scientific & Technical Services<br />
industries account for 61 percent of green job<br />
vacancies for small businesses.
In contrast, industries that contribute the least<br />
vacancies in the green labor market are Mining,<br />
Transportation and Warehousing, Information,<br />
Finance and Insurance, Real Estate and Rental and<br />
Leasing, Management of Companies & Enterprises,<br />
and Accommodation and Food Services (Table<br />
11). This might suggest that the greening of these<br />
industries is mature or has not yet fully begun. In<br />
particular, given the limited opportunities for the<br />
excavation of minerals and metals in <strong>Hawai</strong>’i, we<br />
would not expect to see a large number of green job<br />
vacancies in the Mining sector. From an operational<br />
perspective, low vacancy levels in functional areas<br />
such as leadership (Management), capital (Finance)<br />
and risk mitigation (Insurance) are likely because: (1)<br />
these industries account for fewer jobs relative to the<br />
overall economy; (2) these jobs are less likely to be<br />
recognized as “green” given that they cover a wider<br />
spectrum of administrative and generalist activities;<br />
and (3) some of the positions may be of a broader<br />
nature (e.g., chief operating officer or chairman of the<br />
board).<br />
Vacancies by Core <strong>Green</strong> Areas<br />
When the data are assessed by core green areas,<br />
most of the job vacancies appear within Generating<br />
Clean, Renewable, Sustainable Energy and Natural<br />
Environmentally Friendly Production. This is<br />
particularly the case in O‘ahu, with 219 vacancies in<br />
the category. Ninety-five of the County of <strong>Hawai</strong>‘i’s<br />
199 green vacancies are in the Natural Production<br />
category (Figure 9).<br />
Reviewing job vacancies across firm size, mediumsize<br />
worksites account for substantially more green<br />
vacancies than small and large worksites. In the<br />
Generating Clean, Renewable, Sustainable Energy<br />
category, for example, data show that medium-size<br />
firms hold 163 green vacancies. Medium-size firms<br />
also account for the majority (98) of vacancies within<br />
the Natural Environmentally Friendly Production<br />
category, representing 87 percent of the vacancies in<br />
this category (Figure 10). Interestingly, almost all of<br />
these vacancies also originated within the Agriculture,<br />
Forestry, Fishing, and Hunting category.<br />
Figure 10. <strong>Green</strong> Job Vacancies by Core Areas & Worksite<br />
Size<br />
Vacancies by Occupation<br />
Table 12 depicts present estimated green job vacancies<br />
by occupational title relative to the total estimated<br />
green jobs in <strong>2010</strong> and those projected in 2012. The<br />
top-seven occupations -- Sales Engineers, Solar<br />
Photovoltaic Installers, Graders and Sorters of<br />
Agricultural Products, First-Line Supervisors and<br />
Managers of Production and Operating Workers,<br />
Electricians, Retail Salespersons, and Janitors and<br />
Cleaners -- include 50 percent of the total green job<br />
vacancies.<br />
The three occupations of Sales Engineers, Solar<br />
Energy System Engineers, and First-Line Supervisors<br />
each have large numbers of vacancies, including<br />
relative to total current jobs. Their vacancies are<br />
between one to two times their total current green<br />
jobs. These figures may be a result of both an<br />
anticipated expansion of these occupations and the<br />
lack of a skilled and qualified labor pool from which<br />
to fill the positions.<br />
Examination of the 2012 projected green jobs figures<br />
is instructional in showing change for each of the<br />
three occupational categories. The data shows that in<br />
all three occupations, projected job increases ranged<br />
from 196 percent to over 485 percent. These findings<br />
suggest that the present high vacancy rates in these<br />
jobs may not only be a function of lack of qualified<br />
potential employees, but also of expected expansion of<br />
green jobs in the near future.<br />
<strong>Hawai</strong>ÿi’s <strong>Green</strong> <strong>Workforce</strong>: A <strong>Baseline</strong> <strong>Assessment</strong> 25
Table 12. Top 25 <strong>Green</strong> Job Vacancies by SOC Major Groups: <strong>2010</strong><br />
The functions of several of the job titles likely overlap.<br />
For example, the top green job with respect to<br />
absolute vacancies, Solar Photovoltaic Installers, may<br />
overlap with other jobs that could provide the same<br />
services, such as Solar Energy Systems Engineers,<br />
Solar Sales Representatives and Assessors, Solar<br />
Energy Installation Managers, Electricians, and Solar<br />
Thermal Installers and Technicians. Summed together,<br />
these occupations make 114 green vacancies, the<br />
greatest number of vacancies by a factor of 1.6.<br />
26 <strong>Hawai</strong>ÿi’s <strong>Green</strong> <strong>Workforce</strong>: A <strong>Baseline</strong> <strong>Assessment</strong>
<strong>Green</strong> Jobs Projected in 2012<br />
<strong>Hawai</strong>‘i businesses anticipate solid growth of<br />
green jobs to the year 2012. Survey data show that<br />
employment in green-related occupations is expected<br />
to grow from 11,145 in <strong>2010</strong> to 14,048 in 2012, an<br />
increase of 26 percent over two years.<br />
Such growth considerably exceeds the 1.0 percent<br />
increase projected for statewide employment during<br />
the same period. 6 Furthermore, green jobs are<br />
expected to grow from a 2.4 percent share of total state<br />
employment in 2009 to 2.9 percent by 2012. This<br />
accelerating trend is consistent with findings from a<br />
preliminary assessment of <strong>Hawai</strong>‘i ’s green workforce<br />
showing an increase in green jobs between 1998 and<br />
2007. 7<br />
Figure 11. <strong>Green</strong> Jobs by Core Area: 2012<br />
6<br />
DLIR Research & Statistics Office, Long-Term Industry Projections, State,<br />
2008-2018, <strong>2010</strong>.<br />
7<br />
<strong>Workforce</strong> Development Council, DLIR Research & Statistics Office, <strong>Green</strong><br />
<strong>Workforce</strong> Report: Initial Labor Market Analysis Report, October 2009. Projected<br />
annually, the green job rate of increase is 12.7 percent from <strong>2010</strong> to 2012.<br />
Photo Courtesy of <strong>Green</strong> Earth Cleaners on Maui<br />
More than half of projected green jobs are found in<br />
two core green areas, Pollution Reduction and Energy<br />
Efficiency (Figure 11). Most of the projected increase<br />
in green employment, however, is associated with<br />
the generation of clean energy. The Generate Clean,<br />
Renewable, Sustainable Energy core area is expected<br />
to experience an increase of 1,119 new jobs (88<br />
percent) between <strong>2010</strong> and 2012.<br />
Figure 12. <strong>Green</strong> Job Growth by County: <strong>2010</strong>-2012<br />
<strong>Hawai</strong>ÿi’s <strong>Green</strong> <strong>Workforce</strong>: A <strong>Baseline</strong> <strong>Assessment</strong> 27
Figure 13. Growth in <strong>Green</strong> Jobs by Industry, <strong>2010</strong>-2012<br />
Job Projections by County<br />
Survey data indicate growth in green jobs across all<br />
major counties. Consistent with its current status as<br />
the State’s largest provider of green employment,<br />
O‘ahu reports the most sizable green workforce at<br />
8,750 jobs in 2012 (Table 13). This will be a 28<br />
percent increase, or a net 1,885 additional green<br />
workers, compared to current levels. Further<br />
underscoring the anticipated demand for skilled<br />
green labor is the 42 percent increase in the County<br />
of <strong>Hawai</strong>’i. While this amounts to a smaller overall<br />
number of new jobs given that county’s lower<br />
employment base, it is the largest overall rate of<br />
growth within the State and adds 510 green jobs to the<br />
State’s economy (Figure 12).<br />
Solid gains are also expected in Maui and Kaua‘i, with<br />
businesses reporting an over 15 percent increase in<br />
the number of green jobs over the next two years. By<br />
2012, these two counties are projected to support a<br />
total of 3,035 and 531 green jobs, respectively.<br />
28 <strong>Hawai</strong>ÿi’s <strong>Green</strong> <strong>Workforce</strong>: A <strong>Baseline</strong> <strong>Assessment</strong><br />
Photo Courtesy of Kupu <strong>Hawai</strong>ÿi on the Big Island.
Table 13. <strong>Green</strong> Jobs Projections by County and Industry: 2012<br />
<strong>Green</strong> Jobs in 2012<br />
Industry O’ahu <strong>Hawai</strong>’i Maui Kaua’i Total<br />
Construction 3,392 585 724 94 4,796<br />
Administrative & Support & Waste Mgmt & Remediation Services 1,597 81 1,298 189 3,164<br />
Professional, Scientific, & Technical Services 1,069 62 177 13 1,321<br />
Wholesale Trade 690 185 26 14 916<br />
Other Services 623 124 111 48 907<br />
Retail Trade 559 43 134 9 745<br />
Agriculture, Forestry, Fishing, & Hunting 37 393 51 15 495<br />
Manufacturing 250 28 111 10 398<br />
Accommodation and Food Services 36 132 78 30 276<br />
Utilities 135 15 58 18 226<br />
Health Care and Social Assistance 120 0 82 0 202<br />
Arts, Entertainment, and Recreation 42 0 52 88 182<br />
Transportation and Warehousing 175 0 0 0 175<br />
Educational Services 15 83 37 2 136<br />
Real Estate and Rental and Leasing 5 1 91 0 98<br />
Information 0 0 6 0 7<br />
Mining 3 0 0 0 3<br />
Finance and Insurance 0 0 0 0 0<br />
Management of Companies & Enterprises 0 0 0 0 0<br />
Total 8,750 1,732 3,035 531 14,048<br />
<strong>Hawai</strong>ÿi’s <strong>Green</strong> <strong>Workforce</strong>: A <strong>Baseline</strong> <strong>Assessment</strong> 29
Table 14. Growth in <strong>Green</strong> Jobs by County and Industry: <strong>2010</strong>-2012<br />
New and Emerging <strong>Green</strong> Occupation: Sustainability Specialist<br />
The green economy has generated a number of<br />
new professional, technical and administrative jobs<br />
whose principal responsibilities are to monitor and<br />
lead an establishment’s green efforts. One prime<br />
example is the emerging occupation of Sustainability<br />
Specialist. The <strong>Hawai</strong>ÿi <strong>Green</strong> Jobs Survey helped<br />
identify several, predominantly large, firms that<br />
offer such career opportunities in industries ranging<br />
from professional services to food services. In<br />
<strong>2010</strong>, there were an estimated 61 Sustainability<br />
Specialists in the State of <strong>Hawai</strong>ÿi, with a projected<br />
growth rate of 26 percent by 2012. Based on O*NET<br />
definitions, a Sustainability Specialist “address(es)<br />
organizational sustainability issues, such as waste<br />
stream management, green building practices, and<br />
green procurement plans” by undertaking prescribed<br />
tasks to:<br />
• Develop sustainability project goals, objectives,<br />
initiatives, or strategies in collaboration with<br />
other sustainability professionals;<br />
• Monitor or track sustainability indicators, such<br />
as energy usage, natural resources usage, waste<br />
generation, and recycling;<br />
• Assess or propose sustainability initiatives,<br />
considering factors such as cost effectiveness,<br />
technical feasibility, and acceptance. 1<br />
30 <strong>Hawai</strong>ÿi’s <strong>Green</strong> <strong>Workforce</strong>: A <strong>Baseline</strong> <strong>Assessment</strong><br />
Hiring managers are interested in individuals<br />
with skill sets comparable to other corporate<br />
professionals, which include excellent written and<br />
oral communication skills, project management<br />
experience and data analysis expertise. An<br />
undergraduate degree in engineering, environmental<br />
studies or the natural sciences is also considered<br />
beneficial.<br />
To produce students capable of entering career<br />
pathways in energy and environmental sustainability,<br />
grass root initiatives such as Sustainable Saunders<br />
at the University of <strong>Hawai</strong>ÿi aim to integrate the<br />
educational curriculum with campus-based projects<br />
and internships. 2 This holistic approach allows<br />
students from multiple disciplines to work together<br />
on current sustainability issues, while developing the<br />
skills and acumen necessary to transition successfully<br />
into the green workforce upon graduation. Moreover,<br />
such programs serve as a useful conduit transmitting<br />
the skills-needs of potential employers with frontline<br />
education providers.<br />
1 http://online.onetcenter.org/link/summary/13-1199.05<br />
2 http://sustainablesaunders.hawaii.edu
Figure 14. <strong>Green</strong> Job Projections by Industry: 2012<br />
<strong>Hawai</strong>ÿi’s <strong>Green</strong> <strong>Workforce</strong>: A <strong>Baseline</strong> <strong>Assessment</strong> 31
Job Projections by Industry<br />
By 2012, the Construction and Administrative and<br />
Waste Services sectors are expected to yield the<br />
greatest number of green jobs at 4,796 and 3,164,<br />
respectively (Table 13). Construction will include<br />
34 percent of all green jobs in 2012 (Figure 14) and<br />
experience 44 percent growth between <strong>2010</strong> and 2012,<br />
creating 1,468 new green jobs, the largest increase in<br />
absolute terms (Table 14).<br />
Agriculture and Forestry is projected to experience<br />
a 78 percent increase in its green employment, the<br />
largest growth reported by any industry group during<br />
this two-year period (Figure 13). Additional highgrowth<br />
industries for green jobs are Accommodation<br />
and Food Services (59 percent) and Professional,<br />
Scientific and Technical Services (40 percent).<br />
Figure 15. Absolute Growth in <strong>Green</strong> Jobs by Worksite Size:<br />
<strong>2010</strong>-2012<br />
Figure 16. Growth in <strong>Green</strong> Jobs by Worksite Size: <strong>2010</strong>-2012<br />
32 <strong>Hawai</strong>ÿi’s <strong>Green</strong> <strong>Workforce</strong>: A <strong>Baseline</strong> <strong>Assessment</strong><br />
Table 15. <strong>Green</strong> Job Projections by County and Worksite<br />
Size: 2012<br />
Table 16. Growth in <strong>Green</strong> Jobs by County and Worksite<br />
Size: <strong>2010</strong>-2012<br />
Job Projections by Worksite Size<br />
Between <strong>2010</strong> and 2012, most of the increase in<br />
green employment is expected to occur at small and<br />
medium-size employer worksites (Figure 15). Midsize<br />
businesses report an estimated 1,520 additional<br />
green jobs by 2012, an increase of 33 percent (Figure<br />
16). An even greater 36 percent rate of growth is<br />
projected for small businesses, which will bring total<br />
green employment by small businesses to 3,925 jobs<br />
(Table 15). In contrast, hiring at large worksites will<br />
likely grow at a more moderate pace of nine percent,<br />
amounting to a green workforce of 3,970 or 340 new<br />
green jobs by 2012 (Table 16).<br />
Job Projections by Occupation<br />
Survey data show that the top three occupations with<br />
respect to absolute growth prospects in green jobs are<br />
Solar Photovoltaic Installers, Sales Engineers and<br />
Electricians (Table 18). In addition, Upholsterers,<br />
who recycle furniture, are estimated to increase by<br />
145 positions by 2012. By 2012, employment in these<br />
areas is estimated to increase by 1,022 positions, or<br />
142 percent.
Other occupational groups that are likely to offer<br />
a large number of total green jobs in 2012 include<br />
janitors and cleaners (1,248 jobs), forest and<br />
conservation technicians (662 jobs), and electricians<br />
(647 jobs) (Table 17).<br />
Through the <strong>Hawai</strong>‘i Clean Energy Initiative, the State<br />
of <strong>Hawai</strong>‘i is pursuing a major push to improve home<br />
energy conservation through encouraging the use of<br />
energy-efficient appliances, building components and<br />
energy-efficient home design. LEED certification<br />
(see inset article) is a major aspect of this endeavor,<br />
training architects, designers and contractors in<br />
new technologies and methods to design energyefficient<br />
homes and worksites. In addition to solar<br />
appliances such as water heaters, improved insulation<br />
is important for energy efficiency and the passive<br />
cooling of homes and work places.<br />
Several SOC job categories will likely have<br />
overlapping green functions and training requirements<br />
with other SOC job categories. Two of the most<br />
important green functions relate to harnessing solar<br />
energy and improving insulation. Management<br />
of green jobs also has much skill-overlap. The<br />
Industry Focus: Wind Energy<br />
Wind energy is a developing industry in the State of<br />
<strong>Hawai</strong>ÿi, generating a large number of green jobs during<br />
the construction phase of a project and additional jobs<br />
during maintenance.<br />
For example, 12 wind turbines with a total capacity of<br />
30 megawatts of power are currently being installed<br />
in Kahuku, Oÿahu. According to First Wind, the<br />
site’s developer, this project is expected to create 200<br />
construction jobs, mostly in excavation, reinforced steel<br />
framing, cement, and erecting of towers by specialty<br />
cranes. These jobs are likely to last six to nine months<br />
during construction. After construction, there will be six<br />
to ten jobs required for long-term maintenance of the<br />
facility. In addition, approximately eight administrative<br />
staff are located at First Wind’s Oÿahu office.<br />
This project is expected to yield enough renewable energy<br />
to power nearly 7,700 homes in <strong>Hawai</strong>ÿi, and recently<br />
received a $117 million loan guarantee from the U.S.<br />
Department of Energy. 1<br />
occupational groups of Heating and Air Conditioning<br />
Mechanics and Installer; Insulation Workers, Floor,<br />
Ceiling and Wall; Insulation Workers Mechanical;<br />
and Solar Thermal Installers and Technicians likely<br />
provide similar functions of energy conservation,<br />
through the installation of improved insulation for<br />
both cooling and more efficient water heating. If<br />
consolidated into a single category, this job type would<br />
yield 338 new green jobs by 2012, for a total of 1,368<br />
positions, by far the greatest number of projected<br />
green jobs in 2012.<br />
Another example of a functional overlap is the SOC<br />
major group First-Line Supervisors and Managers.<br />
<strong>Green</strong> jobs in these categories include the management<br />
of any type of green job, including diverse green<br />
occupations in the agricultural, construction, janitorial,<br />
sales, and office environments. These First-Line<br />
Supervisors are likely fulfilling similar functions.<br />
When combined, they account for 752 green jobs,<br />
ranking green supervisors in the top-five largest green<br />
occupations projected for 2012 (Table 17).<br />
In addition to the Kahuku site, 21 megawatts worth of wind<br />
turbines are being installed in Maui. This new capacity<br />
will supplement the existing 61 megawatts of wind power<br />
from three large-scale farms on the Big Island (operated<br />
by <strong>Hawai</strong>ÿi Electric Light Company and Apollo Energy<br />
Corporation) and Maui (operated by First Wind).<br />
Combined, approximately 112 megawatts of wind power<br />
are either on-line or currently under construction in the<br />
State. Moreover, these projects are likely to yield 25 longterm<br />
infrastructure maintenance jobs. Smaller-scale wind<br />
energy initiatives, for example at the Parker Ranch on the<br />
Big Island, also add green jobs to the local economy. 2<br />
1 First Wind, “Press Release: First Wind Begins Construction of<br />
Oahu-based Kahuku Wind Project,” July 13, <strong>2010</strong>; Honolulu Star<br />
Advertiser, “Kahuku wind farm lands $117M loan guarantee”,<br />
7/28/<strong>2010</strong>; First Wind, personal communication, November 16,<br />
<strong>2010</strong>.<br />
2 Honolulu Star Advertiser, “Oÿahu wind farm stays on track,”<br />
October 9, <strong>2010</strong>.<br />
<strong>Hawai</strong>ÿi’s <strong>Green</strong> <strong>Workforce</strong>: A <strong>Baseline</strong> <strong>Assessment</strong> 33
Table 17. <strong>Green</strong> Job Projections by Occupation: 2012<br />
Occupation <strong>Green</strong> Jobs: 2012<br />
Janitors and Cleaners Except Maids and Housekeeping Cleaners 1,248<br />
Solar Photovoltaic Installers 684<br />
Electricians 647<br />
Forest and Conservation Technicians 622<br />
Security Guards 552<br />
Heating and Air Conditioning Mechanics and Installers 403<br />
Construction Carpenters 345<br />
Insulation Workers Floor Ceiling and Wall 337<br />
Landscaping and Groundskeeping Workers 336<br />
Solar Thermal Installers and Technicians 297<br />
Insulation Workers Mechanical 297<br />
Retail Salespersons 290<br />
Sales Engineers 267<br />
Laborers and Freight Stock and Material Movers Hand 247<br />
Recycling and Reclamation Workers 225<br />
Environmental Science and Protection Technicians Including Health 215<br />
First-Line Supervisors/Managers of Construction Trades and Extraction Workers 214<br />
Upholsterers 209<br />
Maintenance and Repair Workers General 194<br />
Plumbers 185<br />
Graders and Sorters Agricultural Products 181<br />
First-Line Supervisors/Managers of Landscaping Lawn Service and Groundskeeping<br />
Worker<br />
Construction Laborers 173<br />
Civil Engineers 169<br />
Computer Support Specialists 167<br />
34 <strong>Hawai</strong>ÿi’s <strong>Green</strong> <strong>Workforce</strong>: A <strong>Baseline</strong> <strong>Assessment</strong><br />
179
Table 18. Top 25 <strong>Green</strong> Occupations by Growth: <strong>2010</strong>-2012<br />
Sorting invasive limu on the Big Island. Photo Courtesy of Kupu <strong>Hawai</strong>ÿi<br />
<strong>Hawai</strong>ÿi’s <strong>Green</strong> <strong>Workforce</strong>: A <strong>Baseline</strong> <strong>Assessment</strong> 35
<strong>Green</strong> Finance: Innovation Spurs Clean Energy Projects<br />
Obtaining adequate levels of financing can be a major obstacle for property owners seeking to implement<br />
clean energy and/or energy efficiency projects. Institutional investors, however, are generally not well<br />
suited to finance small, disaggregated projects, and are likely to avoid projects with high risks for default. 1<br />
One innovative solution to this size and duration mismatch is the use of Property Assessed Clean Energy<br />
(PACE) bonds, which are legislated in 24 states including <strong>Hawai</strong>ÿi.<br />
According to a report by researchers at the University of California at Berkeley, “renewable energy<br />
(projects)… generate more jobs per unit of energy delivered than the fossil fuel-based sectors” while<br />
freeing “money otherwise spent on energy cost(s) and redirect(ing) it to stimulate the economy through<br />
additional job creation.” PACE bonds bridge the gap between the needs of prospective property owners<br />
and institutional investors. As illustrated in the model below, a municipality floats PACE bonds that are<br />
purchased by institutional investors seeking bonds backed by property taxes. 2 Property owners obtain a<br />
loan from the municipality to finance a green project, and the loan is later repaid through the assessment of<br />
a special property tax equal to 1/20th of the loan amount plus interest and payable over the following 20<br />
years.<br />
For example, Company X owns a mid-rise commercial building and pays $10,000 per month in utilities.<br />
Company X completes an energy audit and learns that it can save $5,000 per month in utilities by investing<br />
$200,000 in clean energy and energy efficiency (e.g., solar photovoltaic, energy efficient lighting and<br />
HVAC). Company X borrows $200,000 at a 10 percent rate and 20-year term from the County’s PACE<br />
program, allowing it to complete the green retrofit. Company X then repays the loan by making a special<br />
property tax surcharge payment of $1,950 per month. This is a financially prudent investment -- from day<br />
one, Company X realizes a $3,050 monthly return (i.e., $5,000 energy savings minus $1,950 property tax<br />
surcharge).<br />
PACE bonds allow for a scaling-up of clean energy initiatives, and provide a wide array of social,<br />
environmental and financial benefits. From a societal perspective, local governments are able to<br />
stimulate the economy and create new green jobs, moving the state closer to a sustainable energy future.<br />
Environmentally, an expansion in the depth and breadth of clean energy projects will serve to decrease our<br />
dependence on fossil fuels and lower overall carbon emission levels. Financially, property owners realize an<br />
immediate positive return, and institutional investors have access to an asset that provides relatively steady<br />
returns with diminished risk of default.<br />
1 Harvard Business Review, “The HBR List: Breakthrough Ideas for <strong>2010</strong>,” January-February, <strong>2010</strong>.<br />
2 Max Wei, Shana Patadia, Daniel M. Kammen. “Putting renewable and energy efficiency to work: How many jobs can the clean<br />
energy industry generate in the US?” Energy Policy 38.2 (<strong>2010</strong>).<br />
36 <strong>Hawai</strong>ÿi’s <strong>Green</strong> <strong>Workforce</strong>: A <strong>Baseline</strong> <strong>Assessment</strong>
Economic Stimulus & Job Creation<br />
(1) Municipal government floats PACE bonds that are purchased by institutional investors. Funds from this transaction are<br />
then used to make loans to property owners who complete energy efficient projects.<br />
(2) Property owner makes payment for special property tax assessment. Payments pass through to an institutional investor.<br />
(3) Property owner hires an entity (the direct employer) to design, manufacture, construct, and install the clean energy<br />
project. Direct employers hire employees and make purchases from both upstream and downstream suppliers (the indirect<br />
employers) to complete the project. Indirect employers, such as a silicon manufacturer for photovoltaic panels, then<br />
purchases supplies and hires its own employees. Finally, additional economic activity is generated when employees of<br />
direct and indirect employers spend money at downstream employer establishments such as fast food and retail stores. 2<br />
<strong>Hawai</strong>ÿi’s <strong>Green</strong> <strong>Workforce</strong>: A <strong>Baseline</strong> <strong>Assessment</strong> 37
Qualifications and Employee Training Requirements<br />
<strong>Green</strong> jobs in <strong>Hawai</strong>ÿi require employees with a wide<br />
variety of qualifications, certifications and educational<br />
backgrounds. While more than half of <strong>Hawai</strong>ÿi<br />
businesses reporting a green job did not respond to<br />
this section of the survey, several noteworthy themes<br />
emerge when existing data are categorized into three<br />
broad areas: (1) minimum education, (2) formal<br />
certifications or licenses, and (3) informal on-the-job<br />
training (OJT).<br />
Of those businesses that responded to the<br />
Qualifications and Training section of the Survey,<br />
more than 70 percent indicate some form of minimum<br />
education or training requirement. The most<br />
frequently cited of these are community colleges<br />
and trade schools, which suggest that specialized<br />
training is sought for many green jobs (Figure 17).<br />
While university education is the second highestranked<br />
source for fulfilling such requirements, many<br />
employers with current or prospective green jobs view<br />
a formal degree as neither essential nor an impediment<br />
to placement in many of these occupations.<br />
Incidentally, only 15 percent of businesses require a<br />
bachelor’s degree or higher, and these are likely to<br />
be concentrated in scientific, technical or managerial<br />
fields.<br />
Figure 17. Formal <strong>Green</strong> Training<br />
38 <strong>Hawai</strong>ÿi’s <strong>Green</strong> <strong>Workforce</strong>: A <strong>Baseline</strong> <strong>Assessment</strong><br />
Photo Courtesy of Kupu <strong>Hawai</strong>ÿi on the Big Island.<br />
When queried specifically on certification or<br />
licensure, 64 percent of responding businesses cited<br />
it as a requirement. Of these, the most commonly<br />
Figure 18. On-the-Job <strong>Green</strong> Training
cited requirement is the Leadership in Energy and<br />
Environmental Design (LEED) certification, referred<br />
to in 11 percent of responses. Examples of such<br />
occupations include architects, civil engineers,<br />
construction managers, cost estimators, and electrical<br />
engineers. Based on survey data, green jobs generally<br />
require some type of license (23 percent) as opposed<br />
to certification (16 percent).<br />
The third area of analysis, informal OJT, received<br />
318 responses. Of these, 83 percent indicated OJT as<br />
a requirement, with 17 percent indicating no required<br />
OJT. The two most cited durations for OJT were<br />
0-12 months and 1-5 years, each of which represents<br />
seven percent of the total responses (Figure 22).<br />
This suggests that employers view informal training<br />
at the workplace as an important component of<br />
green workforce development, more so than formal<br />
education, certifications or licenses. This is also<br />
broadly in line with our findings that green jobs tend<br />
to be a greening of existing jobs rather than new jobs<br />
requiring altogether new skills.<br />
Educational Requirements for <strong>Green</strong><br />
Trades and Professions<br />
Categorizing occupations by education and training<br />
requirements yields additional insights (Figure 19).<br />
Based on information produced by the BLS, we divide<br />
these requirements into three tiers: “high” education/<br />
training includes jobs that require work experience<br />
plus a four-year college degree, professional degree<br />
or graduate school; “medium” includes jobs that<br />
require an associate’s degree, work experience in a<br />
related occupation, post-secondary vocational training,<br />
or extensive OJT; “low” includes occupations that<br />
require minimal or moderate OJT.<br />
The number of new green jobs in the medium<br />
tier is higher than that of either the high- or loweducation<br />
categories. By 2012, the five highest-ranked<br />
occupations in the medium-education category are<br />
expected to generate a total of 928 new green jobs. In<br />
contrast, the low- and high-education categories will<br />
yield 422 and 491 new jobs, respectively. Across all<br />
Leadership in Energy & Environmental Design<br />
(LEED)<br />
LEED is an internationally-recognized green<br />
building certification system, providing third-party<br />
verification that a building or community was<br />
designed, built, and maintained using strategies<br />
intended to improve performance in metrics such<br />
as energy savings, water efficiency, CO2 emissions<br />
reduction, improved indoor environmental quality,<br />
and stewardship of resources.<br />
Developed by the U.S. <strong>Green</strong> Building Council,<br />
LEED is intended to provide building owners and<br />
operators with a concise framework for identifying<br />
and implementing practical and measurable green<br />
building design, construction, operations and<br />
maintenance.<br />
Source: U.S. <strong>Green</strong> Building Council<br />
Photo Courtesy of 21st Century Technologies <strong>Hawai</strong>ÿi<br />
three tiers, the top-five occupations are estimated to<br />
collectively account for 63 percent of new green jobs<br />
by 2012.<br />
Analysis of survey data by occupation shows<br />
that Solar Photovoltaic Installers are expected to<br />
experience the greatest overall increase in green jobs<br />
(Figure 19). Based on employer responses, workers in<br />
<strong>Hawai</strong>ÿi’s <strong>Green</strong> <strong>Workforce</strong>: A <strong>Baseline</strong> <strong>Assessment</strong> 39
Figure 19. Projected Growth Rate of the Top 5 <strong>Green</strong> Occupations by Education, <strong>2010</strong>-2012<br />
40 <strong>Hawai</strong>ÿi’s <strong>Green</strong> <strong>Workforce</strong>: A <strong>Baseline</strong> <strong>Assessment</strong>
this job group will need a moderate level of education<br />
and training, such as: contractor licenses, specific<br />
photovoltaic training, electrician courses, associate’s<br />
degree, journeyman electrician’s license, or significant<br />
OJT.<br />
Electricians, also in the middle tier, have similar<br />
training requirements and are likewise projected<br />
to experience high growth, both in absolute and<br />
percentage terms. Requirements include an associate’s<br />
degree, certificate of achievement, electrical<br />
journeyman’s license, apprenticeship, work experience<br />
in a related occupation, five years of OJT, or some<br />
combination thereof. The Honolulu Community<br />
College’s Electrical Installation & Maintenance<br />
Technology program, which offers both associate’s<br />
degrees and certificates of achievement, was<br />
specifically mentioned by survey respondents.<br />
Heating & Air Conditioning Mechanics and Installers<br />
are the largest projected growth category of insulationrelated<br />
green jobs, and typically require an associate’s<br />
degree or certificate of achievement, and less than<br />
two years of OJT. Coursework and an apprenticeship<br />
in refrigeration, plumbing, air-conditioning, sheet<br />
metal, or basic electrical are useful. North American<br />
Technician Excellence (NATE) and Environmental<br />
Protection Agency 608 Refrigerant certifications were<br />
cited by survey respondents, which include training to<br />
protect the ozone layer.<br />
While occupations requiring mid-level education/<br />
training are likely to experience the most sizeable<br />
growth in new green jobs during the two-year period<br />
between <strong>2010</strong> and 2012, the other two tiers also<br />
contain jobs with high levels of projected growth.<br />
Photo Courtesy of Peter Liu, kaiscapes.com<br />
In the high-education/training category, Sales<br />
Engineers are expected to experience the largest<br />
overall increase, in both absolute and percentage<br />
terms. Computer Support Specialists are projected<br />
to more than double to 91 positions, and these jobs<br />
typically require a bachelor’s degree and computer<br />
certifications. High-level Solar Energy Systems<br />
Engineers are projected to increase by 46 positions, or<br />
460 percent.<br />
For “green collar” laborers in the low-tier,<br />
Upholsterers, Graders and Sorters of Agricultural<br />
Products, and Insulation Workers are projected<br />
to experience the greatest growth in absolute and<br />
percentage terms. Retail Salespersons will also<br />
experience job growth. Requirements specific<br />
to this occupation include work experience in a<br />
related occupation, less than two years of OJT, and<br />
occasional certification such as for food handling,<br />
vendor products, general sales, or forklifts. In contrast,<br />
Landscaping and Groundskeeping Workers generally<br />
require less than one year of OJT and no certifications.<br />
Specific skills, such as training in precision irrigation<br />
with pop up multi-directional precision spray nozzles,<br />
is considered beneficial.<br />
Survey data confirm the general finding that most<br />
future employee training requirements for green jobs<br />
will be fulfilled at community colleges and trade<br />
schools, supplemented with extensive OJT. <strong>Green</strong> jobs<br />
intersect a wide array of skill and knowledge areas that<br />
will require workers who can successfully adapt to the<br />
changing needs of today’s economy.<br />
<strong>Hawai</strong>ÿi’s <strong>Green</strong> <strong>Workforce</strong>: A <strong>Baseline</strong> <strong>Assessment</strong> 41
<strong>Green</strong> Practices<br />
The primary distinction between a green practice<br />
and a green job is that the latter engages in economic<br />
activity that is favorable to the environment or energy<br />
sustainability and central or essential to business<br />
operations. It is not necessary for a business to offer<br />
green jobs for green practices to be in place. For<br />
example, a cleaning company that advertises the<br />
routine use of eco-friendly cleaning products could<br />
consider employees specifically engaged in such<br />
activities as occupants of green jobs. Presumably,<br />
these workers are required to make use of green<br />
products for which customers pay a nominal premium.<br />
If, on the other hand, this business does not advertise<br />
or commit itself to the usage of green products on<br />
a recurring basis, then its workers would generally<br />
be classified as practitioners of green behavior in<br />
non-green jobs. While the distinction is not always<br />
obvious or clear, it is the guiding definition of this<br />
report.<br />
Based on survey data, green practices are common<br />
in the State of <strong>Hawai</strong>ÿi. Ninety-three percent<br />
of respondents report at least one green practice<br />
performed at their business worksite; 51 percent report<br />
two to four such practices. Overall, the frequency of<br />
green practices is normally distributed with an average<br />
of 3.5 per business (Figure 20).<br />
Recycling is ubiquitous and by far the most common<br />
green practice in <strong>Hawai</strong>ÿi, with more than 80 percent<br />
Figure 20. <strong>Green</strong> Practices per Worksite<br />
42 <strong>Hawai</strong>ÿi’s <strong>Green</strong> <strong>Workforce</strong>: A <strong>Baseline</strong> <strong>Assessment</strong><br />
Kaläheo Elementary School. Photo Courtesy of Kauaÿi Recycling<br />
of businesses recycling and nearly 60 percent using<br />
recycled products (Table 19). Such activity is not<br />
limited to the recycling of cans, bottles and paper.<br />
Worksites report the recycling of an array of products<br />
ranging from oil, grease, solvents, tires, plastic<br />
buckets, cork, batteries, and electronic equipment.<br />
Other examples include the conversion of cooking oil<br />
to bio-diesel, and one hotelier reports delivering food<br />
waste to contractors for the production of methane<br />
gas. Another company cites mercury recycling with<br />
a mercury-capture filter, which not only recaptures<br />
mercury for future use but also reduces mercury<br />
effluent, a major threat to marine habitat, fisheries and<br />
human health. 8<br />
The conservation of energy is also frequently reported<br />
by businesses, with over one-half using energysaving<br />
light bulbs and nearly 40 percent making<br />
conscious efforts to reduce energy usage. Several<br />
worksites have been particularly proactive in this<br />
8 Refer to http://hawaii.gov/dbedt/info/energy/publications/<br />
recycling99.pdf for recycling companies in the State of<br />
<strong>Hawai</strong>i. Mercury pollution information is from the University<br />
of Wisconsin-Madison, “Mercury Pollution Threatens Health<br />
Worldwide, Scientists Say,” Science Daily, August 11, 2006.
Table 19. <strong>Green</strong> Practices by County and Worksite Size, Share of Total<br />
regard, adopting technologies such as timers or other<br />
automatic-shutoff systems on high-energy appliances.<br />
Indeed, energy conservation measures can range<br />
from complex to pragmatic. Survey respondents cite<br />
the use of electronic ballasts in fluorescent lighting,<br />
variable-frequency drive motors for air-conditioning<br />
and booster pumps, and even wind generators. 9 For<br />
natural cooling and lighting, some companies report<br />
the use of skylights, fans and even black-out drapes.<br />
One business reported simply turning off the lights for<br />
half the day.<br />
Twenty-eight percent of respondents clean with ecofriendly<br />
products, and nearly as much (25 percent)<br />
practice water conservation. For example, one<br />
company reports the installation of rain sensors on<br />
its irrigation systems, while another uses reclaimed<br />
water for irrigating a golf course. In the transportation<br />
area, telecommuting and carpooling were listed as a<br />
green practices by more than 10 percent of responding<br />
businesses (Table 19). Several companies reported<br />
“walk to work” programs.<br />
9 Variable frequency drives (VFD) vary the quantity of air<br />
pumped, for example through an air-conditioning unit, depending<br />
on system demand.<br />
Analysis of survey data by county shows that Maui<br />
and Kauaÿi counties report the largest average number<br />
of green practices per worksite (Table 19). Worksites<br />
in these two counties report a relatively strong<br />
commitment to recycling, use of recycled products,<br />
reduced energy consumption, water conservation, and<br />
commuting via carpool or bicycle.<br />
Businesses in Oÿahu and Kauaÿi counties cite close<br />
cooperation with local energy companies to moderate<br />
energy usage during periods of energy shortages. For<br />
example, one company reports participation in the<br />
<strong>Hawai</strong>ian Electric Company’s (HECO) Energy Scouts<br />
program. Members of this initiative allow HECO<br />
to control 50-10,000 kW of their energy use on an<br />
as-needed basis. If alerted by HECO of a systemic<br />
energy shortage, Energy Scouts are compensated to cut<br />
energy demand by either activating backup generators<br />
or decreasing the use of high-energy appliances. 10<br />
Across employer worksite size categories, more than<br />
75 percent recycle, over one-half use energy-saving<br />
light bulbs and recycled products, and roughly onequarter<br />
clean with eco-friendly products and conserve<br />
water (Table 19). On average, larger businesses are<br />
more likely to adopt green practices with a higher<br />
10 www1.eere.energy.gov/femp/financing/eip_hi.html<br />
<strong>Hawai</strong>ÿi’s <strong>Green</strong> <strong>Workforce</strong>: A <strong>Baseline</strong> <strong>Assessment</strong> 43
<strong>Green</strong> Certification<br />
Several organizations certify green products and services. <strong>Green</strong> Seal is a non-profit organization<br />
that certifies a broad range of products and services, including cleaning products and hotels; they also<br />
partner with large institutional purchasers to develop green purchasing plans. The U.S. <strong>Green</strong> Building<br />
Council (USGBC) certifies construction companies that build according to sustainability requirements.<br />
USGBC developed the LEED building requirements, and LEED-certified buildings must be cleaned<br />
with products that are either certified by <strong>Green</strong> Seal or compliant with California environmental codes.<br />
Several additional entities encourage green practices in the hotel industry. These include the <strong>Green</strong><br />
Hotels Association, Eco<strong>Green</strong> Hotel, <strong>Green</strong> Globe, and the Tourism Sustainability Council, which<br />
provide green guidelines and certify particular hotels as green. EnergyStar is a government-sponsored<br />
program that certifies appliances as energy-efficient, and <strong>Green</strong> Shield certifies pest control practices and<br />
companies.<br />
Sources: Honolulu Star-Advertiser, “Check Labels to See What ‘<strong>Green</strong>’ Means,” October 25, <strong>2010</strong>. Other resources include<br />
<strong>Green</strong>Seal.org, <strong>Green</strong>Hotels.com, Eco<strong>Green</strong>Hotel.com, EnergyStar.gov, <strong>Green</strong>ShieldCertified.org, and<br />
www.cleanlink.com/cp/article.asp?id=2599&keywords=green+cleaning,+certification.<br />
frequency than their smaller counterparts. Large<br />
worksites performed an average of four green<br />
practices, compared with 3.5 and 3.2 for medium<br />
and small-size worksites, respectively (Table 19).<br />
For example, 91 percent of large employers recycle<br />
compared with just over three-quarters for small<br />
worksites; 54 percent report energy-use reduction<br />
compared to about one-third for small and mid-size<br />
worksites. Moreover, 12 percent of large businesses<br />
provide their employees with subsidized bus passes,<br />
compared with just three percent for smaller ones.<br />
Large worksites may provide support for more green<br />
practices for a number of reasons, such as the ability<br />
to better mobilize employee adherence to green<br />
policies and practices. Given the size and number<br />
of personnel available at larger businesses, it may<br />
also be more likely that at least some segment of the<br />
overall workforce prescribes to a green practice. For<br />
example, the probability that a worksite with 1,000<br />
employees supports at least one worker who recycles<br />
is likely to be higher than that for a small-size business<br />
of ten. The high occurrence of green practices at small<br />
firms, coupled with the constricted distribution of the<br />
average number of green practices across all firms (3.2<br />
to 4), suggests that green practices at even the largest<br />
firms are practiced by a large proportion of employees.<br />
44 <strong>Hawai</strong>ÿi’s <strong>Green</strong> <strong>Workforce</strong>: A <strong>Baseline</strong> <strong>Assessment</strong><br />
Photo Courtesy of Peter Liu, kaiscapes.com
Table 20. <strong>Green</strong> Practices by Industry, Share of Total<br />
Use Low<br />
Fuel Ef-<br />
VOC<br />
ficient<br />
Solar<br />
Paints,<br />
Clean w/ & AlterSubsi-<br />
Bicycle<br />
Energy Use and<br />
Stains,<br />
Econative Reduce dized Water Com-<br />
Industry (Average Number of <strong>Green</strong><br />
Saving Recycled PhotoTelecom- or Sealfriendly<br />
Fuel Energy Bus Consermute Practices) Recycle Bulbs Products voltaicsmuteers Carpool Products Vehicles Use Pass vation Program Other<br />
64% 47% 46% 18% 8% 8% 7% 26% 3% 28% 0% 38% 1% 17%<br />
Agriculture, Forestry, Fishing & Hunting<br />
(3.1)<br />
Mining (1.0) 44 11 11 11 0 0 0 0 0 22 0 0 0 0<br />
Utilities (3.3) 83 54 54 9 11 14 3 20 11 31 9 23 3 6<br />
Construction (3.4) 81 45 53 16 7 13 16 27 8 35 2 26 1 5<br />
Manufacturing (3.4) 82 54 55 7 10 12 10 32 8 36 1 26 1 9<br />
Wholesale Trade (3.0) 82 40 57 8 13 3 9 25 6 27 2 20 1 7<br />
Retail Trade (3.8) 85 61 65 7 13 5 11 31 6 45 10 26 3 9<br />
Transportation and Warehousing (3.2) 87 47 66 3 18 6 9 18 5 34 4 15 0 5<br />
Information (3.1) 87 40 58 10 12 2 6 19 2 38 6 19 4 4<br />
Finance and Insurance (3.4) 89 52 65 3 10 3 9 14 7 46 29 13 0 2<br />
82 63 55 14 14 10 8 29 8 48 8 27 1 3<br />
Real Estate and Rental and Leasing<br />
(3.7)<br />
86 48 57 8 23 5 9 20 8 33 8 20 3 4<br />
Professional, Scientific & Technical<br />
Services (3.3)<br />
89 50 64 7 18 9 7 25 7 45 21 27 0 2<br />
Management of Companies &<br />
Enterprises (3.7)<br />
Administrative & Support & Waste 75 47 55 9 10 4 14 31 9 31 5 28 3 6<br />
Mgmt & Remediation Services (3.3)<br />
Educational Services (3.6) 83 54 61 12 11 10 16 35 6 41 9 19 4 4<br />
Health Care & Social Assistance (3.5) 90 54 61 9 14 8 12 24 6 36 10 17 2 4<br />
Arts, Entertainment & Recreation (4.1) 83 57 58 13 19 12 12 42 12 50 5 35 1 14<br />
Assomodation & Food Services (4.0) 83 69 62 5 7 11 16 35 6 51 2 37 2 11<br />
Other Services (except Public Admin) 77 58 58 6 9 14 9 30 6 38 3 30 1 5<br />
(3.4)<br />
<strong>Hawai</strong>ÿi’s <strong>Green</strong> <strong>Workforce</strong>: A <strong>Baseline</strong> <strong>Assessment</strong> 45
<strong>Green</strong> Practices by Industry<br />
By major industry group, the Arts, Entertainment,<br />
& Recreation and Accommodation & Food Services<br />
industries report the highest average number of green<br />
practices at 4.1 and 4.0, respectively (Table 20).<br />
Accommodation & Food Services ranked first in the<br />
overall use of energy saving light bulbs (69 percent)<br />
and reducing energy usage (51 percent), and second in<br />
cleaning with eco-friendly products (35 percent) and<br />
water conservation (37 percent). The significance of<br />
this finding is that Accommodation & Food Services is<br />
the largest private industry employer in the State, and<br />
these businesses generally require large amounts of<br />
energy to operate.<br />
Agriculture is another sector heavily dependent on<br />
natural resources, with survey data reporting the<br />
highest share for water conservation and usage of<br />
solar and photovoltaic systems at 38 percent and 18<br />
percent, respectively. Given the central role that water<br />
plays in irrigation systems, there remain significant<br />
opportunities for further conservation efforts among<br />
the State’s farming sector.<br />
Recycling is popular and widely practiced throughout<br />
the State, with a majority of industries reporting<br />
participation rates in excess of 80 percent. Ninety<br />
percent of reporting worksites in the Health Care<br />
& Social Assistance industry recycle compared<br />
to just over 40 percent in Mining. Meanwhile,<br />
Transportation & Warehousing had the highest share<br />
of worksites utilizing recycled products (66 percent),<br />
which is most likely due to the use of recycled<br />
cardboard containers and other moving materials. At<br />
least half of the remaining industries used recycled<br />
products.<br />
Finance & Insurance and Management of Companies<br />
& Enterprises lead in the practice of subsidized bus<br />
passes at 29 percent and 21 percent, respectively. This<br />
relatively high participation rate is likely the result<br />
of being located in the urban core. The Professional,<br />
Scientific, and Technical Services industry reports the<br />
highest rate of telecommuting (23 percent), which<br />
is likely due to recent technological advances, lower<br />
communication costs and the fact that many of these<br />
46 <strong>Hawai</strong>ÿi’s <strong>Green</strong> <strong>Workforce</strong>: A <strong>Baseline</strong> <strong>Assessment</strong><br />
services can be efficiently performed from home<br />
offices.<br />
Diversity of <strong>Green</strong> Practices<br />
In addition to the green practices listed on the survey<br />
instrument, businesses were allowed to customize<br />
their responses. These diverse and sometimes creative<br />
practices include the use of chlorine-free paper from<br />
sustainable forests, bio-degradable organic eating<br />
utensils and containers made from vegetable matter,<br />
rechargeable batteries, LEED-certified buildings,<br />
low-sulfur diesel, heat reclamation from refrigeration<br />
and air-conditioning for hot water supply, and locallysourced<br />
procurements. Several companies report<br />
providing reusable eating implements, including<br />
dishes, silverware, water bottles, and coffee cups,<br />
all of which eliminate or reduce waste byproducts.<br />
Other businesses limit copier and printer use while<br />
encouraging electronic communications and recordkeeping.<br />
Interestingly, one company supports an<br />
executive mandate requiring “paperless” meetings.<br />
In the agriculture and landscaping sectors, green<br />
practices include composting, use of native species<br />
to preserve biodiversity, and the venerable practice of<br />
“giving food scraps to the pigs.”<br />
Opportunities to “go green” are abundant. Initiatives<br />
to locate eco-friendly or eco-friendlier alternatives<br />
may require creativity, but can be practical and lowcost<br />
as well.
Conclusion<br />
The green economy in <strong>Hawai</strong>ÿi is sizable and<br />
positioned to grow rapidly. Fueling this trend is<br />
consumer demand for goods and services that are<br />
carbon-neutral or low impact on the environment.<br />
Businesses are responding to this niche market by<br />
developing production processes and delivery systems<br />
that consider factors beyond profit maximization.<br />
While these intentions may be well placed, our<br />
knowledge of the environment and the role that<br />
humans play in it remains limited and is still evolving.<br />
Technologies that can reduce our ecological footprint<br />
also require costly research and, in some cases,<br />
complex infrastructure. To effectively respond to<br />
these challenges, policy makers and community<br />
leaders must cultivate an educated and skilled<br />
workforce capable of meeting the needs of a cleanenergy<br />
economy.<br />
Data from the inaugural <strong>Hawai</strong>‘i <strong>Green</strong> Jobs Survey<br />
indicate that green jobs are expected to increase from a<br />
2.4 percent share of total private employment in <strong>2010</strong><br />
to 2.9 percent by 2012. Such growth will bring on line<br />
2,903 new green jobs statewide, a 26 percent increase<br />
in just two years. This contrasts with a one percent<br />
average increase in total State employment over the<br />
same period. 11 Given our findings that green jobs exist<br />
in a large array of industries, ranging from traditional<br />
sectors such as agriculture and construction to high<br />
technology ventures in bio-fuels and hydrothermal,<br />
a growth rate differential of this magnitude can have<br />
profound social and economic implications<br />
Labor market participants will require the tools and<br />
resources to transition to a greener economy. This will<br />
include retraining on-the-job or through certification<br />
and licensing. Enrollment in formal degree programs<br />
may be necessary if workers are to pursue entirely new<br />
careers, either by choice or through underemployment<br />
11 DLIR Research & Statistics Office, Long-Term Industry<br />
Projections, State, 2008-2018, <strong>2010</strong>. The overall increase is<br />
based on first quarter <strong>2010</strong> non-government employment of<br />
467,443 and projected 2012 employment of 476,835.<br />
Photo Courtesy of Kauaÿi County Recycling<br />
or unemployment. The associated costs, both direct<br />
and indirect, can be significant, particularly during the<br />
current period of post-recession economic recovery.<br />
Success will require active coordination among all<br />
stakeholders. Educators and training providers must<br />
provide timely and relevant curricula; policy makers<br />
will need to provide support in the form of funding<br />
and a strategic plan that can deliver on its ambitious<br />
HCEI goals; business leaders should continue to<br />
actively incorporate greener practices and processes<br />
into their production platforms; and workers or those<br />
seeking employment will need to update existing skills<br />
and competencies to maintain their competitiveness.<br />
This report provides the first comprehensive<br />
assessment of <strong>Hawai</strong>i’s green workforce.<br />
Employment patterns and vacancy trends are analyzed<br />
at the state and county levels across all major groups<br />
of industries, occupations and worksite sizes. <strong>Green</strong><br />
is an evolving concept that is better understood<br />
when considered within the context of a larger labor<br />
market information (LMI) system. Connecting the<br />
data collected on green jobs with broader LMI-use<br />
dynamics and best practices will be an essential<br />
next step. Such efforts are currently underway, and<br />
encompass two additional areas:<br />
<strong>Hawai</strong>ÿi’s <strong>Green</strong> <strong>Workforce</strong>: A <strong>Baseline</strong> <strong>Assessment</strong> 47
(1) Detailed projections on green jobs across<br />
major industry and occupational groups. Econometric<br />
models will be used to generate a near- and long-term<br />
assessment of <strong>Hawai</strong>i’s future employment needs<br />
based on current trends, conditions, and policies and<br />
incentives impacting green investments.<br />
(2) Skills gap analyses that assess the skill and<br />
competency requirements of green industries<br />
and occupations; demographic characteristics of<br />
existing and potential green workers; and, current<br />
and prospective educational resources and training<br />
capacity. The goal will be to strengthen the linkages<br />
between job seekers, employers, and education and<br />
training providers.<br />
Establishing a process to standardize the definitions,<br />
concepts and technical issues related to green jobs<br />
will facilitate the sharing of information across states<br />
and regions. This leverages existing data, and helps<br />
to develop a more comprehensive understanding of<br />
occupation and industry relationships. The US Bureau<br />
of Labor Statistics (BLS) has already solicited public<br />
feedback and finalized a working definition for green<br />
jobs at the national level. 12 Based on this definition,<br />
the BLS intends to collect occupational employment<br />
and wage data through its existing Occupational<br />
Employment Statistics survey. Modalities to track<br />
emerging green businesses and potential new<br />
occupations would also be useful to more formally<br />
integrate green sectors with the wider economy. This<br />
will require coordination with the Occupational<br />
Information Network (O*NET) program, and possible<br />
changes to the NAICS and SOC.<br />
The State of <strong>Hawai</strong>‘i is making significant progress<br />
toward a more energy independent and secure future.<br />
While the challenges are numerous, measuring<br />
the depth and breadth of the green workforce is a<br />
necessary first step. The <strong>Hawai</strong>‘i <strong>Green</strong> Jobs Survey<br />
provides the foundation upon which stakeholders<br />
across government, business and civil society can<br />
build a sustainable, greener economy.<br />
12 Federal Register, Vol. 75, No. 202.<br />
48 <strong>Hawai</strong>ÿi’s <strong>Green</strong> <strong>Workforce</strong>: A <strong>Baseline</strong> <strong>Assessment</strong>
References<br />
California Community Colleges, Centers for Economic Excellence, Economic and <strong>Workforce</strong> Development<br />
Program. Understanding the <strong>Green</strong> Economy in California: A Community College Perspective. June<br />
2009.<br />
Michigan Department of Energy, Labor & Economic Growth. Bureau Of Labor Market Information & Strategic<br />
Initiatives. Michigan <strong>Green</strong> Jobs Report: Occupations & Employment in the New <strong>Green</strong> Economy, 2009.<br />
North Carolina State University. National Center for O*NET Development. <strong>Green</strong>ing of the World of Work:<br />
Implications for O*NET-SOC and New and Emerging Occupations. February 2009.<br />
Oregon Employment Department. <strong>Workforce</strong> and Economic Research Division. The <strong>Green</strong>ing of Oregon’s<br />
<strong>Workforce</strong>: Jobs, Wages, and Training. June 2009.<br />
Pew Charitable Trusts. The Clean Energy Economy – Repowering Jobs, Business and Investments Across<br />
America. June 2009.<br />
State of <strong>Hawai</strong>‘i Department of Labor & Industrial Relations (DLIR). Research & Statistics Office. Employment<br />
Forecasts for the Short-Term Future, 2009-2011. September <strong>2010</strong>.<br />
State of <strong>Hawai</strong>‘i DLIR. Research & Statistics Office. 2009 Employment and Payrolls in <strong>Hawai</strong>‘i . October<br />
<strong>2010</strong>.<br />
State of <strong>Hawai</strong>‘i DLIR. Research & Statistics Office. <strong>Hawai</strong>‘i <strong>Green</strong> <strong>Workforce</strong> Report: Initial Labor Market<br />
Analysis for the State of <strong>Hawai</strong>‘i . October 2009.<br />
State of <strong>Hawai</strong>‘i DLIR. Research & Statistics Office. Occupational Wages and Employment in <strong>Hawai</strong>‘i , 2009.<br />
August <strong>2010</strong>.<br />
U.S. Department of Commerce, Economics and Statistics Administration. Measuring the <strong>Green</strong> Economy. April<br />
<strong>2010</strong>.<br />
University of Massachusetts, Amherst. Political Economy Research Institute. Job Opportunities for the <strong>Green</strong><br />
Economy: A state-by-state picture of occupations that gain from green investments. June 2008.<br />
Washington State Employment Security Department. Labor Market and Economic Analysis. 2008 Washington<br />
State <strong>Green</strong> Economy Jobs. January 2009.<br />
<strong>Workforce</strong> Information Council. Measurement and Analysis of Employment in the <strong>Green</strong> Economy. October<br />
2009.<br />
<strong>Hawai</strong>ÿi’s <strong>Green</strong> <strong>Workforce</strong>: A <strong>Baseline</strong> <strong>Assessment</strong> 49
Appendix A: Methodological Details<br />
The data presented here is predominantly based on a<br />
survey conducted from May to July <strong>2010</strong> of a random<br />
sample of 9,146 worksites drawn from the Quarterly<br />
Census of Employment and Wages (QCEW) database,<br />
which contains data on approximately 37,674<br />
private <strong>Hawai</strong>‘i worksites that report to the State’s<br />
Unemployment Insurance Division.<br />
To ensure a representative sample, the <strong>Hawai</strong>‘i<br />
Department of Labor and Industrial Relations (DLIR)<br />
mailed the survey to a cross-section (stratified sample)<br />
of the QCEW, including samples from all four<br />
counties -- O‘ahu, <strong>Hawai</strong>’i, Maui and Kaua‘i. It was<br />
important to stratify the sample by county to ensure<br />
that the uneven distribution of businesses across the<br />
state did not adversely skew the sample. 13<br />
Within each county, a cross-section of worksites was<br />
randomly chosen such that small (1-9 employees),<br />
medium (10-49 employees), and large worksites (50<br />
or more employees) would be represented. In order<br />
to obtain complete data on worksites with potentially<br />
very large numbers of green employees, or very<br />
small numbers of green employees relative to their<br />
total number of employees, all large worksites were<br />
sampled. This decreased the variance in the random<br />
sample of small and medium-sized worksites, thus<br />
increasing the power of the random sample.<br />
The sample was further stratified in order to get a<br />
cross-section of industries operating in <strong>Hawai</strong>‘i,<br />
including traditional industries and those thought<br />
likely to have a large representation of green jobs.<br />
By increasing the sample in NAICS codes likely<br />
to contain large numbers of green jobs, these highvariance<br />
strata were better covered and the power of<br />
the overall sample increased.<br />
All 23 private sectors in the North American Industry<br />
Classification System (NAICS, see inset) were<br />
randomly sampled, including: Agriculture, Forestry,<br />
13 Katalina McGlone contributed to the drafting of this section.<br />
50 <strong>Hawai</strong>ÿi’s <strong>Green</strong> <strong>Workforce</strong>: A <strong>Baseline</strong> <strong>Assessment</strong><br />
Fishing & Hunting (11); Mining (21); Construction<br />
(23); Manufacturing (31-33); Wholesale Trade (42);<br />
Retail Trade (44-45); Transportation and Warehousing<br />
(48-49); Utilities (22); Information (51); Finance and<br />
Insurance (52); Real Estate and Rental and Leasing<br />
(53); Professional, Scientific & Technical Services<br />
(54); Management of Companies and Enterprises<br />
(55); Administrative & Support & Waste Management<br />
& Remediation Services (56); Education Services<br />
(61); Health Care and Social Assistance (62); Arts<br />
Entertainment and Recreation (71); Accommodation<br />
and Food Services (72); and Other Services (except<br />
Public Administration) (81). Public Administration<br />
(92) was not sampled, but the public sector will be<br />
included in future samples (Table 21).<br />
The initial response to the survey mailing was 2,285<br />
completed surveys (referred to subsequently as Wave<br />
1) which arrived within a 10-day grace period of the<br />
June 4 th deadline. The initial response rate was thus<br />
24.98 percent. An aggressive follow-up strategy was<br />
implemented with non-responders, which yielded<br />
an additional 1,723 completed surveys (referred to<br />
subsequently as Wave 2). This brought the total<br />
response to 4,008 of the original 9,146 sampled<br />
worksites, or a response rate of 43.82 percent.<br />
Upon examination of the data, non-response bias was<br />
detected between Wave 1 and Wave 2 responders.<br />
To address this bias, a logistic regression was used<br />
to estimate propensity scores for prediction of likely<br />
responders and non-responders within the unsampled<br />
data. In the final estimation, the weight of Wave 1<br />
sample data was increased to estimate the number<br />
of green jobs for likely responders, and likewise,<br />
the weight of Wave 2 sample data was increased to<br />
estimate the number of green jobs for likely nonresponders.<br />
This method yielded an unbiased estimate<br />
of total green jobs.
Data<br />
The QCEW database formed the survey universe.<br />
The QCEW includes extensive descriptive detail<br />
on every employer that reports to <strong>Hawai</strong>‘i’s<br />
Unemployment Insurance (UI) Division. UI coverage<br />
is mandatory for most employers. At the time the<br />
sample was drawn, the latest available QCEW<br />
database was used, which was for the 3 rd quarter of<br />
2009. To get the most detailed county data possible,<br />
private employer QCEW records at the worksite level<br />
were used. Not sampled were employers with zero<br />
employees in the 3 rd month of the quarter (6,310 in<br />
September), or with no specific county designation<br />
(1,020 in September). These exclusions yielded<br />
a revised survey universe totaling 30,484 records<br />
(Figure 2).<br />
While most businesses in <strong>Hawai</strong>‘i correctly<br />
disaggregated their reports by worksite in the QCEW<br />
database, a small subset reported for all their <strong>Hawai</strong>‘i<br />
locations at once. We saw no reason to think that<br />
systematic bias would result from the foregoing and<br />
most businesses have only one worksite. Therefore,<br />
we assumed that all businesses reported by worksite.<br />
While we use the technical term “worksite” in the<br />
report, the data would be nearly identical if based on<br />
“businesses” or “employers” as the unit of analysis.<br />
Sample selection<br />
DLIR chose the sample size based on available<br />
resources. Neyman methods and a Monte Carlo<br />
simulation to determine the required sample for<br />
significance testing showed that a larger sample<br />
approaching the universe of data would be optimal.<br />
This large sample is preferable given: 1) the strong<br />
positive skew of the distribution of the quantity of<br />
jobs, 2) the mean of total green jobs in the sample is<br />
near 0 at 0.34, and 3) when compared to the mean, the<br />
variance is relatively high at 28.55 jobs. The suggested<br />
comprehensive survey of green jobs could be obtained<br />
with a rolling sample such that all companies were<br />
sampled at least once every 3-5 years.<br />
Table 21. Sample Size by Industry<br />
NAICS<br />
# of<br />
Worksites<br />
Share of<br />
Sampled Total<br />
11 Agriculture 177 1.9%<br />
21 Mining 16 0.2%<br />
22 Utilities 65 0.7%<br />
23 Construction 1,135 12.4%<br />
31-33 Manufacturing 413 4.5%<br />
42 Wholesale Trade 523 5.7%<br />
44-45 Retail Trade 1,174 12.8%<br />
48-49 Transportation/Warehousing 274 3.0%<br />
51 Information 149 1.6%<br />
52 Finance & Insurance 286 3.1%<br />
53 Real Estate & Rental & Leasing 344 3.8%<br />
54 Professional, Scientific, & Technical 1,038<br />
Services<br />
11.3%<br />
55 Management of Companies &<br />
Enterprises<br />
118 1.3%<br />
56 Administrative/Support/Waste<br />
Mgmt/Remediation Services<br />
715 7.8%<br />
61 Educational Services 241 2.6%<br />
62 Health Care & Social Assistance 678 7.4%<br />
71 Arts, Entertainment, & Recreation 179 2.0%<br />
72 Accomodation & Food Services 836 9.1%<br />
81 Other Services 785 8.6%<br />
TOTAL 9,146 100.0%<br />
The statistical program SPSS drew a disproportionate<br />
stratified random sample, which means businesses<br />
were drawn from some strata at a different proportion<br />
compared to others. Two principles guided the<br />
proportions used to select the sample from various<br />
strata:<br />
1) Ensure adequate representation from the<br />
smaller counties, businesses, and NAICS<br />
codes.<br />
2) Draw more heavily from strata thought to<br />
be more likely to contain the main variable<br />
of interest -- green jobs (“green” and “green<br />
2-digit NAICS” categories, and larger<br />
businesses). This provided more coverage of<br />
strata with most of the green jobs.<br />
<strong>Hawai</strong>ÿi’s <strong>Green</strong> <strong>Workforce</strong>: A <strong>Baseline</strong> <strong>Assessment</strong> 51
The stratified random sample, divided by county,<br />
size, “green or non-green,” and NAICS, required<br />
calculation of 312 non-certainty sample cells. Records<br />
were randomly sampled without replacement. A<br />
stratified sample guards against an unrepresentative<br />
sample that does not have adequate representation of<br />
various important strata (e.g., neighbor island counties<br />
and small-size businesses). Furthermore, data<br />
generated from a random sample can be generalized<br />
from the sample to the larger population.<br />
By giving a larger-than-proportionate sample size in<br />
one or more subgroups, a stratified sample ensures that<br />
sufficient sample data is obtained to support a separate<br />
analysis of any subgroup, such as by county, industry<br />
size, and 2-digit NAICS codes. For example, because<br />
fewer businesses were in the neighbor island counties<br />
than O‘ahu, worksites were over-sampled to ensure<br />
adequate numbers for meaningful reporting. Also<br />
over-sampled were businesses from the green NAICS<br />
codes, because they had more chance to contribute to<br />
the main variable of interest – green jobs. Worksites<br />
with greater than 50 employees were sampled with<br />
100 percent certainty because they were more likely<br />
to have some green jobs than were smaller businesses.<br />
Oversampling from green NAICS codes mitigated the<br />
effects of higher expected variance in these strata.<br />
The sample was primarily from the City and County<br />
of Honolulu (n = 5,559, 60.8 percent), followed by<br />
<strong>Hawai</strong>‘i (n = 1,447, 15.8 percent), Maui (n = 1,392,<br />
15.2 percent) and Kaua‘i (n = 748, 8.2 percent). The<br />
majority of the worksites had 1 – 9 employees (n<br />
= 5,044, 55.1 percent). The other size categories<br />
were 10 – 49 employees (n = 2,445, 26.7 percent)<br />
and businesses with 50+ employees; the latter were<br />
sampled with certainty, that is, 100 percent were in<br />
the sample (n = 1,657, 18.1 percent). Businesses from<br />
entire 4-digit NAICS industry codes which were more<br />
likely to have some green activities at the 6-digit<br />
level were considered green (n = 4,394, 48 percent).<br />
Businesses with non-green NAICS codes comprised<br />
52 percent of the sample (n = 4,752). All sample<br />
universe worksites in strata with 15 or fewer worksites<br />
were selected with certainty. If the strata had fewer<br />
than 10 worksites after proportioning, then all were<br />
selected from the cell.<br />
Analysts iterated through cell proportion modifications<br />
until an optimal mix of overall sample size and<br />
individual cell sample coverage was reached. For<br />
employment size class 1 (1-9), we sampled 30 percent<br />
52 <strong>Hawai</strong>ÿi’s <strong>Green</strong> <strong>Workforce</strong>: A <strong>Baseline</strong> <strong>Assessment</strong><br />
of green industries on O‘ahu and 45 percent from the<br />
neighbor islands. For employment size 2, 45 percent<br />
of green industries on O‘ahu were sampled, compared<br />
to 55 percent from the neighbor islands. For size 1,<br />
non-green, 15 percent were sampled from all counties.<br />
For size 2 non-green, 20 percent were sampled from<br />
all counties.<br />
Stratification:<br />
County<br />
The sample was stratified by <strong>Hawai</strong>‘i ’s four counties:<br />
Honolulu (O‘ahu), <strong>Hawai</strong>‘i , Maui, and Kaua‘i. It was<br />
important to stratify the sample by county to ensure<br />
that there was adequate geographic representation in<br />
the sample from all four counties. O‘ahu has about<br />
two-thirds of the QCEW worksites.<br />
Worksite Size<br />
<strong>Hawai</strong>‘i’s businesses were categorized by number of<br />
employees into three groups: 1-9, 10-49, and 50+.<br />
Because there were a disproportionate number of<br />
business worksites across employment size categories,<br />
it was important to stratify the sample by number of<br />
employees. Based on the hypothesis that the larger<br />
the firm, the more likely the firm is to have at least<br />
one green job, larger firms were sampled with higher<br />
probability of being selected. All of the largest firms<br />
(50+ employees) were included in the sample, that<br />
is they were sampled with 100 percent certainty.<br />
Because the smallest firms (1-9 employees) have a<br />
smaller probability of having at least one green job,<br />
they were sampled at a lower proportion. Thus, even<br />
though the smallest businesses comprised about threequarters<br />
of <strong>Hawai</strong>‘i worksites, they were only about<br />
one-half of the sample.<br />
<strong>Green</strong> / Non-green<br />
Because of the limited resources available to conduct<br />
a survey, industries with a higher incidence of green<br />
jobs were sampled with higher probability. These<br />
select green industries were referenced as such in the<br />
State of <strong>Hawai</strong>‘i <strong>Workforce</strong> Report produced by the<br />
<strong>Hawai</strong>‘i <strong>Workforce</strong> Development Council, which was<br />
guided by the PEW Charitable Trusts report.
After critical review of remaining NAICS by both<br />
the <strong>Hawai</strong>‘i Labor Market Research Section and the<br />
<strong>Hawai</strong>‘i <strong>Green</strong> Jobs Initiative Team, several additional<br />
industries were designated as green. All told, there<br />
were 113 NAICS 4-digit level industry codes that<br />
<strong>Hawai</strong>‘i classified as green. However, it should be<br />
noted that ALL the remaining non-green industries at<br />
the 2-digit NAICS level were sampled, though at a<br />
much lower rate than those in the 4-digit NAICS green<br />
industries.<br />
For purposes of stratification, “green” means that at<br />
least a small number of codes at the 6-digit level in<br />
that particular 2-digit NAICS were likely green. The<br />
entire 4-digit NAICS was categorized green, even<br />
though most of the jobs within those codes are likely<br />
to be non-green.<br />
Industry (NAICS )<br />
Not including Public Administration, there are 23<br />
2-digit NAICS codes that cover 19 industrial sectors.<br />
Of these 2-digit NAICS, 16 contained the presence of<br />
at least some green 4-digit NAICS codes. Because the<br />
remainder of these 16 NAICS are not classified green,<br />
it is required that there be two separate sampling cells<br />
for each individual 2-digit NAICS, green and nongreen.<br />
In addition, there were seven 2-digit NAICS<br />
that had no “green” 4-digit NAICS. Thus, these<br />
individual 2-digit NAICS strata only require one cell,<br />
non-green, for purposes of sample selection. For the<br />
sample size of each NAICS strata, see Table 21.<br />
Estimation<br />
After random sampling and data collection, the<br />
following estimation procedure was followed.<br />
1) Sum across <strong>Green</strong> job descriptions in the sample<br />
data and remove non-unique survey IDs (multiple<br />
job descriptions for one employer)<br />
a. Out of business worksites (OOBs) are<br />
counted as 0 jobs for purposes of summing<br />
and weighting of green jobs for all<br />
categories. For example, if ½ of a sample<br />
cell is composed of OOBs, then infer ½<br />
OOBs in the universe cell (0 jobs for half<br />
of the cell population).<br />
2) Divide data into Wave 1 (data received prior to<br />
June 14) and Wave 2 (data received on or after<br />
June 14). The cut-off date, June 14, was chosen<br />
because it provided respondents with a ten-day<br />
grace period, and coincided with the start of an<br />
intensive campaign to improve response using<br />
phone calls, emails, postcard reminders, and<br />
additional survey mailings to nonrespondents.<br />
3) Make histograms and determine summaries<br />
comparing Wave 1 covariates (NAICS, Size,<br />
<strong>Green</strong>, etc) to Wave 2 covariates, and do a Z-test to<br />
determine whether systematic bias in Wave 1 and<br />
Wave 2 data is likely. The Z-test showed with 90<br />
percent certainty that bias existed between Wave<br />
1 and Wave 2 in terms of size category. This nonresponse<br />
bias will be corrected in estimation of<br />
green jobs in the universe below.<br />
4) Load data from QCEW universe<br />
a. Use file “UNIVERSEEQUI093.csv”<br />
5) Estimate logit model from the sample data<br />
stratified between Wave 1 and Wave 2 data to use<br />
for the propensity to respond variable (propensity<br />
score) in the universe of data. Wave 1 sample data<br />
will then be used to infer green jobs in the universe<br />
of likely responders, and Wave 2 sample data will<br />
be used to infer green jobs in the universe of likely<br />
non-responders. This procedure removes any nonresponse<br />
bias that may exist.<br />
a. Linear model: logit(y=BX+e)<br />
Logit(Responder = B(<strong>Green</strong>+C2.NAICS+<br />
County+Size)+e), where B is a vector of<br />
Four coefficients estimated by logistic<br />
regression.<br />
b. The model resulting from the Wave 1 and<br />
Wave 2 sample data is used to predict<br />
which unsampled observations would<br />
have been likely to respond or not respond<br />
(given their covariates – <strong>Green</strong>, NAICS,<br />
County, and Size). This is the unsampled<br />
worksite’s “propensity” to respond. Those<br />
with the highest propensity to respond<br />
(with cutoff propensity = x) are coded<br />
as Responders. The cutoff propensity is<br />
determined such that the proportion of<br />
responders in the universe of data equals<br />
the proportion of responders in the sample,<br />
<strong>Hawai</strong>ÿi’s <strong>Green</strong> <strong>Workforce</strong>: A <strong>Baseline</strong> <strong>Assessment</strong> 53
and such that green jobs for each strata in<br />
the universe is estimated with at least 25<br />
percent of the inference resulting from data<br />
from each response category (Wave 1 and<br />
Wave 2).<br />
6) Stratify both sample and universe data on <strong>Green</strong>,<br />
NAICS, County Code, Size, and Responder status.<br />
a. Calculate number of companies per bin for<br />
both sample and universe of data<br />
b. Calculate number of green jobs per bin for<br />
the sample data<br />
7) Calculate weights per bin, w_b, whereby w_b<br />
multiplied by the number of green jobs in the<br />
sample bin will be the best unbiased estimate for<br />
the number of green jobs per universe bin.<br />
8) Apply the method above to all jobs data, including<br />
current jobs, current vacancies, and jobs projected<br />
in 2012.<br />
9) Calculate change in green jobs between <strong>2010</strong> and<br />
2012 per strata as projected green jobs in 2012<br />
minus current green jobs in <strong>2010</strong>.<br />
54 <strong>Hawai</strong>ÿi’s <strong>Green</strong> <strong>Workforce</strong>: A <strong>Baseline</strong> <strong>Assessment</strong>
Appendix B: NAICS in Sample<br />
NAICS 2007 NAICS TITLES<br />
111150 Corn Farming<br />
111211 Potato Farming<br />
111219 Other Vegetable (except Potato) and Melon<br />
Farming<br />
111335 Tree Nut Farming<br />
111336 Fruit and Tree Nut Combination Farming<br />
111339 Other Noncitrus Fruit Farming<br />
111411 Mushroom Production<br />
111419 Other Food Crops Grown Under Cover<br />
111421 Nursery and Tree Production<br />
111422 Floriculture Production<br />
111930 Sugarcane Farming<br />
111998 All Other Miscellaneous Crop Farming<br />
112111 Beef Cattle Ranching and Farming<br />
112120 Dairy Cattle and Milk Production<br />
112310 Chicken Egg Production<br />
112420 Goat Farming<br />
112511 Finfish Farming and Fish Hatcheries<br />
112512 Shellfish Farming<br />
112519 Other Aquaculture<br />
112910 Apiculture<br />
112920 Horses and Other Equine Production<br />
113210 Forest Nurseries and Gathering of Forest<br />
Products<br />
113310 Logging<br />
114111 Finfish Fishing<br />
114112 Shellfish Fishing<br />
115114 Postharvest Crop Activities (except Cotton<br />
Ginning)<br />
115115 Farm Labor Contractors and Crew Leaders<br />
115116 Farm Management Services<br />
115210 Support Activities for Animal Production<br />
115310 Support Activities for Forestry<br />
211111 Crude Petroleum and Natural Gas Extraction<br />
212319 Other Crushed and Broken Stone Mining and<br />
Quarrying<br />
212321 Construction Sand and Gravel Mining<br />
Source: DLIR Research & Statistics Office, <strong>Hawai</strong>ÿi <strong>Green</strong> Jobs<br />
Survey, <strong>2010</strong>.<br />
212325 Clay and Ceramic and Refractory Minerals<br />
Mining<br />
212399 All Other Nonmetallic Mineral Mining<br />
213112 Support Activities for Oil and Gas Operations<br />
221112 Fossil Fuel Electric Power Generation<br />
221119 Other Electric Power Generation<br />
221210 Natural Gas Distribution<br />
221310 Water Supply and Irrigation Systems<br />
221320 Sewage Treatment Facilities<br />
221330 Steam and Air-Conditioning Supply<br />
236115 New Single-Family Housing Construction<br />
(except Operative Builders)<br />
236116 New Multifamily Housing Construction (except<br />
Operative Builders)<br />
236117 New Housing Operative Builders<br />
236118 Residential Remodelers<br />
236210 Industrial Building Construction<br />
236220 Commercial and Institutional Building<br />
Construction<br />
237110 Water and Sewer Line and Related Structures<br />
Construction<br />
237120 Oil and Gas Pipeline and Related Structures<br />
Construction<br />
237130 Power and Communication Line and Related<br />
Structures Construction<br />
237210 Land Subdivision<br />
237310 Highway, Street, and Bridge Construction<br />
237990 Other Heavy and Civil Engineering Construction<br />
238110 Poured Concrete Foundation and Structure<br />
Contractors<br />
238120 Structural Steel and Precast Concrete<br />
Contractors<br />
238130 Framing Contractors<br />
238140 Masonry Contractors<br />
238150 Glass and Glazing Contractors<br />
238160 Roofing Contractors<br />
238170 Siding Contractors<br />
238190 Other Foundation, Structure, and Building<br />
Exterior Contractors<br />
238210 Electrical Contractors and Other Wiring<br />
Installation Contractors<br />
<strong>Hawai</strong>ÿi’s <strong>Green</strong> <strong>Workforce</strong>: A <strong>Baseline</strong> <strong>Assessment</strong> 55
Appendix B: NAICS in Sample (continued)<br />
238220 Plumbing, Heating, and Air-Conditioning<br />
Contractors<br />
238290 Other Building Equipment Contractors<br />
238310 Drywall and Insulation Contractors<br />
238320 Painting and Wall Covering Contractors<br />
238330 Flooring Contractors<br />
238340 Tile and Terrazzo Contractors<br />
238350 Finish Carpentry Contractors<br />
238390 Other Building Finishing Contractors<br />
238910 Site Preparation Contractors<br />
238990 All Other Specialty Trade Contractors<br />
311111 Dog and Cat Food Manufacturing<br />
311212 Rice Milling<br />
311311 Sugarcane Mills<br />
311330 Confectionery Manufacturing from Purchased<br />
Chocolate<br />
311340 Nonchocolate Confectionery Manufacturing<br />
311421 Fruit and Vegetable Canning<br />
311423 Dried and Dehydrated Food Manufacturing<br />
311511 Fluid Milk Manufacturing<br />
311513 Cheese Manufacturing<br />
311520 Ice Cream and Frozen Dessert Manufacturing<br />
311611 Animal (except Poultry) Slaughtering<br />
311612 Meat Processed from Carcasses<br />
311613 Rendering and Meat Byproduct Processing<br />
311711 Seafood Canning<br />
311712 Fresh and Frozen Seafood Processing<br />
311811 Retail Bakeries<br />
311812 Commercial Bakeries<br />
311821 Cookie and Cracker Manufacturing<br />
311823 Dry Pasta Manufacturing<br />
311911 Roasted Nuts and Peanut Butter Manufacturing<br />
311919 Other Snack Food Manufacturing<br />
311920 Coffee and Tea Manufacturing<br />
311930 Flavoring Syrup and Concentrate Manufacturing<br />
311941 Mayonnaise, Dressing, and Other Prepared<br />
Sauce Manufacturing<br />
311942 Spice and Extract Manufacturing<br />
311991 Perishable Prepared Food Manufacturing<br />
311999 All Other Miscellaneous Food Manufacturing<br />
312111 Soft Drink Manufacturing<br />
312112 Bottled Water Manufacturing<br />
312113 Ice Manufacturing<br />
56 <strong>Hawai</strong>ÿi’s <strong>Green</strong> <strong>Workforce</strong>: A <strong>Baseline</strong> <strong>Assessment</strong><br />
312120 Breweries<br />
312130 Wineries<br />
312140 Distilleries<br />
313311 Broadwoven Fabric Finishing Mills<br />
313312 Textile and Fabric Finishing (except Broadwoven<br />
Fabric) Mills<br />
314121 Curtain and Drapery Mills<br />
314129 Other Household Textile Product Mills<br />
314912 Canvas and Related Product Mills<br />
314999 All Other Miscellaneous Textile Product Mills<br />
315211 Men’s and Boys’ Cut and Sew Apparel<br />
Contractors<br />
315212 Women’s, Girls’, and Infants’ Cut and Sew<br />
Apparel Contractors<br />
315222 Men’s and Boys’ Cut and Sew Suit, Coat, and<br />
Overcoat Manufacturing<br />
315223 Men’s and Boys’ Cut and Sew Shirt (except<br />
Work Shirt) Manufacturing<br />
315225 Men’s and Boys’ Cut and Sew Work Clothing<br />
Manufacturing<br />
315232 Women’s and Girls’ Cut and Sew Blouse and<br />
Shirt Manufacturing<br />
315233 Women’s and Girls’ Cut and Sew Dress<br />
Manufacturing<br />
315239 Women’s and Girls’ Cut and Sew Other<br />
Outerwear Manufacturing<br />
315291 Infants’ Cut and Sew Apparel Manufacturing<br />
315999 Other Apparel Accessories and Other Apparel<br />
Manufacturing<br />
321113 Sawmills<br />
321114 Wood Preservation<br />
321214 Truss Manufacturing<br />
321911 Wood Window and Door Manufacturing<br />
321918 Other Millwork (including Flooring)<br />
321999 All Other Miscellaneous Wood Product<br />
Manufacturing<br />
322299 All Other Converted Paper Product<br />
Manufacturing<br />
323110 Commercial Lithographic Printing<br />
323112 Commercial Flexographic Printing<br />
323113 Commercial Screen Printing<br />
323114 Quick Printing<br />
323115 Digital Printing<br />
323119 Other Commercial Printing<br />
324110 Petroleum Refineries<br />
324121 Asphalt Paving Mixture and Block Manufacturing
325120 Industrial Gas Manufacturing<br />
325188 All Other Basic Inorganic Chemical<br />
Manufacturing<br />
325314 Fertilizer (Mixing Only) Manufacturing<br />
325412 Pharmaceutical Preparation Manufacturing<br />
325611 Soap and Other Detergent Manufacturing<br />
325620 Toilet Preparation Manufacturing<br />
326111 Plastics Bag and Pouch Manufacturing<br />
326121 Unlaminated Plastics Profile Shape<br />
Manufacturing<br />
326160 Plastics Bottle Manufacturing<br />
326199 All Other Plastics Product Manufacturing<br />
326212 Tire Retreading<br />
327112 Vitreous China, Fine Earthenware, and Other<br />
Pottery Product Manufacturing<br />
327122 Ceramic Wall and Floor Tile Manufacturing<br />
327212 Other Pressed and Blown Glass and Glassware<br />
Manufacturing<br />
327215 Glass Product Manufacturing Made of<br />
Purchased Glass<br />
327320 Ready-Mix Concrete Manufacturing<br />
327331 Concrete Block and Brick Manufacturing<br />
327332 Concrete Pipe Manufacturing<br />
327390 Other Concrete Product Manufacturing<br />
327991 Cut Stone and Stone Product Manufacturing<br />
327999 All Other Miscellaneous Nonmetallic Mineral<br />
Product Manufacturing<br />
332311 Prefabricated Metal Building and Component<br />
Manufacturing<br />
332313 Plate Work Manufacturing<br />
332321 Metal Window and Door Manufacturing<br />
332322 Sheet Metal Work Manufacturing<br />
332323 Ornamental and Architectural Metal Work<br />
Manufacturing<br />
332431 Metal Can Manufacturing<br />
332510 Hardware Manufacturing<br />
332710 Machine Shops<br />
332812 Metal Coating, Engraving (except Jewelry<br />
and Silverware), and Allied Services to<br />
Manufacturers<br />
333111 Farm Machinery and Equipment Manufacturing<br />
333314 Optical Instrument and Lens Manufacturing<br />
333319 Other Commercial and Service Industry<br />
Machinery Manufacturing<br />
Appendix B: NAICS in Sample (continued)<br />
334413 Semiconductor and Related Device<br />
Manufacturing<br />
334511 Search, Detection, Navigation, Guidance,<br />
Aeronautical, and Nautical System and<br />
Instrument Manufacturing<br />
334517 Irradiation Apparatus Manufacturing<br />
335121 Residential Electric Lighting Fixture<br />
Manufacturing<br />
335991 Carbon and Graphite Product Manufacturing<br />
336350 Motor Vehicle Transmission and Power Train<br />
Parts Manufacturing<br />
336611 Ship Building and Repairing<br />
336612 Boat Building<br />
337110 Wood Kitchen Cabinet and Countertop<br />
Manufacturing<br />
337122 Nonupholstered Wood Household Furniture<br />
Manufacturing<br />
337125 Household Furniture (except Wood and Metal)<br />
Manufacturing<br />
337211 Wood Office Furniture Manufacturing<br />
339113 Surgical Appliance and Supplies Manufacturing<br />
339115 Ophthalmic Goods Manufacturing<br />
339116 Dental Laboratories<br />
339911 Jewelry (except Costume) Manufacturing<br />
339914 Costume Jewelry and Novelty Manufacturing<br />
339920 Sporting and Athletic Goods Manufacturing<br />
339950 Sign Manufacturing<br />
339992 Musical Instrument Manufacturing<br />
339999 All Other Miscellaneous Manufacturing<br />
423120 Motor Vehicle Supplies and New Parts Merchant<br />
Wholesalers<br />
423130 Tire and Tube Merchant Wholesalers<br />
423140 Motor Vehicle Parts (Used) Merchant<br />
Wholesalers<br />
423210 Furniture Merchant Wholesalers<br />
423220 Home Furnishing Merchant Wholesalers<br />
423310 Lumber, Plywood, Millwork, and Wood Panel<br />
Merchant Wholesalers<br />
423320 Brick, Stone, and Related Construction Material<br />
Merchant Wholesalers<br />
423330 Roofing, Siding, and Insulation Material<br />
Merchant Wholesalers<br />
423390 Other Construction Material Merchant<br />
Wholesalers<br />
423410 Photographic Equipment and Supplies Merchant<br />
Wholesalers<br />
<strong>Hawai</strong>ÿi’s <strong>Green</strong> <strong>Workforce</strong>: A <strong>Baseline</strong> <strong>Assessment</strong> 57
Appendix B: NAICS in Sample (continued)<br />
423420 Office Equipment Merchant Wholesalers<br />
423430 Computer and Computer Peripheral Equipment<br />
and Software Merchant Wholesalers<br />
423440 Other Commercial Equipment Merchant<br />
Wholesalers<br />
423450 Medical, Dental, and Hospital Equipment and<br />
Supplies Merchant Wholesalers<br />
423460 Ophthalmic Goods Merchant Wholesalers<br />
423490 Other Professional Equipment and Supplies<br />
Merchant Wholesalers<br />
423510 Metal Service Centers and Other Metal<br />
Merchant Wholesalers<br />
423610 Electrical Apparatus and Equipment, Wiring<br />
Supplies, and Related Equipment Merchant<br />
Wholesalers<br />
423620 Electrical and Electronic Appliance, Television,<br />
and Radio Set Merchant Wholesalers<br />
423690 Other Electronic Parts and Equipment Merchant<br />
Wholesalers<br />
423710 Hardware Merchant Wholesalers<br />
423720 Plumbing and Heating Equipment and Supplies<br />
(Hydronics) Merchant Wholesalers<br />
423730 Warm Air Heating and Air-Conditioning<br />
Equipment and Supplies Merchant Wholesalers<br />
423740 Refrigeration Equipment and Supplies Merchant<br />
Wholesalers<br />
423810 Construction and Mining (except Oil Well)<br />
Machinery and Equipment Merchant<br />
Wholesalers<br />
423820 Farm and Garden Machinery and Equipment<br />
Merchant Wholesalers<br />
423830 Industrial Machinery and Equipment Merchant<br />
Wholesalers<br />
423840 Industrial Supplies Merchant Wholesalers<br />
423850 Service Establishment Equipment and Supplies<br />
Merchant Wholesalers<br />
423860 Transportation Equipment and Supplies (except<br />
Motor Vehicle) Merchant Wholesalers<br />
423910 Sporting and Recreational Goods and Supplies<br />
Merchant Wholesalers<br />
423920 Toy and Hobby Goods and Supplies Merchant<br />
Wholesalers<br />
423930 Recyclable Material Merchant Wholesalers<br />
423940 Jewelry, Watch, Precious Stone, and Precious<br />
Metal Merchant Wholesalers<br />
423990 Other Miscellaneous Durable Goods Merchant<br />
Wholesalers<br />
58 <strong>Hawai</strong>ÿi’s <strong>Green</strong> <strong>Workforce</strong>: A <strong>Baseline</strong> <strong>Assessment</strong><br />
424110 Printing and Writing Paper Merchant<br />
Wholesalers<br />
424120 Stationery and Office Supplies Merchant<br />
Wholesalers<br />
424130 Industrial and Personal Service Paper Merchant<br />
Wholesalers<br />
424210 Drugs and Druggists’ Sundries Merchant<br />
Wholesalers<br />
424310 Piece Goods, Notions, and Other Dry Goods<br />
Merchant Wholesalers<br />
424320 Men’s and Boys’ Clothing and Furnishings<br />
Merchant Wholesalers<br />
424330 Women’s, Children’s, and Infants’ Clothing and<br />
Accessories Merchant Wholesalers<br />
424340 Footwear Merchant Wholesalers<br />
424410 General Line Grocery Merchant Wholesalers<br />
424420 Packaged Frozen Food Merchant Wholesalers<br />
424430 Dairy Product (except Dried or Canned)<br />
Merchant Wholesalers<br />
424440 Poultry and Poultry Product Merchant<br />
Wholesalers<br />
424450 Confectionery Merchant Wholesalers<br />
424460 Fish and Seafood Merchant Wholesalers<br />
424470 Meat and Meat Product Merchant Wholesalers<br />
424480 Fresh Fruit and Vegetable Merchant<br />
Wholesalers<br />
424490 Other Grocery and Related Products Merchant<br />
Wholesalers<br />
424610 Plastics Materials and Basic Forms and Shapes<br />
Merchant Wholesalers<br />
424690 Other Chemical and Allied Products Merchant<br />
Wholesalers<br />
424710 Petroleum Bulk Stations and Terminals<br />
424720 Petroleum and Petroleum Products Merchant<br />
Wholesalers (except Bulk Stations and<br />
Terminals)<br />
424810 Beer and Ale Merchant Wholesalers<br />
424820 Wine and Distilled Alcoholic Beverage Merchant<br />
Wholesalers<br />
424910 Farm Supplies Merchant Wholesalers<br />
424920 Book, Periodical, and Newspaper Merchant<br />
Wholesalers<br />
424930 Flower, Nursery Stock, and Florists’ Supplies<br />
Merchant Wholesalers<br />
424940 Tobacco and Tobacco Product Merchant<br />
Wholesalers
424950 Paint, Varnish, and Supplies Merchant<br />
Wholesalers<br />
424990 Other Miscellaneous Nondurable Goods<br />
Merchant Wholesalers<br />
425120 Wholesale Trade Agents and Brokers<br />
441110 New Car Dealers<br />
441120 Used Car Dealers<br />
441221 Motorcycle, ATV, and Personal Watercraft<br />
Dealers<br />
441222 Boat Dealers<br />
441310 Automotive Parts and Accessories Stores<br />
441320 Tire Dealers<br />
442110 Furniture Stores<br />
442210 Floor Covering Stores<br />
442291 Window Treatment Stores<br />
442299 All Other Home Furnishings Stores<br />
443111 Household Appliance Stores<br />
443112 Radio, Television, and Other Electronics Stores<br />
443120 Computer and Software Stores<br />
443130 Camera and Photographic Supplies Stores<br />
444110 Home Centers<br />
444130 Hardware Stores<br />
444190 Other Building Material Dealers<br />
444210 Outdoor Power Equipment Stores<br />
444220 Nursery, Garden Center, and Farm Supply<br />
Stores<br />
445110 Supermarkets and Other Grocery (except<br />
Convenience) Stores<br />
445120 Convenience Stores<br />
445210 Meat Markets<br />
445220 Fish and Seafood Markets<br />
445230 Fruit and Vegetable Markets<br />
445291 Baked Goods Stores<br />
445292 Confectionery and Nut Stores<br />
445299 All Other Specialty Food Stores<br />
445310 Beer, Wine, and Liquor Stores<br />
446110 Pharmacies and Drug Stores<br />
446120 Cosmetics, Beauty Supplies, and Perfume<br />
Stores<br />
446130 Optical Goods Stores<br />
446191 Food (Health) Supplement Stores<br />
446199 All Other Health and Personal Care Stores<br />
447110 Gasoline Stations with Convenience Stores<br />
447190 Other Gasoline Stations<br />
Appendix B: NAICS in Sample (continued)<br />
448110 Men’s Clothing Stores<br />
448120 Women’s Clothing Stores<br />
448130 Children’s and Infants’ Clothing Stores<br />
448140 Family Clothing Stores<br />
448150 Clothing Accessories Stores<br />
448190 Other Clothing Stores<br />
448210 Shoe Stores<br />
448310 Jewelry Stores<br />
448320 Luggage and Leather Goods Stores<br />
451110 Sporting Goods Stores<br />
451120 Hobby, Toy, and Game Stores<br />
451130 Sewing, Needlework, and Piece Goods Stores<br />
451140 Musical Instrument and Supplies Stores<br />
451211 Book Stores<br />
451212 News Dealers and Newsstands<br />
451220 Prerecorded Tape, Compact Disc, and Record<br />
Stores<br />
452111 Department Stores (except Discount<br />
Department Stores)<br />
452112 Discount Department Stores<br />
452910 Warehouse Clubs and Supercenters<br />
452990 All Other General Merchandise Stores<br />
453110 Florists<br />
453210 Office Supplies and Stationery Stores<br />
453220 Gift, Novelty, and Souvenir Stores<br />
453310 Used Merchandise Stores<br />
453910 Pet and Pet Supplies Stores<br />
453920 Art Dealers<br />
453991 Tobacco Stores<br />
453998 All Other Miscellaneous Store Retailers (except<br />
Tobacco Stores)<br />
454111 Electronic Shopping<br />
454113 Mail-Order Houses<br />
454210 Vending Machine Operators<br />
454311 Heating Oil Dealers<br />
454312 Liquefied Petroleum Gas (Bottled Gas) Dealers<br />
454390 Other Direct Selling Establishments<br />
481111 Scheduled Passenger Air Transportation<br />
481112 Scheduled Freight Air Transportation<br />
481211 Nonscheduled Chartered Passenger Air<br />
Transportation<br />
481212 Nonscheduled Chartered Freight Air<br />
Transportation<br />
483113 Coastal and Great Lakes Freight Transportation<br />
<strong>Hawai</strong>ÿi’s <strong>Green</strong> <strong>Workforce</strong>: A <strong>Baseline</strong> <strong>Assessment</strong> 59
Appendix B: NAICS in Sample (continued)<br />
483114 Coastal and Great Lakes Passenger<br />
Transportation<br />
484110 General Freight Trucking, Local<br />
484122 General Freight Trucking, Long-Distance, Less<br />
Than Truckload<br />
484210 Used Household and Office Goods Moving<br />
484220 Specialized Freight (except Used Goods)<br />
Trucking, Local<br />
485310 Taxi Service<br />
485320 Limousine Service<br />
485410 School and Employee Bus Transportation<br />
485991 Special Needs Transportation<br />
485999 All Other Transit and Ground Passenger<br />
Transportation<br />
487110 Scenic and Sightseeing Transportation, Land<br />
487210 Scenic and Sightseeing Transportation, Water<br />
487990 Scenic and Sightseeing Transportation, Other<br />
488119 Other Airport Operations<br />
488190 Other Support Activities for Air Transportation<br />
488320 Marine Cargo Handling<br />
488390 Other Support Activities for Water Transportation<br />
488410 Motor Vehicle Towing<br />
488490 Other Support Activities for Road Transportation<br />
488510 Freight Transportation Arrangement<br />
488991 Packing and Crating<br />
488999 All Other Support Activities for Transportation<br />
491110 Postal Service<br />
492110 Couriers and Express Delivery Services<br />
492210 Local Messengers and Local Delivery<br />
493110 General Warehousing and Storage<br />
493120 Refrigerated Warehousing and Storage<br />
493190 Other Warehousing and Storage<br />
511110 Newspaper Publishers<br />
511120 Periodical Publishers<br />
511130 Book Publishers<br />
511140 Directory and Mailing List Publishers<br />
511191 Greeting Card Publishers<br />
511210 Software Publishers<br />
512110 Motion Picture and Video Production<br />
512131 Motion Picture Theaters (except Drive-Ins)<br />
512191 Teleproduction and Other Postproduction<br />
Services<br />
512210 Record Production<br />
512240 Sound Recording Studios<br />
60 <strong>Hawai</strong>ÿi’s <strong>Green</strong> <strong>Workforce</strong>: A <strong>Baseline</strong> <strong>Assessment</strong><br />
515111 Radio Networks<br />
515112 Radio Stations<br />
515120 Television Broadcasting<br />
515210 Cable and Other Subscription Programming<br />
517110 Wired Telecommunications Carriers<br />
517210 Wireless Telecommunications Carriers (except<br />
Satellite)<br />
517911 Telecommunications Resellers<br />
517919 All Other Telecommunications<br />
518210 Data Processing, Hosting, and Related Services<br />
519120 Libraries and Archives<br />
519130 Internet Publishing and Broadcasting and Web<br />
Search Portals<br />
522110 Commercial Banking<br />
522120 Savings Institutions<br />
522130 Credit Unions<br />
522220 Sales Financing<br />
522291 Consumer Lending<br />
522292 Real Estate Credit<br />
522298 All Other Nondepository Credit Intermediation<br />
522310 Mortgage and Nonmortgage Loan Brokers<br />
522390 Other Activities Related to Credit Intermediation<br />
523110 Investment Banking and Securities Dealing<br />
523120 Securities Brokerage<br />
523130 Commodity Contracts Dealing<br />
523910 Miscellaneous Intermediation<br />
523920 Portfolio Management<br />
523930 Investment Advice<br />
523999 Miscellaneous Financial Investment Activities<br />
524113 Direct Life Insurance Carriers<br />
524114 Direct Health and Medical Insurance Carriers<br />
524126 Direct Property and Casualty Insurance Carriers<br />
524127 Direct Title Insurance Carriers<br />
524128 Other Direct Insurance (except Life, Health, and<br />
Medical) Carriers<br />
524210 Insurance Agencies and Brokerages<br />
524291 Claims Adjusting<br />
524292 Third Party Administration of Insurance and<br />
Pension Funds<br />
524298 All Other Insurance Related Activities<br />
525920 Trusts, Estates, and Agency Accounts<br />
525990 Other Financial Vehicles<br />
531110 Lessors of Residential Buildings and Dwellings
531120 Lessors of Nonresidential Buildings (except<br />
Miniwarehouses)<br />
531130 Lessors of Miniwarehouses and Self-Storage<br />
Units<br />
531190 Lessors of Other Real Estate Property<br />
531210 Offices of Real Estate Agents and Brokers<br />
531311 Residential Property Managers<br />
531312 Nonresidential Property Managers<br />
531320 Offices of Real Estate Appraisers<br />
531390 Other Activities Related to Real Estate<br />
532111 Passenger Car Rental<br />
532120 Truck, Utility Trailer, and RV (Recreational<br />
Vehicle) Rental and Leasing<br />
532210 Consumer Electronics and Appliances Rental<br />
532220 Formal Wear and Costume Rental<br />
532230 Video Tape and Disc Rental<br />
532291 Home Health Equipment Rental<br />
532292 Recreational Goods Rental<br />
532299 All Other Consumer Goods Rental<br />
532411 Commercial Air, Rail, and Water Transportation<br />
Equipment Rental and Leasing<br />
532412 Construction, Mining, and Forestry Machinery<br />
and Equipment Rental and Leasing<br />
532490 Other Commercial and Industrial Machinery and<br />
Equipment Rental and Leasing<br />
533110 Lessors of Nonfinancial Intangible Assets<br />
(except Copyrighted Works)<br />
541110 Offices of Lawyers<br />
541191 Title Abstract and Settlement Offices<br />
541199 All Other Legal Services<br />
541211 Offices of Certified Public Accountants<br />
541213 Tax Preparation Services<br />
541214 Payroll Services<br />
541219 Other Accounting Services<br />
541310 Architectural Services<br />
541320 Landscape Architectural Services<br />
541330 Engineering Services<br />
541340 Drafting Services<br />
541350 Building Inspection Services<br />
541360 Geophysical Surveying and Mapping Services<br />
541370 Surveying and Mapping (except Geophysical)<br />
Services<br />
541380 Testing Laboratories<br />
541410 Interior Design Services<br />
541420 Industrial Design Services<br />
Appendix B: NAICS in Sample (continued)<br />
541430 Graphic Design Services<br />
541490 Other Specialized Design Services<br />
541511 Custom Computer Programming Services<br />
541512 Computer Systems Design Services<br />
541513 Computer Facilities Management Services<br />
541519 Other Computer Related Services<br />
541611 Administrative Management and General<br />
Management Consulting Services<br />
541612 Human Resources Consulting Services<br />
541613 Marketing Consulting Services<br />
541614 Process, Physical Distribution, and Logistics<br />
Consulting Services<br />
541618 Other Management Consulting Services<br />
541620 Environmental Consulting Services<br />
541690 Other Scientific and Technical Consulting<br />
Services<br />
541711 Research and Development in Biotechnology<br />
541712 Reseach and Development in the Physical,<br />
Engineering, and Life Sciences (except<br />
Biotechnology)<br />
541720 Research and Development in the Social<br />
Sciences and Humanities<br />
541810 Advertising Agencies<br />
541820 Public Relations Agencies<br />
541830 Media Buying Agencies<br />
541840 Media Representatives<br />
541850 Display Advertising<br />
541890 Other Services Related to Advertising<br />
541910 Marketing Research and Public Opinion Polling<br />
541921 Photography Studios, Portrait<br />
541922 Commercial Photography<br />
541930 Translation and Interpretation Services<br />
541940 Veterinary Services<br />
541990 All Other Professional, Scientific, and Technical<br />
Services<br />
551112 Offices of Other Holding Companies<br />
551114 Corporate, Subsidiary, and Regional Managing<br />
Offices<br />
561110 Office Administrative Services<br />
561210 Facilities Support Services<br />
561311 Employment Placement Agencies<br />
561312 Executive Search Services<br />
561320 Temporary Help Services<br />
561330 Professional Employer Organizations<br />
<strong>Hawai</strong>ÿi’s <strong>Green</strong> <strong>Workforce</strong>: A <strong>Baseline</strong> <strong>Assessment</strong> 61
Appendix B: NAICS in Sample (continued)<br />
561410 Document Preparation Services<br />
561422 Telemarketing Bureaus and Other Contact<br />
Centers<br />
561431 Private Mail Centers<br />
561439 Other Business Service Centers (including Copy<br />
Shops)<br />
561440 Collection Agencies<br />
561492 Court Reporting and Stenotype Services<br />
561499 All Other Business Support Services<br />
561510 Travel Agencies<br />
561520 Tour Operators<br />
561591 Convention and Visitors Bureaus<br />
561599 All Other Travel Arrangement and Reservation<br />
Services<br />
561611 Investigation Services<br />
561612 Security Guards and Patrol Services<br />
561613 Armored Car Services<br />
561621 Security Systems Services (except Locksmiths)<br />
561622 Locksmiths<br />
561710 Exterminating and Pest Control Services<br />
561720 Janitorial Services<br />
561730 Landscaping Services<br />
561740 Carpet and Upholstery Cleaning Services<br />
561790 Other Services to Buildings and Dwellings<br />
561920 Convention and Trade Show Organizers<br />
561990 All Other Support Services<br />
562111 Solid Waste Collection<br />
562119 Other Waste Collection<br />
562211 Hazardous Waste Treatment and Disposal<br />
562212 Solid Waste Landfill<br />
562213 Solid Waste Combustors and Incinerators<br />
562910 Remediation Services<br />
562991 Septic Tank and Related Services<br />
562998 All Other Miscellaneous Waste Management<br />
Services<br />
611110 Elementary and Secondary Schools<br />
611210 Junior Colleges<br />
611310 Colleges, Universities, and Professional Schools<br />
611420 Computer Training<br />
611430 Professional and Management Development<br />
Training<br />
611511 Cosmetology and Barber Schools<br />
611512 Flight Training<br />
62 <strong>Hawai</strong>ÿi’s <strong>Green</strong> <strong>Workforce</strong>: A <strong>Baseline</strong> <strong>Assessment</strong><br />
611513 Apprenticeship Training<br />
611519 Other Technical and Trade Schools<br />
611610 Fine Arts Schools<br />
611620 Sports and Recreation Instruction<br />
611630 Language Schools<br />
611691 Exam Preparation and Tutoring<br />
611699 All Other Miscellaneous Schools and Instruction<br />
611710 Educational Support Services<br />
621111 Offices of Physicians (except Mental Health<br />
Specialists)<br />
621112 Offices of Physicians, Mental Health Specialists<br />
621210 Offices of Dentists<br />
621310 Offices of Chiropractors<br />
621320 Offices of Optometrists<br />
621330 Offices of Mental Health Practitioners (except<br />
Physicians)<br />
621340 Offices of Physical, Occupational and Speech<br />
Therapists, and Audiologists<br />
621391 Offices of Podiatrists<br />
621399 Offices of All Other Miscellaneous Health<br />
Practitioners<br />
621410 Family Planning Centers<br />
621420 Outpatient Mental Health and Substance Abuse<br />
Centers<br />
621491 HMO Medical Centers<br />
621492 Kidney Dialysis Centers<br />
621493 Freestanding Ambulatory Surgical and<br />
Emergency Centers<br />
621498 All Other Outpatient Care Centers<br />
621511 Medical Laboratories<br />
621610 Home Health Care Services<br />
621910 Ambulance Services<br />
621991 Blood and Organ Banks<br />
621999 All Other Miscellaneous Ambulatory Health Care<br />
Services<br />
622110 General Medical and Surgical Hospitals<br />
622210 Psychiatric and Substance Abuse Hospitals<br />
622310 Specialty (except Psychiatric and Substance<br />
Abuse) Hospitals<br />
623110 Nursing Care Facilities<br />
623210 Residential Mental Retardation Facilities<br />
623220 Residential Mental Health and Substance Abuse<br />
Facilities<br />
623311 Continuing Care Retirement Communities
623312 Homes for the Elderly<br />
623990 Other Residential Care Facilities<br />
624110 Child and Youth Services<br />
624120 Services for the Elderly and Persons with<br />
Disabilities<br />
624190 Other Individual and Family Services<br />
624210 Community Food Services<br />
624221 Temporary Shelters<br />
624229 Other Community Housing Services<br />
624230 Emergency and Other Relief Services<br />
624310 Vocational Rehabilitation Services<br />
624410 Child Day Care Services<br />
711110 Theater Companies and Dinner Theaters<br />
711120 Dance Companies<br />
711130 Musical Groups and Artists<br />
711190 Other Performing Arts Companies<br />
711219 Other Spectator Sports<br />
711310 Promoters of Performing Arts, Sports, and<br />
Similar Events with Facilities<br />
711320 Promoters of Performing Arts, Sports, and<br />
Similar Events without Facilities<br />
711510 Independent Artists, Writers, and Performers<br />
712110 Museums<br />
712120 Historical Sites<br />
712130 Zoos and Botanical Gardens<br />
712190 Nature Parks and Other Similar Institutions<br />
713110 Amusement and Theme Parks<br />
713120 Amusement Arcades<br />
713910 Golf Courses and Country Clubs<br />
713930 Marinas<br />
713940 Fitness and Recreational Sports Centers<br />
713950 Bowling Centers<br />
713990 All Other Amusement and Recreation Industries<br />
721110 Hotels (except Casino Hotels) and Motels<br />
721191 Bed-and-Breakfast Inns<br />
721199 All Other Traveler Accommodation<br />
721214 Recreational and Vacation Camps (except<br />
Campgrounds)<br />
721310 Rooming and Boarding Houses<br />
722110 Full-Service Restaurants<br />
722211 Limited-Service Restaurants<br />
722212 Cafeterias, Grill Buffets, and Buffets<br />
722213 Snack and Nonalcoholic Beverage Bars<br />
722310 Food Service Contractors<br />
Appendix B: NAICS in Sample (continued)<br />
722320 Caterers<br />
722330 Mobile Food Services<br />
722410 Drinking Places (Alcoholic Beverages)<br />
811111 General Automotive Repair<br />
811112 Automotive Exhaust System Repair<br />
811113 Automotive Transmission Repair<br />
811118 Other Automotive Mechanical and Electrical<br />
Repair and Maintenance<br />
811121 Automotive Body, Paint, and Interior Repair and<br />
Maintenance<br />
811122 Automotive Glass Replacement Shops<br />
811191 Automotive Oil Change and Lubrication Shops<br />
811192 Car Washes<br />
811198 All Other Automotive Repair and Maintenance<br />
811211 Consumer Electronics Repair and Maintenance<br />
811212 Computer and Office Machine Repair and<br />
Maintenance<br />
811219 Other Electronic and Precision Equipment<br />
Repair and Maintenance<br />
811310 Commercial and Industrial Machinery and<br />
Equipment (except Automotive and Electronic)<br />
Repair and Maintenance<br />
811412 Appliance Repair and Maintenance<br />
811420 Reupholstery and Furniture Repair<br />
811490 Other Personal and Household Goods Repair<br />
and Maintenance<br />
812111 Barber Shops<br />
812112 Beauty Salons<br />
812113 Nail Salons<br />
812191 Diet and Weight Reducing Centers<br />
812199 Other Personal Care Services<br />
812210 Funeral Homes and Funeral Services<br />
812310 Coin-Operated Laundries and Drycleaners<br />
812320 Drycleaning and Laundry Services (except Coin-<br />
Operated)<br />
812331 Linen Supply<br />
812332 Industrial Launderers<br />
812910 Pet Care (except Veterinary) Services<br />
812921 Photofinishing Laboratories (except One-Hour)<br />
812922 One-Hour Photofinishing<br />
812930 Parking Lots and Garages<br />
812990 All Other Personal Services<br />
813110 Religious Organizations<br />
813211 Grantmaking Foundations<br />
813212 Voluntary Health Organizations<br />
<strong>Hawai</strong>ÿi’s <strong>Green</strong> <strong>Workforce</strong>: A <strong>Baseline</strong> <strong>Assessment</strong> 63
Appendix B: NAICS in Sample (continued)<br />
813219 Other Grantmaking and Giving Services<br />
813311 Human Rights Organizations<br />
813312 Environment, Conservation and Wildlife<br />
Organizations<br />
813319 Other Social Advocacy Organizations<br />
813410 Civic and Social Organizations<br />
813910 Business Associations<br />
813920 Professional Organizations<br />
813930 Labor Unions and Similar Labor Organizations<br />
813990 Other Similar Organizations (except Business,<br />
Professional, Labor, and Political Organizations)<br />
814110 Private Households<br />
64 <strong>Hawai</strong>ÿi’s <strong>Green</strong> <strong>Workforce</strong>: A <strong>Baseline</strong> <strong>Assessment</strong>
Appendix C: <strong>Green</strong> Job Occupations<br />
SOC Code OCCUPATIONAL TITLE GREEN<br />
JOBS<br />
37-2011.00 Janitors and Cleaners Except<br />
1,197<br />
Maids and Housekeeping<br />
Cleaners<br />
19-4093.00 Forest and Conservation<br />
601<br />
Technicians<br />
33-9032.00 Security Guards 552<br />
47-2111.00 Electricians 438<br />
49-9021.01 Heating and Air Conditioning<br />
348<br />
Mechanics and Installers<br />
47-2031.01 Construction Carpenters 306<br />
47-2131.00 Insulation Workers Floor Ceiling<br />
and Wall<br />
277<br />
37-3011.00 Landscaping and<br />
276<br />
Groundskeeping Workers<br />
47-4099.01 Solar Photovoltaic Installers 237<br />
41-2031.00 Retail Salespersons 219<br />
19-4091.00 Environmental Science and<br />
196<br />
Protection Technicians Including<br />
Health<br />
51-9199.01 Recycling and Reclamation<br />
194<br />
Workers<br />
47-4099.02 Solar Thermal Installers and<br />
194<br />
Technicians<br />
53-7062.00 Laborers and Freight Stock and 191<br />
Material Movers Hand<br />
47-2132.00 Insulation Workers Mechanical 184<br />
47-2061.00 Construction Laborers 173<br />
47-1011.00 First-Line Supervisors/Managers 167<br />
of Construction Trades and<br />
Extraction Workers<br />
47-2152.02 Plumbers 167<br />
47-4041.00 Hazardous Materials Removal<br />
160<br />
Workers<br />
49-9042.00 Maintenance and Repair Workers 159<br />
General<br />
17-2051.00 Civil Engineers 152<br />
17-2071.00 Electrical Engineers 140<br />
41-3099.00 Sales Representatives Services 126<br />
All Other<br />
Source: DLIR Research & Statistics Office, <strong>Hawai</strong>ÿi <strong>Green</strong> Jobs<br />
Survey, <strong>2010</strong>.<br />
53-6099.00 Transportation Workers, All Other 121<br />
27-3031.00 Public Relations Specialists 121<br />
51-9061.00 Inspectors Testers Sorters<br />
Samplers and Weighers<br />
117<br />
19-2041.00 Environmental Scientists and<br />
Specialists Including Health<br />
114<br />
49-9099.00 Installation Maintenance and<br />
114<br />
Repair Workers All Other<br />
45-2092.02 Farmworkers and Laborers Crop 106<br />
37-1012.00 First-Line Supervisors/Managers 103<br />
of Landscaping Lawn Service<br />
and Groundskeeping Worke<br />
41-2011.00 Cashiers 103<br />
49-3023.02 Automotive Specialty Technicians 95<br />
41-1011.00 First-Line Supervisors/Managers<br />
89<br />
of Retail Sales Workers<br />
53-3032.00 Truck Drivers Heavy and Tractor- 84<br />
Trailer<br />
45-4011.00 Forest and Conservation Workers 82<br />
41-4011.00 Sales Representatives<br />
80<br />
Wholesale and Manufacturing<br />
Technical and Scientific Products<br />
45-2041.00 Graders and Sorters Agricultural<br />
79<br />
Products<br />
15-1041.00 Computer Support Specialists 76<br />
11-9012.00 Farmers and Ranchers 75<br />
43-3031.00 Bookkeeping Accounting and<br />
Auditing Clerks<br />
73<br />
27-1025.00 Interior Designers 69<br />
11-1021.00 General and Operations<br />
Managers<br />
69<br />
41-9041.00 Telemarketers 66<br />
47-2044.00 Tile and Marble Setters 64<br />
51-6093.00 Upholsterers 64<br />
17-1011.00 Architects Except Landscape<br />
and Naval<br />
62<br />
49-1011.00 First-Line Supervisors/Managers<br />
of Mechanics Installers and<br />
Repairers<br />
61<br />
13-1199.05 Sustainability Specialists 61<br />
43-9061.00 Office Clerks General 58<br />
17-2141.00 Mechanical Engineers 57<br />
<strong>Hawai</strong>ÿi’s <strong>Green</strong> <strong>Workforce</strong>: A <strong>Baseline</strong> <strong>Assessment</strong> 65
Appendix C: <strong>Green</strong> Job Occupations (continued)<br />
13-1023.00 Purchasing Agents Except<br />
55<br />
Wholesale Retail and Farm<br />
Products<br />
47-4021.00 Elevator Installers and Repairers 54<br />
47-2041.00 Carpet Installers 54<br />
47-2073.00 Operating Engineers and<br />
53<br />
Other Construction Equipment<br />
Operators<br />
17-2199.03 Energy Engineers 53<br />
41-4012.00 Sales Representatives<br />
Wholesale and Manufacturing<br />
Except Technical and Scientific Pr<br />
53<br />
11-9041.00 Engineering Managers 48<br />
51-1011.00 First-Line Supervisors/Managers<br />
of Production and Operating<br />
Workers<br />
48<br />
41-9031.00 Sales Engineers 46<br />
49-9092.00 Commercial Divers 45<br />
37-3013.00 Tree Trimmers and Pruners 42<br />
37-2021.00 Pest Control Workers 42<br />
53-3033.00 Truck Drivers Light or Delivery<br />
Services<br />
42<br />
51-9023.00 Mixing and Blending Machine<br />
Setters Operators and Tenders<br />
37<br />
13-1051.00 Cost Estimators 37<br />
45-2092.01 Nursery Workers 37<br />
45-2093.00 Farmworkers Farm and Ranch<br />
Animals<br />
36<br />
49-2092.00 Electric Motor Power Tool and<br />
Related Repairers<br />
36<br />
51-7011.00 Cabinetmakers and Bench<br />
35<br />
Carpenters<br />
51-8013.00 Power Plant Operators 34<br />
49-9098.00 Helpers--Installation<br />
34<br />
Maintenance and Repair<br />
Workers<br />
51-5023.00 Printing Machine Operators 34<br />
41-4011.07 Solar Sales Representatives and<br />
33<br />
Assessors<br />
47-1011.03 Solar Energy Installation<br />
Managers<br />
39-6021.00 Tour Guides and Escorts 29<br />
29-9011.00 Occupational Health and Safety<br />
Specialists<br />
29<br />
66 <strong>Hawai</strong>ÿi’s <strong>Green</strong> <strong>Workforce</strong>: A <strong>Baseline</strong> <strong>Assessment</strong><br />
32<br />
47-4099.03 Weatherization Installers and<br />
28<br />
Technicians<br />
51-9121.00 Coating Painting and Spraying<br />
28<br />
Machine Setters Operators and<br />
Tenders<br />
19-3051.00 Urban and Regional Planners 27<br />
51-9199.00 Production Workers, All Other 27<br />
11-9151.00 Social and Community Service<br />
26<br />
Managers<br />
15-1099.11 Information Technology Project<br />
Managers<br />
26<br />
11-1011.00 Chief Executives 26<br />
41-2021.00 Counter and Rental Clerks 25<br />
47-5021.00 Earth Drillers Except Oil and Gas 25<br />
47-2141.00 Painters Construction and<br />
Maintenance<br />
24<br />
51-9032.00 Cutting and Slicing Machine<br />
Setters Operators and Tenders<br />
47-2211.00 Sheet Metal Workers 23<br />
25-3099.00 Teachers and Instructors All<br />
Other<br />
22<br />
51-9197.00 Tire Builders 22<br />
19-1031.01 Soil and Water Conservationists 22<br />
43-5021.00 Couriers and Messengers 21<br />
23-1011.00 Lawyers 20<br />
19-4011.01 Agricultural Technicians 19<br />
53-7061.00 Cleaners of Vehicles and<br />
Equipment<br />
19<br />
11-9021.00 Construction Managers 19<br />
17-2081.00 Environmental Engineers 19<br />
51-6052.00 Tailors Dressmakers and<br />
Custom Sewers<br />
19<br />
51-4121.06 Welders Cutters and Welder<br />
Fitters<br />
18<br />
43-6011.00 Executive Secretaries and<br />
17<br />
Administrative Assistants<br />
11-2021.00 Marketing Managers 17<br />
13-1073.00 Training and Development<br />
16<br />
Specialists<br />
25-2032.00 Vocational Education Teachers<br />
16<br />
Secondary School<br />
19-2042.00 Geoscientists Except<br />
15<br />
Hydrologists and Geographers<br />
24
39-1021.00 Firstline Supervisors/Personal<br />
Service Workers<br />
17-3022.00 Civil Engineering Technicians 14<br />
11-9199.11 Brownfield Redevelopment<br />
Specialists and Site Managers<br />
14<br />
47-2181.00 Roofers 13<br />
17-3027.00 Mechanical Engineering<br />
Technicians<br />
13<br />
17-3012.02 Electrical Drafters 13<br />
19-2031.00 Chemists 13<br />
19-4099.01 Quality Control Analysts 12<br />
51-5022.00 Prepress Technicians and<br />
Workers<br />
12<br />
11-3051.04 Biomass Production Managers 11<br />
47-4099.00 Construction and Related<br />
Workers All Other<br />
11<br />
43-5081.03 Stock Clerks- Stockroom<br />
Warehouse or Storage Yard<br />
43-1011.00 First-Line Supervisors/Managers<br />
10<br />
of Office and Administrative<br />
Support Workers<br />
13-1199.01 Energy Auditors 10<br />
45-1011.07 First-Line Supervisors/Managers<br />
10<br />
of Agricultural Crop and<br />
Horticultural Workers<br />
17-2199.11 Solar Energy Systems Engineers 10<br />
17-1012.00 Landscape Architects 10<br />
51-3092.00 Food Batchmakers 8<br />
51-9021.00 Crushing Grinding and Polishing<br />
8<br />
Machine Setters Operators and<br />
Tenders<br />
27-1011.00 Art Directors 8<br />
13-1041.01 Environmental Compliance<br />
Inspectors<br />
8<br />
43-6014.00 Secretaries Except Legal<br />
7<br />
Medical and Executive<br />
43-4171.00 Receptionists and Information<br />
7<br />
Clerks<br />
11-2022.00 Sales Managers 7<br />
49-9094.00 Locksmiths and Safe Repairers 7<br />
15-1099.02 Computer Systems Engineers/<br />
7<br />
Architects<br />
11-3021.00 Computer and Information<br />
6<br />
Systems Managers<br />
15<br />
11<br />
Appendix C: <strong>Green</strong> Job Occupations (continued)<br />
11-3051.01 Quality Control Systems<br />
6<br />
Managers<br />
49-9041.00 Industrial Machinery Mechanics 6<br />
11-3071.02 Storage and Distribution<br />
6<br />
Managers<br />
51-3022.00 Meat Poultry and Fish Cutters<br />
6<br />
and Trimmers<br />
53-7064.00 Packers and Packagers Hand 6<br />
17-1021.00 Cartographers and<br />
Photogrammetrists<br />
6<br />
19-2041.02 Environmental Restoration<br />
Planners<br />
6<br />
19-3091.02 Archeologists 6<br />
13-1111.00 Management Analysts 5<br />
49-9044.00 Millwrights 5<br />
53-5021.01 Ship and Boat Captains 5<br />
11-3031.01 Treasurers and Controllers 5<br />
21-1099.00 Community and Social Service<br />
Specialists All Other<br />
5<br />
51-6011.00 Laundry and Dry-Cleaning<br />
Workers<br />
5<br />
17-3026.00 Industrial Engineering<br />
Technicians<br />
21-1093.00 Social and Human Service<br />
Assistants<br />
31-1012.00 Nursing Aides Orderlies and<br />
Attendants<br />
17-3023.03 Electrical Engineering<br />
Technicians<br />
35-9011.00 Dining Room and Cafeteria<br />
Attendants and Bartender<br />
Helpers<br />
37-1011.00 First-Line Supervisors/Managers<br />
of Housekeeping and Janitorial<br />
Workers<br />
27-1019.00 Artists and Related Workers All<br />
Other<br />
49-3031.00 Bus and Truck Mechanics and<br />
Diesel Engine Specialists<br />
11-9032.00 Education Administrators<br />
4<br />
Elementary and Secondary<br />
School<br />
27-1027.00 Set and Exhibit Designers 4<br />
17-3029.00 Engineering Technicians, Except<br />
4<br />
Drafter, All Other<br />
19-1032.00 Foresters 4<br />
<strong>Hawai</strong>ÿi’s <strong>Green</strong> <strong>Workforce</strong>: A <strong>Baseline</strong> <strong>Assessment</strong> 67<br />
5<br />
5<br />
5<br />
4<br />
4<br />
4<br />
4<br />
4
Appendix C: <strong>Green</strong> Job Occupations (continued)<br />
17-2021.00 Agricultural Engineers 4<br />
25-9021.00 Farm and Home Management<br />
Advisors<br />
4<br />
11-3040.00 Human Resources Managers 4<br />
45-2091.00 Agricultural Equipment Operators 4<br />
19-1031.00 Conservation Scientists 4<br />
19-1031.02 Range Managers 4<br />
41-1012.00 First-Line Supervisors/Managers<br />
of Non-Retail Sales Workers<br />
4<br />
11-1011.03 Chief Sustainability Officers 3<br />
15-1032.00 Computer Software Engineers<br />
Systems Software<br />
3<br />
47-2021.00 Brickmasons and Blockmasons 3<br />
51-8099.00 Plant and System Operators All<br />
3<br />
Other<br />
49-3042.00 Mobile Heavy Equipment<br />
3<br />
Mechanics Except Engines<br />
23-2011.00 Paralegals and Legal Assistants 3<br />
43-5071.00 Shipping Receiving and Traffic<br />
Clerks<br />
3<br />
11-9199.00 Managers All Other 3<br />
51-8031.00 Water and Liquid Waste<br />
3<br />
Treatment Plant and System<br />
Operators<br />
27-1021.00 Commercial and Industrial<br />
Designers<br />
3<br />
13-1072.00 Compensation Benefits and Job<br />
Analysis Specialists<br />
3<br />
13-2011.01 Accountants 3<br />
15-1099.10 Business Intelligence Analysts 3<br />
43-4051.00 Customer Service<br />
Representatives<br />
3<br />
25-1194.00 Vocational Education Teachers<br />
Postsecondary<br />
3<br />
27-1024.00 Graphic Designers 3<br />
51-9198.00 Helpers--Production Workers 3<br />
37-2012.00 Maids and Housekeeping<br />
Cleaners<br />
3<br />
47-2071.00 Paving Surfacing and Tamping<br />
Equipment Operators<br />
3<br />
51-9195.03 Stone Cutters and Carvers<br />
Manufacturing<br />
3<br />
53-1021.01 Recycling Coordinators 3<br />
11-9199.10 Wind Energy Project Managers 3<br />
68 <strong>Hawai</strong>ÿi’s <strong>Green</strong> <strong>Workforce</strong>: A <strong>Baseline</strong> <strong>Assessment</strong><br />
11-3042.00 Training and Development<br />
Managers<br />
11-3051.03 Biofuels Production Managers 2<br />
11-9041.01 Biofuels/Biodiesel Technology<br />
2<br />
and Product Development<br />
Managers<br />
13-1199.00 Business Operations Specialists,<br />
All Other<br />
13-2099.00 Financial Specialists, All Other 2<br />
15-1031.00 Computer Software Engineers,<br />
Applications<br />
2<br />
17-2111.01 Industrial Safety and Health<br />
Engineers<br />
25-1041.00 Agricultural Science Teachers,<br />
Postsecondary<br />
49-2094.00 Electrical and Electronics<br />
Repairers Commercial and<br />
Industrial Equipment<br />
49-9021.02 Refrigeration Mechanics and<br />
Installers<br />
51-8012.00 Power Distributors and<br />
Dispatchers<br />
53-7051.00 Industrial Truck and Tractor<br />
Operators<br />
11-2011.01 <strong>Green</strong> Marketers 1<br />
19-1023.00 Zoologists and Wildlife Biologists 1<br />
25-9031.00 Instructional Coordinators 1<br />
39-2021.00 Nonfarm Animal Caretakers 1<br />
43-4161.00 Human Resources Assistants<br />
Except Payroll and Timekeeping<br />
1<br />
2<br />
2<br />
2<br />
2<br />
2<br />
2<br />
2<br />
2
Appendix D: Survey Instrument<br />
jobs in <strong>Hawai</strong>‘i.<br />
H A W A I ÿ I G R E E N J O B S S U R V E Y<br />
<strong>Hawai</strong>‘i recognizes it is overly dependent on imported oil to meet its energy needs.<br />
Recently, the State has taken steps to become more energy self-reliant and to preserve<br />
its natural resources for future generations. “<strong>Green</strong>” jobs may help to halt unemployment<br />
during the current economic downturn and contribute to needed economic growth for<br />
years to come. The federal American Recovery and Reinvestment Act of 2009 (ARRA)<br />
has further fueled this interest by funding this survey and workforce retraining for green<br />
To support <strong>Hawai</strong>‘i’s efforts to develop a green economy and workforce that can compete for green jobs,<br />
we are conducting a survey of <strong>Hawai</strong>‘i businesses. The purpose of this survey is to:<br />
• estimate the number of jobs where environmental protection or preservation is central,<br />
• identify the occupations involved with the emerging green economy,<br />
• identify the training needs of a green workforce.<br />
What is a green job?<br />
A green job makes a positive impact on the environment or energy sustainability.<br />
This survey covers five core areas:<br />
Generate clean, renewable, sustainable energy<br />
Reduce pollution and waste; conserve natural resources<br />
Energy efficiency<br />
Education, training and support of a green workforce<br />
Natural, environmentally-friendly production<br />
Three ways to complete this survey:<br />
1 Online: www.<strong>Green</strong>Jobs<strong>Hawai</strong>i.org 2 Mail: Return the survey in the enclosed envelope 3 Fax: (808) 586-9022<br />
* Please respond within 15 days of the date on the cover letter.<br />
Report only for the worksite shown on the label on the back page.<br />
We suggest your Operations or Human Resources Manager complete this form.<br />
Your responses will be kept confidential.<br />
1. Number of employees at this location (count full and part-time workers equally) _____________<br />
þ<br />
2. Check the green practices your company performs at this location:<br />
¨ Recycle (paper, toner cartridge, cans) ¨ Energy-saving light bults<br />
¨ Use of recycled products (office paper, etc.) ¨ Solar and photovoltaics<br />
¨ Telecommute ¨ Use low VOC paints, stains or sealers<br />
¨ Carpool ¨ Clean with “eco-friendly” products<br />
¨ Fuel efficient and alternative fuel vehicles ¨ Reduce energy use (A/C timer, motion sensor, etc.)<br />
¨ Subsidized bus pass ¨ Water conservation<br />
¨ Bicycle commute program ¨ Other (please describe)<br />
3. Does your company work to PROVIDE goods or services in any of the five core GREEN areas?<br />
For more information and examples about these areas, see the back page.<br />
¨ YES è Please complete all sections of this survey.<br />
¨ NO è Please complete this page and continue directly to the back page.<br />
<strong>Hawai</strong>ÿi’s <strong>Green</strong> <strong>Workforce</strong>: A <strong>Baseline</strong> <strong>Assessment</strong> 69
H A W A I ÿ I G R E E N J O B S S U R V E Y<br />
* Exclude consultants, outside contractors, vendors,<br />
and others not considered employees.<br />
70 <strong>Hawai</strong>ÿi’s <strong>Green</strong> <strong>Workforce</strong>: A <strong>Baseline</strong> <strong>Assessment</strong><br />
www.<strong>Green</strong>Jobs<strong>Hawai</strong>i.org<br />
Job Titles & Descriptions Current # of Employees in GREEN Areas<br />
Job title(s) of workers you employed*<br />
in jobs in GREEN areas at this<br />
location<br />
from January to March <strong>2010</strong><br />
Describe and explain how the position is<br />
GREEN.<br />
ONLY include jobs where green activities<br />
were essential to the job. Please PRINT<br />
Job Title: Wind Turbine Technician -<br />
Description: Installs and repairs wind turbines<br />
Job Title:<br />
Description:<br />
Job Title:<br />
Description:<br />
Job Title:<br />
Description:<br />
Job Title:<br />
Description:<br />
Job Title:<br />
Description:<br />
Job Title:<br />
Description:<br />
Generate<br />
Clean,<br />
Renewable,<br />
Sustainable<br />
Energy<br />
Reduce<br />
Pollution<br />
and Waste;<br />
Conserve<br />
Natural<br />
Resources,<br />
Recycle<br />
Energy<br />
Efficiency<br />
Education,<br />
Training and<br />
Support of<br />
<strong>Green</strong><br />
<strong>Workforce</strong><br />
Natural,<br />
Environmentally-Friendly<br />
Production<br />
Estimate the current number of employees in each GREEN area<br />
Refer to back page for more information and examples.<br />
Count full and part-time workers equally.<br />
Choose only ONE category per employee. (If employees work in more than<br />
one,<br />
choose the area that takes most of their time or is their primary job function.)<br />
3<br />
E x a m p l e<br />
If you need more space, please attach another sheet.
H A W A I ÿ I G R E E N J O B S S U R V E Y<br />
www.<strong>Green</strong>Jobs<strong>Hawai</strong>i.org<br />
Job Vacancies Qualifications & Employee Training Requirements<br />
# of Current<br />
Vacancies<br />
for this Job<br />
Total # of<br />
Workers You<br />
Expect in<br />
this Position<br />
in<br />
2012<br />
Minimum<br />
Education and<br />
Training<br />
Qualifications<br />
Select one code<br />
(**See 1 - 11 below)<br />
1 10 6<br />
Formal Training by<br />
Community College<br />
or Other External<br />
Provider<br />
Certifications or<br />
Licenses<br />
** 1 = Professional degree 6 = Associate’s degree<br />
2 = Doctoral degree 7 = Postsecondary vocational award<br />
3 = Master’s degree 8 = Work experience in a related occupation<br />
4 = Bachelor’s or higher degree 9 = More than 1 year on-the-job training<br />
plus work experience 10 = 1 to 12 months on-the-job training<br />
5 = Bachelor’s degree 11 = Less than 1 month on-job training<br />
Informal on-the-job<br />
training<br />
List and describe specific types of training<br />
(exclusive of a degree program) and<br />
certifications and licences required for your green workers<br />
Electrician course;<br />
Wind turbine<br />
technology<br />
None None<br />
<strong>Hawai</strong>ÿi’s <strong>Green</strong> <strong>Workforce</strong>: A <strong>Baseline</strong> <strong>Assessment</strong> 71
H A W A I ÿ I G R E E N J O B S S U R V E Y<br />
Generate Clean, Renewable, Sustainable Energy<br />
Produce, transmit, and store clean, renewable power in a safe and sustainable manner from solar, wind,<br />
hydro, geothermal, ocean, and small-scale biopower sources.<br />
Example: electricians, electrical engineers and plumbers install solar energy systems.<br />
Reduce and Mitigate Pollution and Waste and Conserve Our Natural Resources, Recycle<br />
Manage water and other natural resources. Prevent and control emissions and pollution. Treat water<br />
and remediate waste. Examples: trained workers safely remediate hazardous materials; air quality<br />
monitoring.<br />
Energy Efficiency<br />
Reduce energy use. Produce or install energy-efficient products. Provide energy-efficiency services.<br />
Retrofit, weatherize, or improve efficiency of buildings. Improve energy distribution (smart grid) and<br />
transportation. Examples: engineers develop lighting and other products that curb and monitor energy<br />
use while electricians and others install them.<br />
Education, Training and Support of <strong>Green</strong> <strong>Workforce</strong><br />
Provide services to the other four green areas. Help develop our green workforce.<br />
Examples: teachers train workers for the clean energy economy; legal services; environmental<br />
consultants.<br />
Natural, Sustainable, Environmentally-Friendly Production<br />
Mitigate harmful environmental impacts of products and processes and use less energy by improving or<br />
developing alternative products and methods, including use of natural or recycled materials.<br />
Examples: construction workers install green building materials; plumbers and technicians install smart<br />
irrigation systems; organic farmers; chemists or product designers and engineers who produce less<br />
caustic cleaning products and biodegradable products.<br />
Need assistance? Contact us:<br />
Labor Market Information (LMI) <strong>Green</strong> Jobs Initiative<br />
Research & Statistics Office • <strong>Hawai</strong>ÿi Department of Labor & Industrial Relations<br />
830 Punchbowl Street, Room 304 • Honolulu, HI 96813<br />
Tel: 808-586-9097 • Fax: 808-586-9022<br />
Email: DLIR.RS.<strong>Green</strong>Jobs<strong>Hawai</strong>i@hawaii.gov • Website: www.<strong>Green</strong>Jobs<strong>Hawai</strong>i.org<br />
72 <strong>Hawai</strong>ÿi’s <strong>Green</strong> <strong>Workforce</strong>: A <strong>Baseline</strong> <strong>Assessment</strong><br />
5. Contact person<br />
Page 4<br />
________________________________________<br />
Name<br />
________________________________________<br />
Title<br />
________________________________________<br />
Telephone<br />
________________________________________<br />
Email<br />
These descriptions and examples are NOT comprehensive.<br />
Mahalo. Your participation helps <strong>Hawai</strong>‘i go green!
The cover art depicts, from left to right: 1) the Kahuku wind energy project, 2) workers in Kona installing photovoltaic panels, 3)<br />
youth in a green jobs training program on the Big Island, 4) and taro plants. Taro is grown primarily for the <strong>Hawai</strong>ian staple of poi.<br />
The National Agricultural Statistics Service estimates <strong>Hawai</strong>ÿi’s taro production at 4.4 million pounds in 2008, mostly on the island of<br />
Kauaÿi. Photos courtesy of First Wind, Sunetric, Kupu <strong>Hawai</strong>ÿi, NorthShoreKauai.com, and Harold Herradura.