Hawai i's Green Workforce A Baseline Assessment December 2010
Hawai i's Green Workforce A Baseline Assessment December 2010
Hawai i's Green Workforce A Baseline Assessment December 2010

Create successful ePaper yourself
Turn your PDF publications into a flip-book with our unique Google optimized e-Paper software.
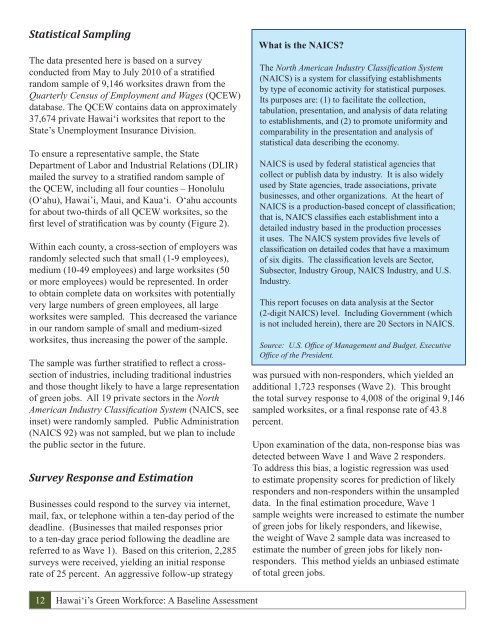
Statistical Sampling<br />
The data presented here is based on a survey<br />
conducted from May to July <strong>2010</strong> of a stratified<br />
random sample of 9,146 worksites drawn from the<br />
Quarterly Census of Employment and Wages (QCEW)<br />
database. The QCEW contains data on approximately<br />
37,674 private <strong>Hawai</strong>‘i worksites that report to the<br />
State’s Unemployment Insurance Division.<br />
To ensure a representative sample, the State<br />
Department of Labor and Industrial Relations (DLIR)<br />
mailed the survey to a stratified random sample of<br />
the QCEW, including all four counties – Honolulu<br />
(O‘ahu), <strong>Hawai</strong>’i, Maui, and Kaua‘i. O‘ahu accounts<br />
for about two-thirds of all QCEW worksites, so the<br />
first level of stratification was by county (Figure 2).<br />
Within each county, a cross-section of employers was<br />
randomly selected such that small (1-9 employees),<br />
medium (10-49 employees) and large worksites (50<br />
or more employees) would be represented. In order<br />
to obtain complete data on worksites with potentially<br />
very large numbers of green employees, all large<br />
worksites were sampled. This decreased the variance<br />
in our random sample of small and medium-sized<br />
worksites, thus increasing the power of the sample.<br />
The sample was further stratified to reflect a crosssection<br />
of industries, including traditional industries<br />
and those thought likely to have a large representation<br />
of green jobs. All 19 private sectors in the North<br />
American Industry Classification System (NAICS, see<br />
inset) were randomly sampled. Public Administration<br />
(NAICS 92) was not sampled, but we plan to include<br />
the public sector in the future.<br />
Survey Response and Estimation<br />
Businesses could respond to the survey via internet,<br />
mail, fax, or telephone within a ten-day period of the<br />
deadline. (Businesses that mailed responses prior<br />
to a ten-day grace period following the deadline are<br />
referred to as Wave 1). Based on this criterion, 2,285<br />
surveys were received, yielding an initial response<br />
rate of 25 percent. An aggressive follow-up strategy<br />
12 <strong>Hawai</strong>ÿi’s <strong>Green</strong> <strong>Workforce</strong>: A <strong>Baseline</strong> <strong>Assessment</strong><br />
What is the NAICS?<br />
The North American Industry Classification System<br />
(NAICS) is a system for classifying establishments<br />
by type of economic activity for statistical purposes.<br />
Its purposes are: (1) to facilitate the collection,<br />
tabulation, presentation, and analysis of data relating<br />
to establishments, and (2) to promote uniformity and<br />
comparability in the presentation and analysis of<br />
statistical data describing the economy.<br />
NAICS is used by federal statistical agencies that<br />
collect or publish data by industry. It is also widely<br />
used by State agencies, trade associations, private<br />
businesses, and other organizations. At the heart of<br />
NAICS is a production-based concept of classification;<br />
that is, NAICS classifies each establishment into a<br />
detailed industry based in the production processes<br />
it uses. The NAICS system provides five levels of<br />
classification on detailed codes that have a maximum<br />
of six digits. The classification levels are Sector,<br />
Subsector, Industry Group, NAICS Industry, and U.S.<br />
Industry.<br />
This report focuses on data analysis at the Sector<br />
(2-digit NAICS) level. Including Government (which<br />
is not included herein), there are 20 Sectors in NAICS.<br />
Source: U.S. Office of Management and Budget, Executive<br />
Office of the President.<br />
was pursued with non-responders, which yielded an<br />
additional 1,723 responses (Wave 2). This brought<br />
the total survey response to 4,008 of the original 9,146<br />
sampled worksites, or a final response rate of 43.8<br />
percent.<br />
Upon examination of the data, non-response bias was<br />
detected between Wave 1 and Wave 2 responders.<br />
To address this bias, a logistic regression was used<br />
to estimate propensity scores for prediction of likely<br />
responders and non-responders within the unsampled<br />
data. In the final estimation procedure, Wave 1<br />
sample weights were increased to estimate the number<br />
of green jobs for likely responders, and likewise,<br />
the weight of Wave 2 sample data was increased to<br />
estimate the number of green jobs for likely nonresponders.<br />
This method yields an unbiased estimate<br />
of total green jobs.