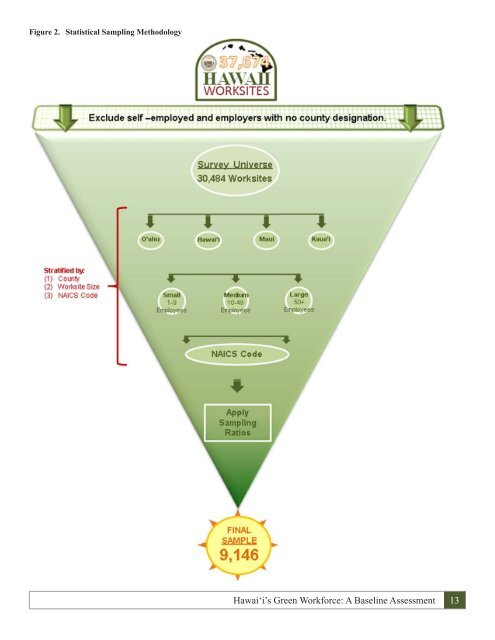
Statistical Sampling The data presented here is based on a survey conducted from May to July <strong>2010</strong> of a stratified random sample of 9,146 worksites drawn from the Quarterly Census of Employment and Wages (QCEW) database. The QCEW contains data on approximately 37,674 private <strong>Hawai</strong>‘i worksites that report to the State’s Unemployment Insurance Division. To ensure a representative sample, the State Department of Labor and Industrial Relations (DLIR) mailed the survey to a stratified random sample of the QCEW, including all four counties – Honolulu (O‘ahu), <strong>Hawai</strong>’i, Maui, and Kaua‘i. O‘ahu accounts for about two-thirds of all QCEW worksites, so the first level of stratification was by county (Figure 2). Within each county, a cross-section of employers was randomly selected such that small (1-9 employees), medium (10-49 employees) and large worksites (50 or more employees) would be represented. In order to obtain complete data on worksites with potentially very large numbers of green employees, all large worksites were sampled. This decreased the variance in our random sample of small and medium-sized worksites, thus increasing the power of the sample. The sample was further stratified to reflect a crosssection of industries, including traditional industries and those thought likely to have a large representation of green jobs. All 19 private sectors in the North American Industry Classification System (NAICS, see inset) were randomly sampled. Public Administration (NAICS 92) was not sampled, but we plan to include the public sector in the future. Survey Response and Estimation Businesses could respond to the survey via internet, mail, fax, or telephone within a ten-day period of the deadline. (Businesses that mailed responses prior to a ten-day grace period following the deadline are referred to as Wave 1). Based on this criterion, 2,285 surveys were received, yielding an initial response rate of 25 percent. An aggressive follow-up strategy 12 <strong>Hawai</strong>ÿi’s <strong>Green</strong> <strong>Workforce</strong>: A <strong>Baseline</strong> <strong>Assessment</strong> What is the NAICS? The North American Industry Classification System (NAICS) is a system for classifying establishments by type of economic activity for statistical purposes. Its purposes are: (1) to facilitate the collection, tabulation, presentation, and analysis of data relating to establishments, and (2) to promote uniformity and comparability in the presentation and analysis of statistical data describing the economy. NAICS is used by federal statistical agencies that collect or publish data by industry. It is also widely used by State agencies, trade associations, private businesses, and other organizations. At the heart of NAICS is a production-based concept of classification; that is, NAICS classifies each establishment into a detailed industry based in the production processes it uses. The NAICS system provides five levels of classification on detailed codes that have a maximum of six digits. The classification levels are Sector, Subsector, Industry Group, NAICS Industry, and U.S. Industry. This report focuses on data analysis at the Sector (2-digit NAICS) level. Including Government (which is not included herein), there are 20 Sectors in NAICS. Source: U.S. Office of Management and Budget, Executive Office of the President. was pursued with non-responders, which yielded an additional 1,723 responses (Wave 2). This brought the total survey response to 4,008 of the original 9,146 sampled worksites, or a final response rate of 43.8 percent. Upon examination of the data, non-response bias was detected between Wave 1 and Wave 2 responders. To address this bias, a logistic regression was used to estimate propensity scores for prediction of likely responders and non-responders within the unsampled data. In the final estimation procedure, Wave 1 sample weights were increased to estimate the number of green jobs for likely responders, and likewise, the weight of Wave 2 sample data was increased to estimate the number of green jobs for likely nonresponders. This method yields an unbiased estimate of total green jobs.
Figure 2. Statistical Sampling Methodology <strong>Hawai</strong>ÿi’s <strong>Green</strong> <strong>Workforce</strong>: A <strong>Baseline</strong> <strong>Assessment</strong> 13