Environmental and Health Benefits of the Cebu ... - Clean Air Initiative
Environmental and Health Benefits of the Cebu ... - Clean Air Initiative
Environmental and Health Benefits of the Cebu ... - Clean Air Initiative

Create successful ePaper yourself
Turn your PDF publications into a flip-book with our unique Google optimized e-Paper software.
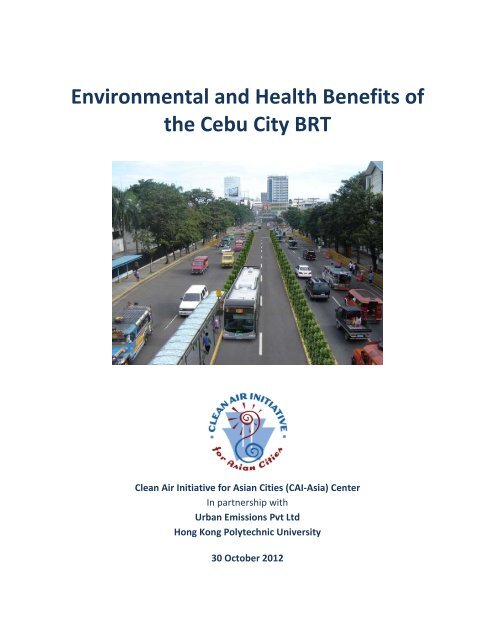
<strong>Environmental</strong> <strong>and</strong> <strong>Health</strong> <strong>Benefits</strong> <strong>of</strong><br />
<strong>the</strong> <strong>Cebu</strong> City BRT<br />
<strong>Clean</strong> <strong>Air</strong> <strong>Initiative</strong> for Asian Cities (CAI-Asia) Center<br />
In partnership with<br />
Urban Emissions Pvt Ltd<br />
Hong Kong Polytechnic University<br />
30 October 2012
©2012 <strong>Clean</strong> <strong>Air</strong> <strong>Initiative</strong> for Asian Cities Center. All rights reserved. <strong>Clean</strong> <strong>Air</strong> <strong>Initiative</strong> for Asian Cities (CAI-Asia)<br />
Center, 2012. “<strong>Environmental</strong> <strong>and</strong> <strong>Health</strong> <strong>Benefits</strong> <strong>of</strong> <strong>the</strong> <strong>Cebu</strong> City BRT Corridor”. Pasig City, Philippines.<br />
© Cover photo from Integrated Transport Planning, Ltd.<br />
This publication may be reproduced in whole or in part in any form for educational or non-pr<strong>of</strong>it purposes without<br />
special permission from <strong>the</strong> copyright holder, provided acknowledgment <strong>of</strong> <strong>the</strong> source is made. The CAI-Asia<br />
Center would appreciate receiving a copy <strong>of</strong> any publication that uses this CAI-Asia Center publication as a source.<br />
No use <strong>of</strong> this publication may be made for resale or for any o<strong>the</strong>r commercial purpose whatsoever, without prior<br />
permission in writing from <strong>the</strong> CAI-Asia Center.<br />
Disclaimer<br />
The views expressed in this publication are those <strong>of</strong> CAI-Asia Center staff, consultants <strong>and</strong> management, <strong>and</strong> do<br />
not necessarily reflect <strong>the</strong> views <strong>of</strong> <strong>the</strong> Board <strong>of</strong> Trustees <strong>of</strong> <strong>the</strong> CAI-Asia Center. The CAI-Asia Center does not<br />
guarantee <strong>the</strong> accuracy <strong>of</strong> <strong>the</strong> data included in this publication <strong>and</strong> does not accept responsibility for consequence<br />
<strong>of</strong> <strong>the</strong>ir use.<br />
Acknowledgments<br />
This study was conducted with funding from <strong>the</strong> Agence Francaise de Developpement <strong>and</strong> <strong>the</strong> invaluable support<br />
<strong>of</strong> <strong>the</strong>se partners: <strong>the</strong> <strong>Cebu</strong> City Government, <strong>Environmental</strong> Management Bureau (Region 7), Department <strong>of</strong><br />
<strong>Health</strong> (Region 7), Hong Kong Polytechnic University, Manila Observatory, University <strong>of</strong> San Carlos, <strong>and</strong> University<br />
<strong>of</strong> <strong>the</strong> Philippines <strong>Cebu</strong>. The main authors <strong>of</strong> this report are: Bert Fabian, Sudhir Gota, Atty. Glynda Bathan-<br />
Baterina, Dr. Wing-tat Hung, Pr<strong>of</strong>. Frank Lee, Dr. Sarath Guttikunda, Benjamin Roa, <strong>and</strong> Donald Grospe.<br />
Contact<br />
CAI-Asia Center<br />
Unit 3505<br />
Robinsons-Equitable Tower<br />
ADB Avenue, Pasig City, 1605<br />
Metro Manila, Philippines<br />
center@cai-asia.org<br />
www.cleanairinitiative.org<br />
CAI-Asia China Office<br />
901A, Reignwood<br />
Building<br />
No.8 YongAnDongLi<br />
Jianguomenwai Avenue<br />
Beijing 100022 China<br />
cpo@cai-asia.org<br />
CAI-Asia India Office<br />
1 st Floor, Building No. 4<br />
Thyagraj Nagar Market<br />
Lodhi Colony<br />
New Delhi – 110003<br />
India<br />
India@cai-asia.org<br />
Country Networks<br />
China India<br />
Indonesia Nepal<br />
Pakistan Philippines<br />
Sri Lanka Vietnam<br />
About CAI-Asia<br />
CAI-Asia promotes better air quality <strong>and</strong> livable cities by translating knowledge to policies <strong>and</strong> actions that reduce<br />
air pollution <strong>and</strong> greenhouse gas emissions from transport, energy <strong>and</strong> o<strong>the</strong>r sectors. CAI-Asia was established as<br />
<strong>the</strong> premier air quality network for Asia by <strong>the</strong> Asian Development Bank, World Bank <strong>and</strong> USAID in 2001, <strong>and</strong><br />
operates since 2007 as an independent non-pr<strong>of</strong>it organization. <strong>Clean</strong> <strong>Air</strong> Asia has <strong>of</strong>fices in Manila, Beijing <strong>and</strong><br />
Delhi, networks in eight Asian countries (China, India, Indonesia, Nepal, Pakistan, Philippines, Sri Lanka, <strong>and</strong><br />
Vietnam) <strong>and</strong> is a UN recognized partnership <strong>of</strong> 230 organizations in Asia <strong>and</strong> worldwide.<br />
CAI-Asia uses knowledge <strong>and</strong> partnerships to enable Asia’s 2500 cities <strong>and</strong> national governments underst<strong>and</strong> <strong>the</strong><br />
problems, identify solutions <strong>and</strong> implement <strong>the</strong>se effectively. Our four programs are: <strong>Air</strong> Quality & Climate<br />
Change, Low Emissions Urban Development, <strong>Clean</strong> Fuels <strong>and</strong> Vehicles, <strong>and</strong> Green Freight <strong>and</strong> Logistics. Our<br />
flagship event since 2002, <strong>the</strong> Better <strong>Air</strong> Quality conference, brings toge<strong>the</strong>r more than 500 practitioners, policy<br />
makers <strong>and</strong> <strong>the</strong> private sector.
EXECUTIVE SUMMARY<br />
<strong>Environmental</strong> <strong>and</strong> <strong>Health</strong> <strong>Benefits</strong> <strong>of</strong> <strong>the</strong> <strong>Cebu</strong> City BRT: Final Report<br />
<strong>Cebu</strong> City is set to become <strong>the</strong> first city in <strong>the</strong> Philippines to implement a more integrated public transport<br />
system with <strong>the</strong> planned Bus Rapid Transit (BRT) System. BRT systems, when implemented well, are able to<br />
provide mass transportation that effectively matches <strong>the</strong> supply <strong>of</strong> <strong>and</strong> dem<strong>and</strong> for public transport at a<br />
lower cost compared to conventional rail-based mass transport systems. BRT systems also prioritize <strong>the</strong><br />
integration <strong>of</strong> non-motorized transport into <strong>the</strong> system. In <strong>the</strong> case <strong>of</strong> <strong>Cebu</strong> City, better walking environment<br />
<strong>and</strong> pedestrian facilities are planned. Because <strong>of</strong> <strong>the</strong>se features – prioritization <strong>of</strong> public transportation <strong>and</strong><br />
integration <strong>of</strong> non-motorized modes, BRT systems can greatly mitigate air pollution <strong>and</strong> greenhouse gas<br />
emissions, <strong>and</strong> help make cities more livable.<br />
This study assessed <strong>the</strong> environmental <strong>and</strong> health benefits <strong>of</strong> <strong>the</strong> <strong>Cebu</strong> BRT system. It conducted:<br />
a) air sampling to determine baseline air quality along <strong>the</strong> proposed BRT corridor ;<br />
b) an analysis <strong>of</strong> <strong>the</strong> environmental benefits <strong>of</strong> <strong>the</strong> BRT corridor using <strong>the</strong> Transportation Emissions<br />
Evaluation Model for Projects (TEEMP) tools which have been adopted <strong>and</strong> used by several<br />
international organizations such as <strong>the</strong> Global Environment Facility (GEF), <strong>the</strong> Asian Development<br />
Bank (ADB) <strong>and</strong> <strong>the</strong> World Bank; <strong>and</strong><br />
c) an analysis <strong>of</strong> <strong>the</strong> health benefits from <strong>the</strong> proposed BRT, using <strong>the</strong> Simple Interactive Models for<br />
better air quality (SIM-air) tools developed by UrbanEmissions.info <strong>and</strong> which have been applied to<br />
more than ten cities worldwide.<br />
Recommendations were also provided to set up an air quality monitoring system for <strong>the</strong> BRT corridor <strong>and</strong> on<br />
how to best communicate <strong>the</strong> environmental <strong>and</strong> health benefits <strong>of</strong> <strong>the</strong> BRT to <strong>the</strong> public.<br />
The roadside air quality monitoring at <strong>the</strong> two sampled locations (along <strong>the</strong> Escario-Osmeña Junction <strong>and</strong><br />
along N. Bacalso Avenue near <strong>the</strong> South Bus Terminal) showed that fine particulates (PM2.5), carbon<br />
monoxide (CO), volatile organic compounds (VOCs), particularly benzene <strong>and</strong> 1,3 butadiene, are at elevated<br />
levels <strong>and</strong> higher than ambient air quality guidelines <strong>of</strong> <strong>the</strong> Philippine Department <strong>of</strong> Environment <strong>and</strong><br />
Natural Resources (DENR) <strong>and</strong> <strong>the</strong> World <strong>Health</strong> Organization (WHO). It should be noted, though, that <strong>the</strong>se<br />
measurements along <strong>the</strong> BRT corridor do not represent <strong>the</strong> ambient air quality conditions for <strong>the</strong> whole city<br />
<strong>and</strong> that roadside concentrations are usually higher than <strong>the</strong> ambient concentrations.<br />
The analysis <strong>of</strong> <strong>the</strong> potential environmental <strong>and</strong> o<strong>the</strong>r benefits <strong>of</strong> <strong>the</strong> BRT showed that:<br />
• Carbon dioxide (CO2) savings from <strong>the</strong> project is about 3,500 tons/km/year (average <strong>of</strong> low, high <strong>and</strong><br />
feasible scenarios). When <strong>the</strong> l<strong>and</strong> use impact <strong>of</strong> <strong>the</strong> BRT system is considered, savings could be<br />
about 8,000 tons/km/year (average <strong>of</strong> low, high <strong>and</strong> feasible scenarios). The savings are comparable<br />
to similar scale BRTs in Asia <strong>and</strong> elsewhere. The Feasibility Report (ITP, 2012) financed by <strong>the</strong> World<br />
Bank indicates savings <strong>of</strong> 3,700 to 8,500 tons/km/year.<br />
• Particulate matter (PM) savings from this project is around 167 to 239 tons or 0.5 to 0.75<br />
tons/km/year. The Gold st<strong>and</strong>ard BRT in Asia (i.e. Guangzhou BRT <strong>of</strong> 22.5 km) saves around 40 tons<br />
<strong>of</strong> PM over 10 years (i.e. 0.2 tons/km/year). 1 The Rio de Janeiro BRT saves around 0.1 to 0.3 tons<br />
1 http://www.itdp.org/documents/20110810-ITDP-GZBRTImpacts.pdf<br />
2
<strong>Environmental</strong> <strong>and</strong> <strong>Health</strong> <strong>Benefits</strong> <strong>of</strong> <strong>the</strong> <strong>Cebu</strong> City BRT: Final Report<br />
/km/year. 2 The Jakarta BRT corridor saves around 0.8 tons/km/year. 3 The higher savings in <strong>Cebu</strong><br />
compared with Guangzhou <strong>and</strong> Rio de Janeiro is due to a large modal shift from jeepneys to <strong>the</strong> BRT<br />
<strong>and</strong> <strong>the</strong> high number <strong>of</strong> pre-Euro vehicles which still ply <strong>the</strong> roads <strong>of</strong> <strong>Cebu</strong> City. The PM savings are<br />
conservative because <strong>the</strong> analysis assumed that tighter vehicle emission st<strong>and</strong>ards would be<br />
enforced during <strong>the</strong> BRT’s operation resulting in a much cleaner fleet in <strong>Cebu</strong>.<br />
• Total nitrogen oxides (NOx) savings is in <strong>the</strong> range <strong>of</strong> 1,160 to 1,780 tons or 4 to 5.5 tons/km/year. In<br />
comparison, <strong>the</strong> Guangzhou BRT saves around 20 tons/km/year. The high savings in Guangzhou is<br />
due to <strong>the</strong> increase in mixed traffic speed parameter <strong>and</strong> high efficient buses being introduced as<br />
BRT buses (Euro IV). Rio de Janeiro BRT saves around 1 to 3 tons/km/year <strong>and</strong> Jakarta BRT corridor<br />
saves around 5.5 tons/km/year which is comparable to <strong>the</strong> <strong>Cebu</strong> BRT system.<br />
• One <strong>of</strong> <strong>the</strong> limitations <strong>of</strong> <strong>the</strong> study is <strong>the</strong> use <strong>of</strong> general emission factors based on literature survey<br />
<strong>and</strong> expert judgment as <strong>the</strong> Philippines does not have local emission factors for different vehicle<br />
types <strong>and</strong> equivalent emission st<strong>and</strong>ards. The government <strong>and</strong> o<strong>the</strong>r stakeholders should support<br />
development <strong>of</strong> local emission factors for deriving better emission estimates. However, <strong>the</strong> emission<br />
estimates used in this study are comparable with those in o<strong>the</strong>r <strong>Clean</strong> Development Mechanism<br />
(CDM) <strong>and</strong> o<strong>the</strong>r BRT projects.<br />
• In terms <strong>of</strong> vehicle kilometer travel reductions, <strong>the</strong> project over its 20-year lifecycle removes an<br />
equivalent <strong>of</strong> 20,000 to 30,000 new cars from <strong>the</strong> road; 600 to 1,000 2-stroke tricycles contributing<br />
to PM reductions; <strong>and</strong> 250 to 350 new pre-Euro buses contributing to NOx reductions.<br />
• The project costs US$60-90 for 1 ton <strong>of</strong> reduction <strong>of</strong> CO2.<br />
• The project over its lifetime saves more fuel <strong>and</strong> CO2 emissions than one to two years <strong>of</strong> fuel<br />
consumed <strong>and</strong> CO2 emissions produced by <strong>the</strong> transport sector in <strong>Cebu</strong>. 4<br />
• In terms <strong>of</strong> accident fatalities, <strong>the</strong> project over its lifecycle saves around 727 lives, almost as high as<br />
<strong>the</strong> Philippines’ annual traffic fatality.<br />
The estimated health savings from <strong>the</strong> planned BRT are:<br />
• Estimated total monetary savings ranging from US$94 to 137 million over 20 years <strong>of</strong> BRT operation<br />
(or US$4.7 to 6.8 million per year) from reduction <strong>of</strong> premature mortality, adult chronic bronchitis,<br />
child acute bronchitis, respiratory hospital admissions, cardiac hospital admissions, emergency room<br />
visits, asthma attacks, restricted activity days, <strong>and</strong> respiratory symptom days.<br />
• When impacts on l<strong>and</strong> use are considered <strong>the</strong> total monetary savings is in <strong>the</strong> range <strong>of</strong> US$269-385<br />
million over <strong>the</strong> 20-year lifecycle <strong>of</strong> <strong>the</strong> BRT (or US$13 to 19 million per year).<br />
• To calibrate <strong>the</strong> <strong>Cebu</strong> BRT’s estimated PM emission reduction, <strong>the</strong> results were compared with<br />
several BRT systems. It is difficult to do a similar calibration with PM concentrations; to do so would<br />
require comparing <strong>Cebu</strong> City, a port city with high winds <strong>and</strong> with a proposed BRT <strong>of</strong> 10-16 km to a<br />
city with similar characteristics, but not, for example, with Bogota with different meteorological<br />
conditions <strong>and</strong> with hundreds <strong>of</strong> kilometers <strong>of</strong> BRT.<br />
• A limitation <strong>of</strong> <strong>the</strong> study is that <strong>the</strong> calculations are for emissions reduced from <strong>the</strong> BRT only. It did<br />
not conduct a total dispersion modeling with all <strong>the</strong> emission sources (i.e., mobile, stationary, area).<br />
2 http://164.67.121.27/files/UP/Posters%202012/26%20Lupita%20Ibarra.pdf<br />
3 http://esci-ksp.org/wp/wp-content/uploads/2012/05/Energy-<strong>and</strong>-<strong>Environmental</strong>-Impacts-<strong>of</strong>-BRT-in-APEC-Economies.pdf<br />
4 http://www.climateinvestmentfunds.org/cif/sites/climateinvestmentfunds.org/files/Approval_by_Mail_CTF_Philippines_upda<br />
ted_investment_plan_Dec_2011.pdf<br />
3
<strong>Environmental</strong> <strong>and</strong> <strong>Health</strong> <strong>Benefits</strong> <strong>of</strong> <strong>the</strong> <strong>Cebu</strong> City BRT: Final Report<br />
There will be some reduction in <strong>the</strong> ambient concentrations from BRT, but to evaluate whe<strong>the</strong>r this<br />
brings <strong>the</strong> ambient concentrations to below national <strong>and</strong> WHO guidelines cannot be said.<br />
BRT + Area Traffic Control (ATC) Scenario<br />
As part <strong>of</strong> <strong>the</strong> <strong>Cebu</strong> BRT project, travel dem<strong>and</strong> management measures are planned to be implemented including an Area<br />
Traffic Control (ATC) system. The pre-feasibility report (ITP, 2010) estimated considerably high emission savings from <strong>the</strong><br />
BRT+ATC Scenario; <strong>the</strong> report suggests a cumulative impact <strong>of</strong> 9,700 tons <strong>of</strong> PM reductions (for period 2012 to 2035) which<br />
translates to 25 tons/km/year. It is unclear whe<strong>the</strong>r <strong>the</strong> pre-feasibility analysis considered <strong>the</strong> expected significant<br />
improvements in vehicle technology <strong>and</strong> fuel quality in this 24-year period based on current trends in <strong>the</strong> Philippines <strong>and</strong> also<br />
<strong>the</strong> ASEAN.<br />
The health savings resulting from <strong>the</strong> combined BRT+ATC scenario was estimated at US$2,181 million for <strong>the</strong> appraisal period<br />
<strong>of</strong> 2012 to 2035 or US$91 million per year for 24 years. It should be noted that <strong>the</strong> CAI-Asia project team did not conduct an<br />
analysis <strong>of</strong> <strong>the</strong> emissions savings from <strong>the</strong> BRT+ATC scenario. It used <strong>the</strong> estimated PM reductions from <strong>the</strong> pre-feasibility<br />
report (ITP, 2010) to estimate <strong>the</strong> health savings from BRT+ATC. Compared to estimated health savings only from <strong>the</strong> BRT<br />
which is <strong>the</strong> subject <strong>of</strong> this report, <strong>the</strong> BRT+ATC scenario yields considerably high health savings mainly because <strong>of</strong> <strong>the</strong> high<br />
emission savings estimates taken from <strong>the</strong> pre-feasibility report (ITP, 2010).<br />
4
LIST OF ABBREVIATIONS<br />
<strong>Environmental</strong> <strong>and</strong> <strong>Health</strong> <strong>Benefits</strong> <strong>of</strong> <strong>the</strong> <strong>Cebu</strong> City BRT: Final Report<br />
ADB Asian Development Bank<br />
AUV Asian Utility Vehicle<br />
AFD Agence Française de Développement<br />
BRT Bus Rapid Transit<br />
CBD Central Business District<br />
COPD Chronic obstructive pulmonary disease<br />
CO Carbon monoxide<br />
CO2<br />
Carbon Dioxide<br />
EMB <strong>Environmental</strong> Management Bureau<br />
EU European Union<br />
UNEP United Nations Environment Programme<br />
URTI Upper respiratory tract infection<br />
GC/MSD Gas Chromatography/ Mass Selective Detector<br />
GEF Global Environment Facility<br />
NO2<br />
Nitrogen dioxide<br />
PM Particulate matter<br />
OC/EC Organic Carbon/ Elemental Carbon<br />
RH Relative Humidity<br />
SO2<br />
Sulfur Dioxide<br />
SIM-air Simple Interactive Models for better air quality<br />
TEEMP Transport Emissions Evaluation Models for Projects<br />
TVOC Total volatile organic compounds<br />
WHO World <strong>Health</strong> Organization<br />
5
CONTENTS<br />
<strong>Environmental</strong> <strong>and</strong> <strong>Health</strong> <strong>Benefits</strong> <strong>of</strong> <strong>the</strong> <strong>Cebu</strong> City BRT: Final Report<br />
EXECUTIVE SUMMARY .................................................................................................................................. 2<br />
LIST OF ABBREVIATIONS ............................................................................................................................... 5<br />
1. INTRODUCTION ......................................................................................................................................... 7<br />
2. AIR QUALITY, TRANSPORT AND HEALTH IN CEBU .................................................................................... 8<br />
3. ASSESSMENT OF ROADSIDE AIR QUALITY IN CEBU CITY......................................................................... 17<br />
4. EMISSIONS REDUCTION FROM CEBU BRT .............................................................................................. 39<br />
5. HEALTH SAVINGS FROM CEBU BRT ......................................................................................................... 54<br />
6. COMMUNICATING BENEFITS OF THE CEBU BRT ..................................................................................... 63<br />
REFERENCES ................................................................................................................................................ 65<br />
ANNEX A. Bus Maintenance ........................................................................................................................ 67<br />
ANNEX B. Simplified Atmospheric Transport Modelling System (ATMoS-4.0) for <strong>the</strong> SIM-air tool ........... 70<br />
ANNEX C. Summary <strong>of</strong> Meteorological Fields over <strong>Cebu</strong> City .................................................................... 71<br />
6
1. INTRODUCTION<br />
<strong>Environmental</strong> <strong>and</strong> <strong>Health</strong> <strong>Benefits</strong> <strong>of</strong> <strong>the</strong> <strong>Cebu</strong> City BRT: Final Report<br />
<strong>Cebu</strong> City is planning a Bus Rapid Transit (BRT) system to alleviate traffic congestion <strong>and</strong> provide an efficient<br />
<strong>and</strong> integrated public transport system. The Agence Francaise de Developpement (AFD) <strong>and</strong> <strong>the</strong> World Bank<br />
are contemplating financing <strong>the</strong> BRT system in <strong>Cebu</strong>. Beyond <strong>the</strong> construction <strong>and</strong> operation <strong>of</strong> <strong>the</strong> BRT<br />
system, <strong>the</strong> intention is to use <strong>the</strong> BRT development as a catalyst for improving o<strong>the</strong>r transport-related areas,<br />
including improved infrastructure for pedestrians in BRT catchment areas <strong>and</strong> reducing carbon dioxide (CO2)<br />
<strong>and</strong> air pollutant emissions.<br />
The <strong>Cebu</strong> City Government, <strong>the</strong> Philippine government, particularly <strong>the</strong> Department <strong>of</strong> Transportation <strong>and</strong><br />
Communications (DOTC), <strong>and</strong> <strong>the</strong> World Bank, have conducted various studies to assess <strong>the</strong> feasibility <strong>of</strong><br />
introducing <strong>the</strong> BRT system. A pre-feasibility study was completed in July 2010 <strong>and</strong> a detailed feasibility study<br />
financed by <strong>the</strong> World Bank <strong>Clean</strong> Technology Fund was completed in August 2012. The AFD financed several<br />
additional studies in support <strong>of</strong> <strong>the</strong> project, including this one.<br />
Upon <strong>the</strong> <strong>Cebu</strong> City Government’s request, <strong>the</strong> AFD supported this study to quantify <strong>the</strong> environmental <strong>and</strong><br />
health benefits <strong>of</strong> <strong>the</strong> <strong>Cebu</strong> BRT project <strong>and</strong> to recommend actions to streng<strong>the</strong>n air quality management in<br />
<strong>Cebu</strong> City. It also particularly requested that air sampling be done at strategic points along <strong>the</strong> BRT corridor to<br />
determine <strong>the</strong> baseline air pollution levels. The study was conducted by <strong>the</strong> <strong>Clean</strong> <strong>Air</strong> <strong>Initiative</strong> for Asian<br />
Cities (CAI-Asia), in partnership with Urban Emissions Pvt Ltd, an air quality think-tank based in Delhi, <strong>and</strong> <strong>the</strong><br />
Hong Kong Polytechnic University.<br />
This report provides an analysis <strong>of</strong> air samples taken along <strong>the</strong> proposed BRT corridor <strong>and</strong> estimates <strong>the</strong><br />
emissions reduction <strong>and</strong> health impacts from <strong>the</strong> proposed <strong>Cebu</strong> BRT. Chapter 2 describes <strong>the</strong> air quality <strong>and</strong><br />
transport situation, <strong>and</strong> previous air quality initiatives in <strong>Cebu</strong> City. Chapter 3 provides <strong>the</strong> air quality<br />
monitoring assessment <strong>and</strong> <strong>the</strong> proposed air quality monitoring plan for <strong>the</strong> BRT corridor. The estimated<br />
emission reduction from <strong>the</strong> BRT is provided in Chapter 4 <strong>and</strong> <strong>the</strong> impact <strong>of</strong> <strong>the</strong> BRT on air pollution <strong>and</strong><br />
health are provided in Chapter 5. Chapter 6 suggests how <strong>the</strong> environmental <strong>and</strong> health benefits <strong>of</strong> <strong>the</strong> BRT<br />
could be best communicated.<br />
7
<strong>Environmental</strong> <strong>and</strong> <strong>Health</strong> <strong>Benefits</strong> <strong>of</strong> <strong>the</strong> <strong>Cebu</strong> City BRT: Final Report<br />
2. AIR QUALITY, TRANSPORT AND HEALTH IN CEBU<br />
<strong>Cebu</strong> City is <strong>the</strong> capital <strong>of</strong> <strong>Cebu</strong> province <strong>and</strong> is considered <strong>the</strong> second most significant metropolitan area in<br />
<strong>the</strong> Philippines. 5 <strong>Cebu</strong> City covers an area <strong>of</strong> about 315 km 2 <strong>and</strong> has 882,445 inhabitants in 2011; 6 while<br />
Metro <strong>Cebu</strong>, comprising <strong>of</strong> 10 cities <strong>and</strong> municipalities, covers an area <strong>of</strong> about 1,163 km 2 with about<br />
2,551,100 people. 7 In comparison, Metro Manila covers an area <strong>of</strong> about 636 km 2 with a population <strong>of</strong><br />
11,855,975 according to <strong>the</strong> latest census. 8<br />
Motor vehicles registered in Region 7 (<strong>of</strong> which <strong>Cebu</strong> City forms part) increased by 15% from 2009 to 2011.<br />
Total registered vehicles in 2011 were 574,623. The registered fleet comprised <strong>of</strong> motorcycles/ tricycles<br />
(57%), utility vehicles (25%), cars (8%), trucks (6%), sports utility vehicles (4%), <strong>and</strong> trailers <strong>and</strong> buses (less<br />
than 1%) (Figure 1). 9 In 2011, <strong>Cebu</strong> Province accounted for 74% <strong>of</strong> motor vehicle registration renewals <strong>and</strong><br />
83% <strong>of</strong> new motor vehicle registrations.<br />
Figure 1: Motor Vehicles Registered in Region 7 (2011)<br />
Source: EMB Region 7, 2012<br />
5 <strong>Cebu</strong> City is considered <strong>the</strong> second biggest growth center next to Manila. Kitakyushu <strong>Initiative</strong>, 2003<br />
6 S. Ygona. August 28, 2012 presentation on State <strong>of</strong> <strong>Health</strong> <strong>of</strong> <strong>Cebu</strong> City’s Population citing NSO 2010 survey<br />
7 Metro <strong>Cebu</strong> covers <strong>the</strong>se cities <strong>and</strong> municipalities: <strong>Cebu</strong> City, M<strong>and</strong>aue City, Lapu-Lapu City, Talisay City, Naga,<br />
Minglanilla, Liloan, Consolacion, Cordova, <strong>and</strong> Compostela. ITP. Study <strong>and</strong> Concept Plan for a Demonstration Bus<br />
Rapid Transit Corridor (Final Report v1). June 2010.<br />
8 National Statistical Coordination Board, 2010. Census <strong>of</strong> Housing <strong>and</strong> Population<br />
9 Presentation <strong>of</strong> A. Castillon (EMB-Region 7) at Roundtable on <strong>Air</strong> Pollution <strong>and</strong> <strong>Health</strong> (3 July 2012). <strong>Cebu</strong> City<br />
8
<strong>Environmental</strong> <strong>and</strong> <strong>Health</strong> <strong>Benefits</strong> <strong>of</strong> <strong>the</strong> <strong>Cebu</strong> City BRT: Final Report<br />
Among <strong>the</strong> challenges brought by <strong>Cebu</strong> City’s motorization are: traffic congestion, air pollution, decrease in<br />
public transport patronage, <strong>and</strong> high number <strong>of</strong> traffic accidents. 10 This Chapter describes <strong>the</strong> air pollution<br />
levels, contribution <strong>of</strong> <strong>the</strong> transport sector to air pollution, health situation with focus on air pollution-related<br />
illnesses, <strong>and</strong> an overview <strong>of</strong> previous air quality studies <strong>and</strong> projects in <strong>Cebu</strong> City to help address <strong>the</strong>se<br />
challenges.<br />
Particulate matter (PM10) levels in <strong>Cebu</strong> City’s ambient air from 2008-2011, 11 <strong>and</strong> in <strong>the</strong> first quarter <strong>of</strong> 2012<br />
exceed <strong>the</strong> 60µg/m 3 Philippine guideline value (annual) <strong>and</strong> <strong>the</strong> 20µg/m 3 World <strong>Health</strong> Organization (WHO)<br />
air quality guideline (annual) (Figure 2). Reducing PM levels is a must because <strong>of</strong> <strong>the</strong> serious health effects <strong>of</strong><br />
exposure to ambient particulate pollution which include an increased risk for respiratory <strong>and</strong> cardiovascular<br />
diseases <strong>and</strong> also increased short- <strong>and</strong> long-term mortality. 12<br />
Ambient levels <strong>of</strong> sulfur dioxide (SO2), nitrogen dioxide (NO2), <strong>and</strong> ozone (O3) from 2003 to 2011 (Figures 3 to<br />
5) were below <strong>the</strong> Philippine <strong>and</strong> WHO air quality guidelines. 13 No data for SO2, NO2, <strong>and</strong> O3 are available for<br />
<strong>the</strong> first quarter <strong>of</strong> 2012 as <strong>the</strong> OPSIS Telemetry System <strong>of</strong> <strong>the</strong> DENR was not functioning. 14<br />
10<br />
UP-NCTS, undated<br />
11<br />
Mabolo air quality monitoring station records higher concentration compared to <strong>the</strong> <strong>Cebu</strong> Business Park<br />
monitoring station. Presentation <strong>of</strong> A. Castillon (EMB-Region 7) at Roundtable on <strong>Air</strong> Pollution <strong>and</strong> <strong>Health</strong> (3 July<br />
2012). <strong>Cebu</strong> City<br />
12<br />
WHO. <strong>Air</strong> Quality Guidelines – Global Update 2005. 2006<br />
13<br />
DENR, 2010; CAI-Asia; 2010<br />
14<br />
Presentation <strong>of</strong> A. Castillon (EMB-Region 7) at Roundtable on <strong>Air</strong> Pollution <strong>and</strong> <strong>Health</strong> (3 July 2012). <strong>Cebu</strong> City<br />
9
Figure 2. : Levels <strong>of</strong> PM 10 Concentration in <strong>Cebu</strong><br />
City for <strong>the</strong> 1st Quarter <strong>of</strong> 2012, Source EMB<br />
Region 7, (modified)<br />
Figure 4. Levels <strong>of</strong> NO2 Concentrations in <strong>Cebu</strong><br />
From 2003 to 2011, Source EMB Region 7 (modified)<br />
The National Ambient <strong>Air</strong> Quality Guideline Values (NAAQGV) in <strong>the</strong><br />
PM10, total suspended particulates (TSP), SO<br />
Compared with <strong>the</strong> World <strong>Health</strong> Organization (WHO) Guidelines, <strong>the</strong> NAAQGV for PM<br />
annual) <strong>and</strong> SO2 (24-hour) are more lenient (Tab<br />
relatively more stringent than <strong>the</strong> WHO Guideline whilst <strong>the</strong> CO <strong>and</strong> Pb NAAQGVs are generally comparable<br />
with <strong>the</strong> WHO Guidelines. 15<br />
The National Ambient <strong>Air</strong> Quality Guideline Values (NAAQGV) in <strong>the</strong> Philippine <strong>Clean</strong> <strong>Air</strong> Act comprise <strong>of</strong><br />
, total suspended particulates (TSP), SO2, NO2, carbon arbon monoxide (CO), ozone (O3), (O <strong>and</strong> lead (Pb).<br />
Compared with <strong>the</strong> World <strong>Health</strong> Organization (WHO) Guidelines, <strong>the</strong> NAAQGV for PM10 PM (24-hour <strong>and</strong><br />
hour) are more lenient (Table 1). On <strong>the</strong> o<strong>the</strong>r h<strong>and</strong>, <strong>the</strong> 8-hour hour NAAQGV for O3 O is<br />
relatively more stringent than <strong>the</strong> WHO Guideline whilst <strong>the</strong> CO <strong>and</strong> Pb NAAQGVs are generally comparable<br />
15<br />
<strong>Clean</strong> <strong>Air</strong> <strong>Initiative</strong> for Asian Cities, 2010<br />
<strong>Environmental</strong> <strong>and</strong> <strong>Health</strong> <strong>Benefits</strong> <strong>of</strong> <strong>the</strong> <strong>Cebu</strong> City BRT: Final Report<br />
Figure 3. : Levels <strong>of</strong> SO2 Concentration in <strong>Cebu</strong> City from<br />
2003 to 2011, Source EMB Region 7 (modified)<br />
Figure 5. Levels <strong>of</strong> O3 Concentrations in <strong>Cebu</strong><br />
From 2003 to 2011, Source EMB Region 7 (modified)<br />
10
<strong>Environmental</strong> <strong>and</strong> <strong>Health</strong> <strong>Benefits</strong> <strong>of</strong> <strong>the</strong> <strong>Cebu</strong> City BRT: Final Report<br />
Table 1. NAAQGV vs. WHO Guidelines (µg/m 3 )<br />
Pollutant Average Time NAAQGV WHO Guidelines<br />
PM10 24-hour 150 50<br />
Annual 60 20<br />
TSP 24-hour 230 -<br />
Annual 90 -<br />
NO2 1-hour - 200<br />
24-hour 150 -<br />
SO2 10-minute - 500<br />
1-hour - -<br />
O3 1-hour 140<br />
8-hour 60 100<br />
24-hour -<br />
CO 1-hour 35,000 30,000<br />
8-hour 10,000 10,000<br />
Pb 3-month 1.5 -<br />
Annual 1.0 0.5<br />
The transport sector is a major contributor to air pollution in <strong>Cebu</strong> City. The 2011 emissions inventory for<br />
Region 7, <strong>of</strong> which <strong>Cebu</strong> City forms part, shows mobile sources contributing significantly to PM (50%), SOx<br />
(49%) <strong>and</strong> CO (77%) emissions (Figure 6). 16,17<br />
100%<br />
90%<br />
80%<br />
70%<br />
60%<br />
50%<br />
40%<br />
30%<br />
20%<br />
10%<br />
0%<br />
PM SOx NOx CO VOC/TOG<br />
Figure 6. Emissions Inventory 2011 for Region 7<br />
Source: EMB Region 7, 2012 (based on CAI-Asia re-calculated figures)<br />
The health impact <strong>of</strong> air pollution in Metro <strong>Cebu</strong> was documented in <strong>the</strong> 2002 World Bank Environment<br />
Monitor for <strong>the</strong> Philippines. It valued <strong>the</strong> health impacts <strong>and</strong> cost <strong>of</strong> exposure to PM10 in Metro Areas in <strong>the</strong><br />
16 The DENR <strong>Environmental</strong> Management Bureau-Region 7 conducts emissions inventories <strong>of</strong> air pollution sources<br />
for <strong>the</strong> Central Visayas region (<strong>Cebu</strong> City included) once every three years. PIA, 2011<br />
17 Presentation <strong>of</strong> A. Castillon (EMB-Region 7) at Roundtable on <strong>Air</strong> Pollution <strong>and</strong> <strong>Health</strong> (3 July 2012). <strong>Cebu</strong> City<br />
Area<br />
Mobile<br />
Stationary<br />
11
<strong>Environmental</strong> <strong>and</strong> <strong>Health</strong> <strong>Benefits</strong> <strong>of</strong> <strong>the</strong> <strong>Cebu</strong> City BRT: Final Report<br />
Philippines in 2001 to about US$432 million. And out <strong>of</strong> this, costs in Metro <strong>Cebu</strong> totals US$16 million while<br />
for Metro Manila, $US392 million. These estimates include excess deaths, chronic bronchitis, <strong>and</strong> respiratory<br />
symptoms. 18<br />
<strong>Cebu</strong> City <strong>Health</strong> Office data shows that top four <strong>of</strong> <strong>the</strong> ten leading causes <strong>of</strong> death in <strong>Cebu</strong> City in 2011 −<br />
cardiovascular diseases (29%), pneumonia (24%), neoplasms (including lung cancers) (12%), <strong>and</strong> pulmonary<br />
tuberculosis (TB) (6%) (Figure 7), may be related to or aggravated by air pollution levels. 19 Of <strong>the</strong> ten leading<br />
causes <strong>of</strong> illness in <strong>Cebu</strong> City in 2011, pneumonia <strong>and</strong> upper respiratory tract infections may be related or<br />
aggravated by air pollution levels.<br />
2%<br />
4%<br />
2%2%1%<br />
4%<br />
6%<br />
15%<br />
12%<br />
24%<br />
29%<br />
Cardiovascular diseases<br />
Pneumonia<br />
Neoplasms/ Cancers (Lung<br />
cancers – 76)<br />
Pulmonary TB<br />
Medico-legal cases<br />
End stage renal diseases<br />
Intra Uterine Fetal Death<br />
Diabetes Mellitus<br />
Diarrhea<br />
Bleeding Peptic Ulcer<br />
Disease<br />
Figure 7. Top 10 Leading Causes <strong>of</strong> Death in <strong>Cebu</strong> City for 2011<br />
Source: <strong>Cebu</strong> City <strong>Health</strong> Office, 2012 (based on CAI-Asia re-calculated figures)<br />
Trends in <strong>the</strong> number <strong>of</strong> respiratory-related deaths <strong>and</strong> illnesses, particularly pneumonia, bronchial asthma<br />
chronic obstructive pulmonary diseases (COPD), <strong>and</strong> lung cancer from 2007 to 2011 are plotted in Figure 8.<br />
Pneumonia deaths increased 120% from 2010 to 2011. Figure 9 shows <strong>the</strong> age distribution <strong>of</strong> <strong>the</strong> death<br />
cases. Pneumonia deaths are largest among <strong>the</strong> 15-64 years age group. Deaths from bronchial asthma occur<br />
most in <strong>the</strong> 50 to >65 years age group. COPD <strong>and</strong> lung cancer deaths occur most in <strong>the</strong> >65 years age group.<br />
Upper respiratory tract infection cases are on a steady rise from 28,390 in 2007 to 41,498 in 2011 (Figure 10).<br />
18 Simplified methodologies were used to calculate excess deaths, chronic bronchitis, <strong>and</strong> respiratory symptoms<br />
caused by PM10. The total cost caused by PM10 was estimated by multiplying <strong>the</strong> unit costs with <strong>the</strong> respective<br />
cases <strong>and</strong> <strong>the</strong>n adding up <strong>the</strong> costs for different categories. It is expected that since only death, chronic bronchitis<br />
<strong>and</strong> respiratory symptoms caused by PM10 are included in <strong>the</strong> health damage estimation <strong>the</strong> total costs presented<br />
are conservative estimates <strong>of</strong> <strong>the</strong> total costs caused by air pollution. (World Bank, 2002. Philippines Environment<br />
Monitor: <strong>Air</strong> Quality)<br />
19 S. Ygona. August 28, 2012 presentation on State <strong>of</strong> <strong>Health</strong> <strong>of</strong> <strong>Cebu</strong> City’s Population<br />
12
8000<br />
6000<br />
4000<br />
2000<br />
Documented Number<br />
Pneumonia<br />
0<br />
2007 2008 2009 2010 2011<br />
200<br />
150<br />
100<br />
50<br />
Cases Deaths<br />
0<br />
2007 2008 2009 2010 2011<br />
<strong>Environmental</strong> <strong>and</strong> <strong>Health</strong> <strong>Benefits</strong> <strong>of</strong> <strong>the</strong> <strong>Cebu</strong> City BRT: Final Report<br />
1500<br />
1000<br />
0<br />
2007 2008 2009 2010 2011<br />
Figure 8. Trends in Respiratory-related Deaths <strong>and</strong> Cases in <strong>Cebu</strong> City, 2007-2011<br />
Source: <strong>Cebu</strong> City <strong>Health</strong> Office, 2012<br />
100%<br />
90%<br />
80%<br />
70%<br />
60%<br />
50%<br />
40%<br />
30%<br />
20%<br />
10%<br />
0%<br />
COPD<br />
Cases Deaths<br />
PNEUMONIA BRONCHIAL<br />
ASTHMA<br />
Figure 9. Age Distribution <strong>of</strong> Deaths Due to Respiratory Disease for 2011<br />
Source: <strong>Cebu</strong> City <strong>Health</strong> Office, 2012<br />
Documented Number<br />
Documented Number<br />
500<br />
100<br />
80<br />
60<br />
40<br />
20<br />
Bronchial Asthma<br />
Cases Deaths<br />
Lung Cancer<br />
0<br />
2007 2008 2009 2010 2011<br />
COPD LUNG CANCER<br />
Cases Deaths<br />
>65 yrs.<br />
50-64 yrs.<br />
15-49 yrs.<br />
5-14 yrs.<br />
1-4 yrs.<br />
Documented Number<br />
45000<br />
40000<br />
35000<br />
30000<br />
25000<br />
20000<br />
15000<br />
10000<br />
5000<br />
0<br />
<strong>Environmental</strong> <strong>and</strong> <strong>Health</strong> <strong>Benefits</strong> <strong>of</strong> <strong>the</strong> <strong>Cebu</strong> City BRT: Final Report<br />
2007 2008 2009 2010 2011<br />
Figure 10. Upper Respiratory Tract Infection (URTI) cases, 2007 to 2011<br />
Source: <strong>Cebu</strong> City <strong>Health</strong> Office, 2012<br />
Map 1 shows <strong>the</strong> spatial relation <strong>of</strong> respiratory illnesses <strong>and</strong> deaths per barangay (village) in <strong>Cebu</strong> City <strong>and</strong><br />
<strong>the</strong> planned <strong>Cebu</strong> BRT System. With emissions reductions anticipated from <strong>the</strong> planned <strong>Cebu</strong> BRT System,<br />
residents <strong>of</strong> <strong>the</strong>se barangays would likely benefit from <strong>the</strong> improved air quality <strong>and</strong> reduced health impacts<br />
from roadside air pollution.<br />
14
<strong>Environmental</strong> <strong>and</strong> <strong>Health</strong> <strong>Benefits</strong> <strong>of</strong> <strong>the</strong> <strong>Cebu</strong> City BRT: Final Report<br />
Map 1. Respiratory Related Deaths for Selected Barangays in <strong>Cebu</strong> City, 2011<br />
Source: Data from <strong>Cebu</strong> City <strong>Health</strong> Office, 2012<br />
Previous foreign-assisted projects sought to streng<strong>the</strong>n <strong>Cebu</strong> City’s capacity to manage air quality (e.g.,<br />
Kitakyushu City <strong>and</strong> PCAPI’s Metro <strong>Cebu</strong> <strong>Air</strong> Quality Monitoring Project in 2002, USAID Energy <strong>and</strong> <strong>Clean</strong> <strong>Air</strong><br />
Project/ECAP 2004-2009). These projects helped set <strong>the</strong> foundation for science-based <strong>and</strong> participatory air<br />
quality management. The <strong>Air</strong> Quality Monitoring Project monitored <strong>the</strong> levels <strong>of</strong> a limited number <strong>of</strong><br />
pollutants in several locations for five (5) months in <strong>Cebu</strong> City <strong>and</strong> nearby cities in 2002. The USAID ECAP,<br />
among o<strong>the</strong>rs, supported stakeholders in <strong>the</strong> development <strong>of</strong> <strong>Clean</strong> <strong>Air</strong> Action Plan <strong>and</strong> <strong>the</strong> drafting <strong>and</strong><br />
eventual approval <strong>of</strong> <strong>Cebu</strong> City’s Vehicle Emissions Control Ordinance (USAID ECAP, 2007).<br />
Previous studies also assessed air quality levels in <strong>Cebu</strong> City. A study conducted by Sinogaya <strong>and</strong> Galapate<br />
published in 2009 sampled NO2 <strong>and</strong> SO2 in <strong>the</strong> urban area <strong>of</strong> Metro <strong>Cebu</strong> (6 sampling sites) <strong>and</strong> remote sites<br />
(2 sampling sites). Higher NO2 levels were found in <strong>the</strong> urban sites compared to remote areas. NO2 levels at<br />
15
<strong>Environmental</strong> <strong>and</strong> <strong>Health</strong> <strong>Benefits</strong> <strong>of</strong> <strong>the</strong> <strong>Cebu</strong> City BRT: Final Report<br />
Jones Avenue (now called Osmeña Boulevard) consistently exceeded <strong>the</strong> maximum allowed value in <strong>the</strong><br />
Philippine <strong>Clean</strong> <strong>Air</strong> Act. 20<br />
Ongoing <strong>and</strong> future initiatives in <strong>the</strong> City aimed at improving air quality <strong>and</strong> urban transport include <strong>the</strong><br />
proposed Bus Rapid Transit (BRT) system <strong>and</strong> <strong>the</strong> city’s anti-smoke belching campaign.<br />
Several important stakeholders (e.g., city government, church, youth, environment advocates) have openly<br />
expressed concern about <strong>the</strong> city’s air pollution <strong>and</strong> unsustainable transport woes. Among <strong>the</strong>se civil society<br />
advocacies are <strong>the</strong> “Road Revolution <strong>Cebu</strong>” working for better public transport <strong>and</strong> pedestrian facilities <strong>and</strong><br />
<strong>the</strong> “Movement for Livable <strong>Cebu</strong>” opposing recent plans for <strong>the</strong> construction <strong>of</strong> more flyovers.<br />
20 Sinogaya <strong>and</strong> Galapate. Spatial distributions <strong>and</strong> temporal variations <strong>of</strong> NO2 <strong>and</strong> SO2 in urban <strong>and</strong> remote sites in<br />
<strong>Cebu</strong> Metropolitan Area. Philippine Journal <strong>of</strong> Natural Sciences Vol 14 No 2 (2009) 99-112. 2009<br />
16
<strong>Environmental</strong> <strong>and</strong> <strong>Health</strong> <strong>Benefits</strong> <strong>of</strong> <strong>the</strong> <strong>Cebu</strong> City BRT: Final Report<br />
3. ASSESSMENT OF ROADSIDE AIR QUALITY IN CEBU CITY<br />
The project team took air samples along <strong>the</strong> proposed BRT route to determine <strong>the</strong> baseline roadside air<br />
quality, <strong>and</strong> assessed <strong>the</strong> existing air quality monitoring system in <strong>Cebu</strong> City. Based on <strong>the</strong>se, an air quality<br />
monitoring plan for <strong>the</strong> <strong>Cebu</strong> BRT is proposed.<br />
3.1 Selection <strong>of</strong> air quality monitoring sites<br />
According to <strong>the</strong> <strong>Cebu</strong> BRT Feasibility Study (ITP, 2012), <strong>the</strong> proposed BRT route as shown in Figure 11 below<br />
consists <strong>of</strong> 16 kilometers from Bulacao to Ayala Shopping Mall. According to <strong>the</strong> <strong>Cebu</strong> City Traffic Operations<br />
Management (CITOM) <strong>and</strong> from site investigation by <strong>the</strong> project team, <strong>the</strong> busiest roads along <strong>the</strong> route are<br />
Escario Road <strong>and</strong> Osmeña Boulevard under <strong>the</strong> existing traffic conditions in terms <strong>of</strong> both vehicles <strong>and</strong><br />
pedestrian flows.<br />
Figure 11. Proposed Bus Rapid Transit Route in <strong>Cebu</strong><br />
Source: <strong>Environmental</strong> Impact Scoping Report for <strong>Cebu</strong> BRT Feasibility Study (ITP, February 2012)<br />
To identify suitable locations for <strong>the</strong> air sampling, <strong>the</strong> project team adopted <strong>the</strong>se criteria: (a) <strong>the</strong> air quality<br />
to be measured be representative <strong>of</strong> <strong>the</strong> vehicular traffic emissions along <strong>the</strong> proposed BRT corridor; (b)<br />
<strong>the</strong>re should be minimal disruption <strong>and</strong> disturbances owing to o<strong>the</strong>r activities such as loading/ unloading/<br />
17
<strong>Environmental</strong> <strong>and</strong> <strong>Health</strong> <strong>Benefits</strong> <strong>of</strong> <strong>the</strong> <strong>Cebu</strong> City BRT: Final Report<br />
parking on <strong>the</strong> road to enable maximum data to be collected; <strong>and</strong> (c) <strong>the</strong>re are no o<strong>the</strong>r major pollution<br />
sources, for example, factories <strong>and</strong> open burning, in <strong>the</strong> vicinity.<br />
With <strong>the</strong>se criteria in mind, <strong>the</strong> project team performed a site investigation in June 2012 along <strong>the</strong> entire<br />
proposed BRT route to identify appropriate locations for <strong>the</strong> air sampling. Two locations, one at <strong>the</strong> signalcontrolled<br />
junction <strong>of</strong>f <strong>Cebu</strong> Capitol <strong>and</strong> <strong>the</strong> o<strong>the</strong>r along a straight section <strong>of</strong> N. Bacalso Avenue <strong>of</strong>f <strong>the</strong> South<br />
Bus Terminal were identified. Photographs <strong>of</strong> <strong>the</strong>se two locations are shown in Figures 12 <strong>and</strong> 13 while<br />
Figure 14 shows <strong>the</strong> location <strong>of</strong> <strong>the</strong> sampling stations along <strong>the</strong> proposed BRT corridor.<br />
Figure 12: Location A at <strong>the</strong> Escario Road/<br />
Osmeña Boulevard signalized controlled<br />
junction <strong>of</strong>f <strong>Cebu</strong> Capitol<br />
Figure 13. Location B at <strong>the</strong> straight road section <strong>of</strong>f<br />
<strong>the</strong> South Bus Terminal<br />
18
<strong>Environmental</strong> <strong>and</strong> <strong>Health</strong> <strong>Benefits</strong> <strong>of</strong> <strong>the</strong> <strong>Cebu</strong> City BRT: Final Report<br />
Figure 14. Location <strong>of</strong> <strong>Air</strong> Quality Sampling Stations<br />
Note: Figure is not to scale as sourced from Google Map<br />
3.2 On-site <strong>Air</strong> Sampling <strong>and</strong> Measurement<br />
<strong>Air</strong> sampling <strong>and</strong> measurements were carried out for three (3) hours during <strong>the</strong> morning <strong>and</strong> in <strong>the</strong> evening<br />
rush hours over three (3) days including on a weekend <strong>and</strong> weekdays. Table 2 presents <strong>the</strong> details <strong>of</strong> <strong>the</strong><br />
sampling exercise. As such, indicative levels <strong>of</strong> <strong>the</strong> air quality with consideration to existing traffic conditions<br />
on both weekend <strong>and</strong> weekdays can be assessed. Table 3 shows <strong>the</strong> air pollutants sampled <strong>and</strong> <strong>the</strong><br />
equipment used for air sampling.<br />
Table 2. Sampling Period<br />
Date Period Duration Location<br />
01 July 2012 (Sunday) Morning 0900–1200 A<br />
Evening 1730–1830 A<br />
02 July 2012 (Monday) Morning 0630–0930 A<br />
Evening 1730–2030 A<br />
03 July 2012 (Tuesday) Morning 0630–0900 B<br />
Evening 1700–2000 B<br />
19
<strong>Environmental</strong> <strong>and</strong> <strong>Health</strong> <strong>Benefits</strong> <strong>of</strong> <strong>the</strong> <strong>Cebu</strong> City BRT: Final Report<br />
The key objective <strong>of</strong> <strong>the</strong> air sampling was to measure <strong>the</strong> baseline air quality. For this purpose, three days <strong>of</strong><br />
air sampling <strong>and</strong> measurements on two working days <strong>and</strong> a weekend day are sufficient. Students from <strong>the</strong><br />
University <strong>of</strong> San Carlos Engineering Department <strong>and</strong> University <strong>of</strong> <strong>the</strong> Philippines <strong>Cebu</strong>, toge<strong>the</strong>r with <strong>Cebu</strong><br />
City Government staff participated in <strong>the</strong> air sampling <strong>and</strong> vehicle count.<br />
Figure 15. <strong>Air</strong> sampling <strong>and</strong> measurement <strong>of</strong>f <strong>Cebu</strong> Capitol<br />
Table 3. <strong>Air</strong> Quality Monitoring Equipment Used<br />
Equipment/ Instrument <strong>Air</strong> Pollutant Sampled/<br />
Measured<br />
Photograph<br />
TSI 8520 Dust Track Aerosol<br />
Portable Real-time Monitoring Equipment<br />
Particulate matter, with<br />
Monitor<br />
aerodynamic diameter ranging<br />
from 0.1 to 2.5 microns<br />
20
Q-track 8551 IAQ Monitor CO2, CO, temperature <strong>and</strong><br />
humidity<br />
ppbRAE Plus TVOC Monitor Total volatile organic<br />
compounds (TVOC) levels,<br />
measured in parts per billion<br />
(ppb)<br />
Portable Sampling Equipment<br />
<strong>Air</strong>metrics MiniVol Particulate Matter, with<br />
aerodynamic diameter less<br />
than 2.5 microns (PM2.5)<br />
<strong>Environmental</strong> <strong>and</strong> <strong>Health</strong> <strong>Benefits</strong> <strong>of</strong> <strong>the</strong> <strong>Cebu</strong> City BRT: Final Report<br />
21
Stainless Steel Canisters<br />
(Volume <strong>of</strong> 2.0 L)<br />
<strong>Environmental</strong> <strong>and</strong> <strong>Health</strong> <strong>Benefits</strong> <strong>of</strong> <strong>the</strong> <strong>Cebu</strong> City BRT: Final Report<br />
VOC toxic species<br />
The air pollutants measured were selected for specific reasons. Ultra-fine particulates (0.1 to 2.5 μm) were<br />
selected because <strong>the</strong>se air pollutants are typical vehicular emissions that are most harmful to people’s<br />
health. CO2, CO, temperature <strong>and</strong> humidity were measured because CO2 is related to global warming, CO<br />
indicates <strong>the</strong> vehicle engine efficiency, <strong>and</strong> temperature <strong>and</strong> humidity affect formation <strong>of</strong> o<strong>the</strong>r pollutants.<br />
Volatile organic compounds (VOCs) were measured because some species <strong>of</strong> VOCs are toxic <strong>and</strong><br />
carcinogenic; VOCs also contribute to photochemical reactions that form ozone <strong>and</strong> o<strong>the</strong>r pollutants.<br />
The equipment used for air sampling <strong>and</strong> measurement were <strong>of</strong> different types. Some measured <strong>and</strong><br />
recorded data real-time (e.g., TSI 8520 Dust Track Aerosol Monitor, Q-track 8551 IAQ Monitor, ppbRAE Plus<br />
TVOC Monitor) while o<strong>the</strong>rs collected samples requiring fur<strong>the</strong>r analysis. <strong>Air</strong> samples collected using<br />
canisters needed to be fur<strong>the</strong>r analyzed using Gas Chromatography/ Mass Selective Detector (GC/MSD) in<br />
<strong>the</strong> Hong Kong Polytechnic University laboratory. The Minivols captured PM samples using filters that needed<br />
to be fur<strong>the</strong>r analyzed for Organic Carbon/ Elemental Carbon (OC/EC) composition.<br />
Vehicle composition surveys <strong>and</strong> vehicle flow counts were performed simultaneously with air sampling. The<br />
traffic information helps explain <strong>the</strong> variations <strong>of</strong> air quality.<br />
3.3 Results <strong>and</strong> Discussion<br />
A. Field Observations<br />
Table 4 presents observations during <strong>the</strong> course <strong>of</strong> <strong>the</strong> sampling exercise. The onsite conditions (i.e.,<br />
wea<strong>the</strong>r conditions, traffic flow <strong>and</strong> o<strong>the</strong>rs) may have influenced <strong>the</strong> air quality levels in <strong>the</strong> area at <strong>the</strong> time<br />
<strong>of</strong> sampling.<br />
Table 4. Site Observations during Sampling Exercise<br />
Date Period Duration Site Observations<br />
01 July 2012<br />
(Sunday)<br />
Morning 0900–1200 Intermittent rain showers from 0500 to 0800 prior to<br />
sampling start.<br />
Evening 1730–1830 Sampling was stopped due to change in wea<strong>the</strong>r (i.e., from<br />
22
02 July 2012<br />
(Monday)<br />
03 July 2012<br />
(Tuesday)<br />
B. Traffic Flow<br />
<strong>Environmental</strong> <strong>and</strong> <strong>Health</strong> <strong>Benefits</strong> <strong>of</strong> <strong>the</strong> <strong>Cebu</strong> City BRT: Final Report<br />
Morning 0630–0930<br />
drizzle to rain shower).<br />
No rain but <strong>the</strong> sky was overcast.<br />
Evening 1730–2030 Intermittent drizzles<br />
Morning 0630–0900 Clear skies with light to moderate winds (easterlysou<strong>the</strong>asterly)<br />
Evening 1700–2000 Clear skies at first; heavy rain clouds blown by easterly winds<br />
started to cover <strong>the</strong> area around sunset (6PM), but it never<br />
rained during <strong>the</strong> sampling exercise.<br />
Figures 16 <strong>and</strong> 17 show <strong>the</strong> traffic flows in all directions near <strong>the</strong> <strong>Cebu</strong> Capitol (Location A) in <strong>the</strong> morning<br />
<strong>and</strong> evening peak on a Sunday (1 July2012) <strong>and</strong> a Monday (2 July2012). Referring to <strong>the</strong> Figures, traffic flow<br />
in vehicle per hour (veh/hr) at <strong>the</strong> <strong>Cebu</strong> Capitol on a Monday morning peak is much higher than that on<br />
Sunday, i.e., 11,610 veh/hr compared to 2,796 veh/hr. The corresponding evening peaks show very little<br />
difference, i.e., 3,533 veh/hr compared to 3,388 veh/hr.<br />
Two-wheelers are <strong>the</strong> major mode, followed by Asian Utility Vehicles (AUV)/Pick-up, Jeepneys, Taxis <strong>and</strong><br />
Sedans. There is a very small number <strong>of</strong> buses.<br />
Figure 18 shows traffic flow in both directions near <strong>the</strong> South Bus Terminal (Location B) on a Tuesday (3 July<br />
2012) in both <strong>the</strong> morning <strong>and</strong> evening peak hours. There is not much difference in <strong>the</strong> morning <strong>and</strong> evening<br />
peak flow, i.e., 3,404 compared to 3,043 veh/hr. The major mode is again 2-wheelers, <strong>the</strong>n taxis, multi-cabs<br />
<strong>and</strong> jeepneys. There are some buses as <strong>the</strong> location is just outside <strong>the</strong> South Bus Terminal.<br />
23
Figure 16. Traffic Flow <strong>of</strong>f Provincial Capitol on Figure 17. Traffic Flow <strong>of</strong>f Provincial Capitol on<br />
Sunday<br />
Monday<br />
C. Particulates<br />
<strong>Environmental</strong> <strong>and</strong> <strong>Health</strong> <strong>Benefits</strong> <strong>of</strong> <strong>the</strong> <strong>Cebu</strong> City BRT: Final Report<br />
Figure 18. Traffic Flow <strong>of</strong>f South Bus Terminal on<br />
Tuesday<br />
PM2.5 concentrations were measured using <strong>the</strong> Mini-Volume sampler over a 3-hour hour period. This equipment<br />
measures PM using filters.<br />
The PM2.5 concentration <strong>of</strong>f <strong>the</strong> <strong>Cebu</strong> Capitol is shown in Figure 19. The PM2.5 levels on both <strong>the</strong> weekend<br />
<strong>and</strong> weekday exceed <strong>the</strong> WHO air quality guideline (25 μg/m<br />
eight times higher than <strong>the</strong> WHO guideline value.<br />
3 levels on both <strong>the</strong> weekend<br />
for daily average); ; levels reached 200μg/m 200<br />
eight times higher than <strong>the</strong> WHO guideline value.<br />
3 ,<br />
24
The PM2.5 concentration on Sunday is about 60% lower than that on Monday <strong>and</strong> especially in <strong>the</strong> evening,<br />
<strong>the</strong> difference could be more than 70%. This is most likely due to <strong>the</strong> traffic decrease on weekends. The<br />
traffic in <strong>the</strong> Monday morning peak was 11,610 vehicles per hour compared to 2,796 vehicles per hour on<br />
Sunday morning. Ano<strong>the</strong>r factor which cannot be ignored is that it drizzled during <strong>the</strong> sampling period on<br />
Sunday; a relatively low PM2.5 might have been measured measured.<br />
Figure 19. PM2.5 Levels <strong>of</strong>f Provincial Capitol<br />
<strong>Environmental</strong> <strong>and</strong> <strong>Health</strong> <strong>Benefits</strong> <strong>of</strong> <strong>the</strong> <strong>Cebu</strong> City BRT: Final Report<br />
Figure 20. PM2.5 Levels <strong>of</strong>f Provincial Capitol<br />
(Location A) <strong>and</strong> South Bus Terminal (Location B)<br />
Figure 20 compares <strong>the</strong> PM2.5 levels at <strong>the</strong> two sites namely at Escario Road/ Osmeña Boulevard <strong>of</strong>f <strong>the</strong> <strong>Cebu</strong><br />
Capitol (Location A) <strong>and</strong> <strong>the</strong> straight road section <strong>of</strong>f <strong>the</strong> South Bus Terminal (Location B). Location A has 31%<br />
<strong>and</strong> 51% more PM2.5 concentration than that <strong>of</strong> Location B at AM <strong>and</strong> PM periods respectively. The PM2.5<br />
levels at both sites exceed <strong>the</strong> World Heal <strong>Health</strong> Organization PM2.5 guideline values. . With reference to <strong>the</strong> traffic<br />
flows at <strong>the</strong>se two locations, , traffic flows are much higher at Location A (particular particularly <strong>the</strong> number <strong>of</strong><br />
Jeepneys). . Jeepneys in <strong>Cebu</strong> City, like most jeepneys in <strong>the</strong> Philippines, are diesel diesel-fueled <strong>and</strong> usually run on<br />
old second-h<strong>and</strong> engines which can be a major source <strong>of</strong> road roadside PM2.5 emissions.<br />
The graphs also compare air quality levels with <strong>the</strong> planned PM2.5 st<strong>and</strong>ard (75 μg/m<br />
24-hr average. The Philippines does not have any ambient PM<br />
led by Department <strong>of</strong> Environment <strong>and</strong> Natural Resources<br />
Guideline value for PM2.5. A draft administrative order<br />
3 ) for <strong>the</strong> Philippines for<br />
. The Philippines does not have any ambient PM2.5 st<strong>and</strong>ards. However, discussions are ongoing<br />
t <strong>of</strong> Environment <strong>and</strong> Natural Resources on <strong>the</strong> setting <strong>of</strong> National Ambient <strong>Air</strong> Quality<br />
A draft administrative order is pending approval.<br />
While air sampling was done at roadside, <strong>the</strong> air quality levels are compared with ambient ai air ai quality<br />
guidelines <strong>of</strong> <strong>the</strong> World <strong>Health</strong> Organization necessitating an explanation <strong>of</strong> how ambient air quality<br />
monitoring results are related with roadside air quality monitoring results.<br />
Ambient monitoring is an example <strong>of</strong> community-representative monitoring. ing. Monitoring sites are usually<br />
located beyond <strong>the</strong> zone <strong>of</strong> influence <strong>of</strong> a single source. . Pollutants from ambient air quality vary significantly<br />
25
<strong>Environmental</strong> <strong>and</strong> <strong>Health</strong> <strong>Benefits</strong> <strong>of</strong> <strong>the</strong> <strong>Cebu</strong> City BRT: Final Report<br />
from particulates, ozone, polycyclic aromatic hydrocarbons (PAHs), VOCs <strong>and</strong> carbonyls depending on <strong>the</strong><br />
sources <strong>of</strong> pollutants.<br />
Roadside monitoring refers to measurement <strong>of</strong> pollution in a source zone <strong>of</strong> influence site which is commonly<br />
placed right next to <strong>and</strong> downwind (<strong>of</strong> prevailing wind) a suspected emissions source, such as a major<br />
roadway. Major types <strong>of</strong> air pollutants in <strong>the</strong> roadside air quality are gaseous, particulate <strong>and</strong> VOCs which are<br />
primarily from motor vehicles. As <strong>the</strong> measurements are taken close to <strong>the</strong> sources, primary pollutants<br />
including CO <strong>and</strong> NOx are measured. Roadside monitoring stations are commonly installed within 2-5 meters<br />
from <strong>the</strong> road.<br />
Roadside air pollutant levels are an important indicator <strong>of</strong> <strong>the</strong> effectiveness or impact <strong>of</strong> transport-related<br />
measures on air quality while ambient monitoring is an approximation <strong>of</strong> <strong>the</strong> short-term <strong>and</strong> long-term<br />
exposures <strong>of</strong> large numbers <strong>of</strong> people where <strong>the</strong>y live, work, <strong>and</strong> play.<br />
The World <strong>Health</strong> Organization (WHO) has not established roadside air quality guidelines <strong>and</strong> very few<br />
countries have adopted any. The Philippines has no such st<strong>and</strong>ards. But in practice, air quality monitoring<br />
networks include measurements at both roadside <strong>and</strong> ambient air quality stations to quantify products from<br />
fossil fuel burning which contains regulated pollutants: particulate, NOx, NO2, SO2, CO, CO2 <strong>and</strong> O3 <strong>and</strong><br />
unregulated pollutants: Benzene, Toluene, Ethylbenzene, M/p-xylene <strong>and</strong> 0-xylene (BTEX), formaldehyde <strong>and</strong><br />
carbonyls which are toxic <strong>and</strong> carcinogenic.<br />
As <strong>the</strong> vehicle emissions are emitted <strong>and</strong> dispersed in <strong>the</strong> air (or atmosphere) which people brea<strong>the</strong>, roadside<br />
emission concentrations is compared to ambient air quality st<strong>and</strong>ards which are set to protect human health.<br />
This is especially useful if <strong>the</strong>re are a large number <strong>of</strong> people exposed at <strong>the</strong> traffic areas for long periods <strong>of</strong><br />
time.<br />
D. Volatile Organic Compounds (VOCs)<br />
Figures 21 <strong>and</strong> 22 show <strong>the</strong> measured concentrations <strong>of</strong> two toxic species <strong>of</strong> VOCs, i.e., benzene <strong>and</strong> 1,3butadiene<br />
at <strong>the</strong> two sampling sites. St<strong>and</strong>ards for individual VOCs (e.g., benzene) exist in Europe. European<br />
ambient air quality st<strong>and</strong>ards for benzene (5 μg/m 3 ) <strong>and</strong> 1,3-butadiene (2.4 μg/m 3 ) are adopted as references<br />
because <strong>the</strong> Philippines does not have guidelines for ambient levels <strong>of</strong> <strong>the</strong>se pollutants. The mean<br />
concentrations <strong>of</strong> benzene at Location A <strong>and</strong> Location B are 2.13 μg/m 3 <strong>and</strong> 7.96 μg/m 3 . The mean<br />
concentrations <strong>of</strong> 1, 3-butadiene are 10.35 μg/m 3 <strong>and</strong> 1.44 μg/m 3 at Location A <strong>and</strong> B, respectively. Benzene<br />
<strong>and</strong> 1,3-butadiene are carcinogenic. The exceedance <strong>of</strong> <strong>the</strong> relevant st<strong>and</strong>ards indicates health threatening<br />
situations in both sites.<br />
26
Figure 21. Benzene Levels <strong>of</strong>f Provincial<br />
Capitol (Location A)<br />
E. Carbon monoxide (CO) & Carbon dioxide ( (CO2)<br />
<strong>Environmental</strong> <strong>and</strong> <strong>Health</strong> <strong>Benefits</strong> <strong>of</strong> <strong>the</strong> <strong>Cebu</strong> City BRT: Final Report<br />
Figure 22. 1,3 Butadiene Levels <strong>of</strong>f Provincial<br />
Capitol (Location A) <strong>and</strong> South Bus Terminal<br />
(Location B)<br />
Carbon monoxide (CO) <strong>and</strong> carbon dioxide (CO (CO2) were measured in this study. CO2 is one <strong>of</strong> <strong>the</strong> important<br />
greenhouse gases <strong>and</strong> is produced by fuel combustion. Anthropogenic production by combustion <strong>of</strong> fossil<br />
fuel is <strong>the</strong> most important nt contributor <strong>of</strong> CO <strong>and</strong> CO CO2 in urban areas. CO can bind with hemoglobin in <strong>the</strong><br />
lungs <strong>and</strong> form carboxyhemoglobin (COHb) decreasing <strong>the</strong> oxygen-carrying carrying capacity <strong>of</strong> <strong>the</strong> blood, reducing<br />
oxygen needed by body tissues <strong>and</strong> causing hypoxia. A recent study in Guangzhou, gzhou, one <strong>of</strong> <strong>the</strong> Chinese mega- mega<br />
cities, showed that per 0.5 ppm increase in <strong>the</strong> average lag 11–2<br />
2 (previous two days) exposure to CO was<br />
associated with 3.04%, 3.62% <strong>and</strong> 3.72% increases in excessive risks <strong>of</strong> total, cardiovascular <strong>and</strong> respiratory<br />
mortality. CO is mostly produced by <strong>the</strong> incomplete combustion <strong>of</strong> fossil fuel <strong>and</strong> biomass burning. In urban<br />
areas, , industrial emissions <strong>and</strong> vehicular emissions are <strong>the</strong> main contributor contributors to CO.<br />
In this study, <strong>the</strong> project team measured extremely high levels <strong>of</strong> CO <strong>and</strong> CO CO2 during <strong>the</strong> sampling period in<br />
July 2012 (Figures 23 to 26). ). The elevated CO CO2 levels in <strong>the</strong> roadside environments as well as <strong>the</strong> high traffic<br />
flow recorded definitely show that CO CO2 was mainly emitted by vehicles. The range <strong>of</strong> CO varied from 8-30 8<br />
parts per million (ppm) <strong>and</strong> 6-13 13 ppm at <strong>the</strong> two roadside stations, locations ocations A <strong>and</strong> B, respectively. The<br />
results <strong>of</strong> <strong>the</strong> instantaneous continuous measurements <strong>of</strong> CO are shown in Figures 25 <strong>and</strong> 26. The measured<br />
CO levels exceed National Ambient <strong>Air</strong> Quality Guideline Va Values <strong>of</strong> Philippines ines (NAAQGV, 9 ppm 8-hr 8 average)<br />
during weekends <strong>and</strong> weekdays. Although <strong>the</strong> results were based on three (3) days monitoring, CO levels at<br />
both sites were higher than those measured in <strong>the</strong> roadside environment in many o<strong>the</strong>r Asian cities (Bei (Beijing, (Bei<br />
Hong Kong, Seoul, Bangkok etc., ranging from
<strong>Environmental</strong> <strong>and</strong> <strong>Health</strong> <strong>Benefits</strong> <strong>of</strong> <strong>the</strong> <strong>Cebu</strong> City BRT: Final Report<br />
<strong>Cebu</strong> should not be neglected <strong>and</strong> it also calls for a more in-depth study on this subject matter. One obvious<br />
reason for high CO levels is <strong>the</strong> wide use <strong>of</strong> inefficient vehicle engines, ei<strong>the</strong>r implying a lack in maintenance,<br />
use <strong>of</strong> outdated/obsolete engines, or vehicle overloading (i.e., overworked engines).<br />
Specific analysis has been conducted to determine <strong>the</strong> possible source <strong>of</strong> such high levels <strong>of</strong> CO. In this study,<br />
CO has evident correlations with CO2 in most cases at both sites (Figure 27).<br />
Location A: c(CO)= 0.0254 c(CO2) - 4.745, R² = 0.6426 (Weekend)<br />
c(CO) = 0.0229 c(CO2) - 5.5216, R² = 0.3666 (Weekday)<br />
Location B: c(CO) = 0.0437c(CO2) - 9.0247, R² = 0.5193 (Weekday)<br />
The correlations show <strong>the</strong> connection between CO <strong>and</strong> CO2, pointing to <strong>the</strong> contribution <strong>of</strong> vehicular<br />
emissions in <strong>the</strong> roadside environments. At Location A (<strong>of</strong>f <strong>the</strong> <strong>Cebu</strong> Capitol), we observed similar ratios <strong>of</strong><br />
ΔCO/ΔCO2, which were 0.0254 ppm/ppm <strong>and</strong> 0.0229 ppm/ppm. However, <strong>the</strong> ΔCO/ΔCO2 ratio at Location B<br />
(<strong>of</strong>f <strong>the</strong> South Bus Terminal) was 0.0437 ppm/ppm, higher than that at Location A. It suggests that <strong>the</strong><br />
emission <strong>of</strong> CO was higher at <strong>the</strong> roadside environment outside <strong>the</strong> bus terminal. In o<strong>the</strong>r words, many<br />
vehicles at this site have worse combustion efficiency. During <strong>the</strong> sampling period, <strong>the</strong> categories <strong>and</strong><br />
numbers <strong>of</strong> <strong>the</strong> vehicles were noted. This site had more buses <strong>and</strong> <strong>the</strong> traffic speed was lower. The higher CO<br />
emissions would be attributed to <strong>the</strong> difference <strong>of</strong> driving patterns at <strong>the</strong> two sites. More vehicles <strong>of</strong>f <strong>the</strong> bus<br />
terminal can easily cause worse traffic conditions which induce higher chance <strong>of</strong> incomplete fuel combustion.<br />
An effort to reduce traffic jam <strong>and</strong> to bring an unimpeded traffic flow would also be beneficial to <strong>the</strong> local air<br />
quality.<br />
28
CO 2 (ppm)<br />
1000<br />
900<br />
800<br />
700<br />
600<br />
500<br />
400<br />
300<br />
<strong>Environmental</strong> <strong>and</strong> <strong>Health</strong> <strong>Benefits</strong> <strong>of</strong> <strong>the</strong> <strong>Cebu</strong> City BRT: Final Report<br />
9:21:08<br />
9:41:08<br />
10:01:08<br />
10:21:08<br />
10:41:08<br />
11:01:08<br />
11:21:08<br />
11:41:08<br />
6:54:15<br />
7:14:15<br />
7:34:15<br />
7:54:15<br />
8:14:15<br />
8:34:15<br />
8:54:15<br />
9:14:15<br />
17:29:21<br />
17:39:21<br />
17:49:21<br />
17:59:21<br />
Morning, 1 st July 2012 Afternoon, 1 st July 2012<br />
Morning, 2 nd July 2012<br />
Afternoon, 2 nd July 2012<br />
17:21:46<br />
17:46:46<br />
18:11:46<br />
18:36:46<br />
19:01:46<br />
19:26:46<br />
19:51:46<br />
Figure 23. CO2 Concentrations <strong>of</strong>f <strong>Cebu</strong> Capitol (Location A) on 1-2 July 2012<br />
CO 2 (ppm)<br />
500<br />
450<br />
400<br />
350<br />
7:00:26<br />
7:25:26<br />
7:50:26<br />
8:15:26<br />
8:40:26<br />
9:05:26<br />
9:30:26<br />
Figure 24. CO2 concentration <strong>of</strong>f South Bus Terminal (Location B) on 3 July 2012<br />
CO 2<br />
1000<br />
900<br />
800<br />
700<br />
600<br />
500<br />
400<br />
300<br />
29
CO (ppm)<br />
30<br />
25<br />
20<br />
15<br />
10<br />
5<br />
Morning, 2 nd July, 2012<br />
<strong>Environmental</strong> <strong>and</strong> <strong>Health</strong> <strong>Benefits</strong> <strong>of</strong> <strong>the</strong> <strong>Cebu</strong> City BRT: Final Report<br />
9:21:08<br />
9:41:08<br />
10:01:08<br />
10:21:08<br />
10:41:08<br />
11:01:08<br />
11:21:08<br />
11:41:08<br />
Morning, 1 st July, 2012<br />
6:54:15<br />
7:14:15<br />
7:34:15<br />
7:54:15<br />
8:14:15<br />
8:34:15<br />
8:54:15<br />
9:14:15<br />
17:24:21<br />
17:29:21<br />
17:34:21<br />
17:39:21<br />
17:44:21<br />
17:49:21<br />
17:54:21<br />
17:59:21<br />
18:04:21<br />
Afternoon, 1 st July, 2012<br />
Afternoon, 2 nd July, 2012<br />
17:21:46<br />
17:46:46<br />
18:11:46<br />
18:36:46<br />
19:01:46<br />
19:26:46<br />
19:51:46<br />
Figure 25. CO concentration <strong>of</strong>f <strong>Cebu</strong> Capitol (Location A) during 1-2 July 2012<br />
CO (ppm)<br />
15.0<br />
12.5<br />
10.0<br />
7.5<br />
5.0<br />
7:00:26<br />
7:25:26<br />
7:50:26<br />
8:15:26<br />
8:40:26<br />
9:05:26<br />
9:30:26<br />
Figure 26. CO concentration <strong>of</strong>f South Bus Terminal (Location B) on 3 July 2012<br />
CO<br />
30<br />
25<br />
20<br />
15<br />
10<br />
5<br />
CO (ppm)<br />
30
CO (ppm)<br />
<strong>Environmental</strong> <strong>and</strong> <strong>Health</strong> <strong>Benefits</strong> <strong>of</strong> <strong>the</strong> <strong>Cebu</strong> City BRT: Final Report<br />
Figure 27. Relationship between CO2 <strong>and</strong> CO at both Locations A <strong>and</strong> B<br />
3.4 <strong>Air</strong> Quality Monitoring Action Plan<br />
30<br />
20<br />
10<br />
0<br />
Capitol July 1<br />
Capitol July 2 (am)<br />
Southbus Terminal<br />
400 500 600 700 800 900 1000<br />
CO 2 (ppm)<br />
To alleviate <strong>the</strong> current health threatening situation owing to heavy vehicular traffic, <strong>the</strong> proposed BRT<br />
system is expected to have health benefits from reduced traffic emissions. The reduction in air pollutant<br />
concentrations from <strong>the</strong> BRT system’s operation needs to be monitored <strong>and</strong> evaluated.<br />
<strong>Air</strong> quality monitoring done along <strong>the</strong> proposed BRT route serves as a good reference for future evaluation <strong>of</strong><br />
<strong>the</strong> air quality improvement resulting from <strong>the</strong> proposed BRT system. The field study <strong>and</strong> interviews with<br />
environment authorities revealed that <strong>the</strong>re is no existing air quality monitoring station close to <strong>the</strong><br />
proposed BRT route in <strong>Cebu</strong> that can serve this evaluation purpose.<br />
• <strong>Cebu</strong> has one fixed ambient air quality monitoring station located at <strong>the</strong> University <strong>of</strong> San Carlos<br />
(Talamban Campus), about 7 kilometers from <strong>the</strong> city’s downtown area. This automatic ambient air<br />
quality monitoring station, an OPSIS Telemetry System, was installed in 2003 <strong>and</strong> uses open-path<br />
technology which measures <strong>the</strong>se criteria pollutants: SO2, NO2, CO, O3, <strong>and</strong> PM10, <strong>and</strong> continuously<br />
reports average concentrations on an hourly basis. As <strong>of</strong> <strong>the</strong> interview with <strong>Environmental</strong><br />
Management Bureau - Region 7 (EMB-Region 7) last July 2012, this monitoring station needs repairs<br />
<strong>and</strong> was not operating in <strong>the</strong> first quarter <strong>of</strong> 2012.<br />
• Two manual stations for PM10 are being operated by EMB-Region 7 at Ayala <strong>Cebu</strong> Business Park <strong>and</strong><br />
Mabolo Police Station. The former is in a mixed commercial, institutional, <strong>and</strong> residential area while<br />
<strong>the</strong> latter is very close to <strong>the</strong> road leading to one <strong>of</strong> <strong>the</strong> huge commercial malls in <strong>the</strong> city.<br />
• Total suspended particle (TSP) levels are monitored by EMB-Region 7at two locations: EMB-Region 7<br />
premises <strong>and</strong> Naga City, a city in <strong>the</strong> sou<strong>the</strong>rn part <strong>of</strong> <strong>Cebu</strong> Province which is home to a power plant<br />
<strong>and</strong> several industries.<br />
31
<strong>Environmental</strong> <strong>and</strong> <strong>Health</strong> <strong>Benefits</strong> <strong>of</strong> <strong>the</strong> <strong>Cebu</strong> City BRT: Final Report<br />
• In some reports <strong>and</strong> presentations, <strong>the</strong>re is also mention <strong>of</strong> a manual station for PM10 in <strong>Cebu</strong> City<br />
(DENR National <strong>Air</strong> Quality Status Report, 2003-2004 & DENR, 2010).<br />
To this end, a new air quality monitoring system is recommended to be set up. Based on <strong>the</strong> information <strong>and</strong><br />
data collected during <strong>the</strong> city visit, <strong>the</strong> following air quality monitoring plan is proposed.<br />
A. <strong>Air</strong> Quality Monitoring Station Locations<br />
There should be at least two air quality monitoring stations, ideally situated at <strong>the</strong> same locations as this<br />
baseline study, i.e., at <strong>the</strong> Escario Road / Osmeña Boulevard junction <strong>of</strong>f <strong>the</strong> <strong>Cebu</strong> Capitol <strong>and</strong> at <strong>the</strong> straight<br />
road section outside <strong>the</strong> South Bus Terminal. These stations are along <strong>the</strong> proposed BRT route. Both<br />
vehicular <strong>and</strong> pedestrian traffic are typically heavy <strong>and</strong> <strong>the</strong>re are no o<strong>the</strong>r significant air pollution sources<br />
nearby. Both locations have spaces for installing ei<strong>the</strong>r fixed or stationary, or mobile air quality monitoring<br />
stations.<br />
B. Target <strong>Environmental</strong> Parameters <strong>and</strong> Pollutants<br />
CO, CO2, particulates <strong>and</strong> VOCs were monitored in this initial exercise. These are major air pollutants from<br />
vehicular exhausts. CO has acute impact while particulates <strong>and</strong> VOCs have longer term impacts on human<br />
health. CO can fur<strong>the</strong>r reveal <strong>the</strong> combustion efficiency <strong>of</strong> engines <strong>and</strong> thus serves as a quick health check on<br />
<strong>the</strong> vehicles. CO2 is a greenhouse gas. Apart from <strong>the</strong>se pollutants, NOx <strong>and</strong> SOx are common gaseous<br />
pollutants to be monitored as <strong>the</strong>y are very <strong>of</strong>ten regulatory air pollutants. These two pollutants would<br />
reflect <strong>the</strong> engine combustion efficiency as well as <strong>the</strong> fuel quality.<br />
It is imperative for <strong>the</strong> authorities to define clearly <strong>the</strong> purposes <strong>of</strong> <strong>the</strong> future air quality monitoring stations.<br />
If <strong>the</strong>se stations serve solely <strong>the</strong> purpose <strong>of</strong> assessing <strong>the</strong> environmental benefits <strong>of</strong> <strong>the</strong> proposed BRT<br />
system, <strong>the</strong> most critical air pollutants such as those monitored in this study would be sufficient. However, if<br />
<strong>the</strong>se stations would eventually serve as permanent roadside air quality monitoring stations, all regulatory air<br />
pollutants stated in <strong>the</strong> Philippine <strong>Clean</strong> <strong>Air</strong> Act (Republic Act 8749) should be monitored.<br />
In any case, <strong>the</strong> common environmental parameters including temperature, relative humidity, wind speed<br />
<strong>and</strong> direction should be monitored. These parameters help explain spikes <strong>and</strong> low pollution incidents.<br />
C. Equipment <strong>and</strong> Methodology<br />
a. CO2, Temperature <strong>and</strong> Relative Humidity (RH)<br />
Portable Q-Trak monitor (Model 8551, TSI Inc.) is commonly used to monitor <strong>the</strong> roadside CO2<br />
concentrations, temperature <strong>and</strong> relative humidity. The CO2 analyzer is able to detect CO2 based on <strong>the</strong><br />
mechanism <strong>of</strong> non-disperse infrared detection. This analyzer is equipped with a <strong>the</strong>rmistor <strong>and</strong> a thin film<br />
capacitive sensor for temperature <strong>and</strong> relative humidity measurements. Before sampling, <strong>the</strong> Q-Trak is<br />
32
<strong>Environmental</strong> <strong>and</strong> <strong>Health</strong> <strong>Benefits</strong> <strong>of</strong> <strong>the</strong> <strong>Cebu</strong> City BRT: Final Report<br />
calibrated with span CO2 gas at a known concentration. Pre- <strong>and</strong> post-zero checking <strong>of</strong> this air monitor needs<br />
to be carried out.<br />
b. PM2.5 <strong>and</strong> Carbon<br />
PM2.5 sampling can be conducted by a pre-fired (900 o C, 3 h) 47 mm Whatman QM-A quartz-fiber filters, using<br />
a minivolume air sampler (<strong>Air</strong>metrics, Eugene, OR, USA) at a flow rate <strong>of</strong> 5 L min -1 . The samplers are set upon<br />
desktops with about 1 meter above <strong>the</strong> ground. One field blank is collected at each site to subtract positive<br />
artifacts that result from passive adsorption <strong>of</strong> gas-phase organic compounds onto <strong>the</strong> filter during <strong>and</strong>/or<br />
after sampling. Meteorological data should be recorded. Quartz-fiber filters are analyzed gravimetrically for<br />
mass concentrations using a Sartorius MC5 electronic microbalance with ±1 μg sensitivity (Sartorius,<br />
Gottingen, Germany). These filters are weighed after 24-hour equilibration at temperature between 2 o C <strong>and</strong><br />
23 o C <strong>and</strong> relative humidity (RH) between 35% <strong>and</strong> 45% following <strong>the</strong> US <strong>Environmental</strong> Protection Agency<br />
(USEPA) methodology. Each filter is weighed at least three (3) times before <strong>and</strong> after sampling. The<br />
difference among <strong>the</strong> three (3) repeated weightings has to be less than 10 μg for a blank filter <strong>and</strong> less than<br />
20 μg for a sampled filter.<br />
For <strong>the</strong>rmal/optical carbon analysis, a 0.5 cm 2 punch from <strong>the</strong> filter is analyzed for eight (8) carbon fractions<br />
following <strong>the</strong> Interagency Monitoring <strong>of</strong> Protected Visual Environments (IMPROVE) <strong>the</strong>rmal/optical<br />
reflectance (TOR) protocol on a DRI model 2001 carbon analyzer (Atmoslytic Inc., Calabasas, CA). This<br />
produces four Organic Carbon (OC) fractions (OC1, OC2, OC3, <strong>and</strong> OC4 at 120°C, 250°C, 450°C, <strong>and</strong> 550°C,<br />
respectively, in a helium [He] atmosphere); Optical Pyrolysis (OP) is a pyrolyzed carbon fraction determined<br />
when reflected or transmitted laser light attained its original intensity after oxygen [O2] is added to <strong>the</strong><br />
analysis atmosphere; <strong>and</strong> three Elemental Carbon (EC) fractions (EC1, EC2, <strong>and</strong> EC3 at 550°C, 700°C, <strong>and</strong><br />
800°C, respectively, in a 2% O2/98% He atmosphere). IMPROVE_TOR OC is operationally defined as OC1 +<br />
OC2 + OC3 + OC4 + OP <strong>and</strong> EC is defined as EC1 + EC2 + EC3-OP.<br />
c. Instantaneous PM2.5<br />
A Dust-Trak air monitor (Model 8520, TSI Inc.) can be used to measure <strong>the</strong> instantaneous PM2.5<br />
concentrations. The Dust-Trak is an optical instrument that detects particles in <strong>the</strong> air matrix by optical<br />
scattering, using <strong>the</strong> optical diameter instead <strong>of</strong> <strong>the</strong> aerodynamic diameter. Therefore, a separate calibration<br />
has to be carried out to convert <strong>the</strong> Dust-Trak data into corresponding concentrations obtained by <strong>the</strong><br />
gravimetric method. The dust monitor measures PM10 at 1-min interval at a flow rate <strong>of</strong> 1.7 L/min. Pre- <strong>and</strong><br />
post-zero checks <strong>of</strong> <strong>the</strong> Dust-Trak monitor has to be carried out. Before each measurement, <strong>the</strong> Dust-Trak is<br />
re-zeroed.<br />
d. TVOCs<br />
A ppbRAE monitor (Model PGM 7240, RAE Systems, Sunnyvale, CA, USA) can be used to measure TVOC<br />
concentrations. The ppbRAE monitor is an advanced VOC gas monitor <strong>and</strong> its Photo-ionization Detector (PID)<br />
has a detection range from 1 ppb to 10,000 ppm. The ppbRAE TVOC monitor has to be calibrated using a<br />
calibration gas (isobutylene) with a known concentration <strong>of</strong> 10 ppm supplied by <strong>the</strong> manufacturer.<br />
33
e. VOCs species<br />
<strong>Environmental</strong> <strong>and</strong> <strong>Health</strong> <strong>Benefits</strong> <strong>of</strong> <strong>the</strong> <strong>Cebu</strong> City BRT: Final Report<br />
Sampling <strong>and</strong> analysis <strong>of</strong> VOCs are conducted in accordance with <strong>the</strong> USEPA Method TO-14. A batch <strong>of</strong> clean<br />
canisters for VOCs sample collection is evacuated before sampling. The SUMMA® canisters are cleaned for<br />
five times by sequential evacuating <strong>and</strong> pressurizing with humidified zero air. Background checks are<br />
performed on 25% <strong>of</strong> <strong>the</strong> cleaned evacuated canisters to clarify that <strong>the</strong> concentrations <strong>of</strong> all target<br />
compounds are less than 0.2 ppbv. Collected samples are analyzed using a combined cryogenic concentrator<br />
(NUTECH 3350A, USA) with gas chromatograph (HP 6891A) fitted with mass selective detector (MSD) (HP<br />
5973). 250 ml <strong>of</strong> sample is loaded <strong>and</strong> <strong>the</strong> target compounds are trapped in <strong>the</strong> cryogenic concentrator with<br />
liquid nitrogen. The analytes are desorbed rapidly from -190 o C to 150 o C. For GC/MS, a capillary column<br />
(Restek RTX-1 column, 60 m × 0.32 mm ID × 0.3 μm) is used with an initial oven temperature <strong>of</strong> -30 to 80 o C<br />
at a rate <strong>of</strong> 10 o C min -1 <strong>and</strong> <strong>the</strong>n is raised to 220 o C at a rate <strong>of</strong> 5 o C min -1 . Target VOCs are <strong>the</strong>n identified<br />
from <strong>the</strong> mass spectra <strong>and</strong> quantified by multipoint calibration. A total <strong>of</strong> 42 VOC species are identified by<br />
<strong>the</strong> GC/MSD (Gas Chromatography/ Mass Selective Detector) system. The calibration system used TO-14<br />
st<strong>and</strong>ard calibration gas (Toxi-Mat-14M Certified St<strong>and</strong>ard, Ma<strong>the</strong>son) at nominal concentrations <strong>of</strong> 1 ppmv<br />
in nitrogen to be diluted with nitrogen using Dynamic Dilution Calibrator-Model 700 (Advanced Pollution<br />
Instrumentation, Inc.). A multipoint dynamic calibration (three levels plus zero air) is performed.<br />
Table 5 lists <strong>the</strong> proposed equipment for future air quality monitoring in <strong>Cebu</strong> City. The costs <strong>of</strong> equipment<br />
(low, medium <strong>and</strong> high cost, respectively) are estimated. There are three purchasing options <strong>of</strong> set-up for<br />
each monitoring station, i.e., low, medium <strong>and</strong> high costs which amount to US$83,672, US$117,850, <strong>and</strong> US<br />
$294,869 respectively.<br />
Generated data quality is better with better equipment. For low cost equipment, it is acceptable for short<br />
term monitoring but not good for long-term ambient air quality study. For example, Dust-Trak air monitor<br />
(Model 8520, TSI Inc.) can be used to measure <strong>the</strong> instantaneous PM2.5 concentrations, but a separate<br />
calibration has to be carried out to convert <strong>the</strong> Dust-Trak data into corresponding concentrations obtained by<br />
<strong>the</strong> gravimetric method because Dust-Trak is an optical instrument that detects particles in <strong>the</strong> air matrix by<br />
optical scattering. Medium <strong>and</strong> high cost equipments are much more stable <strong>and</strong> can produce reliable data for<br />
long-term monitoring. Besides, regular maintenance <strong>and</strong> calibration are essential to ensure data quality <strong>and</strong><br />
method precision.<br />
For rental option, <strong>the</strong> annual rental fee for each category <strong>of</strong> equipment would be at least 30% <strong>of</strong> <strong>the</strong><br />
purchasing costs.<br />
Moreover, an average <strong>of</strong> 10% <strong>of</strong> <strong>the</strong> total purchasing costs should be reserved for equipment maintenance<br />
(calibration cost, replaceable accessories <strong>and</strong> equipment shipping fee) annually.<br />
34
Measured Parameters<br />
PM2.5 Filter-based Particle<br />
Mass<br />
PM2.5 online monitoring<br />
CO2<br />
CO<br />
SO2<br />
NO-NO2-NOx<br />
TVOCs<br />
<strong>Environmental</strong> <strong>and</strong> <strong>Health</strong> <strong>Benefits</strong> <strong>of</strong> <strong>the</strong> <strong>Cebu</strong> City BRT: Final Report<br />
Table 5. Proposed Monitoring Equipment <strong>and</strong> Estimated Costs<br />
Type Equipment Type Estimated<br />
Cost (in USD)<br />
Low Cost BGI from OMNI TM Ambient <strong>Air</strong> Sampler 5,468<br />
Medium Cost Mini-volume Sampler 6,410<br />
High Cost URG 3000A Sampler 64,102<br />
Low Cost Dust Trak 3,846<br />
Medium Cost MetONe E-BAM 16,025<br />
High Cost TEOM 64,102<br />
Low Cost Q-trak (Model 8551, TSI Inc. 3,846<br />
Medium Cost LI-COR CO2 Analyzer 5,673<br />
High Cost Thermo Scientific CO2 monitor 12,820<br />
Low Cost Q-trak (Model 8551, TSI Inc. 3,846<br />
Medium Cost 2B CO monitor 6,410<br />
High Cost Thermo Scientific CO 12,820<br />
Low Cost 2B SO2 Monitor 6,410<br />
Medium Cost ECTHCO SO2 Monitor 12,820<br />
High Cost Thermo Scientific SO2 monitor 25,641<br />
Low Cost 2B NOx Monitor 6,410<br />
Medium Cost ECTHCO SO2 Monitor 12,820<br />
High Cost API NOx monitor 25,641<br />
Low & Medium<br />
Cost<br />
ppbRAE monitor 7,692<br />
High Cost Thermo Scientific NMHC 38,461<br />
Low & Medium<br />
Cost<br />
Canister GC/MS Analysis 50,000<br />
35
<strong>Environmental</strong> <strong>and</strong> <strong>Health</strong> <strong>Benefits</strong> <strong>of</strong> <strong>the</strong> <strong>Cebu</strong> City BRT: Final Report<br />
Speciated VOCs High Cost Online-GC/FID Analysis 51,282<br />
Estimated Equipment<br />
Cost<br />
Purchase Cost Low cost equipment for each monitoring sites 87,518<br />
Equipment Rental<br />
Fee<br />
Medium cost equipment for each monitoring<br />
sites<br />
117,850<br />
High cost equipment for each monitoring sites 294,869<br />
Low cost equipment for each monitoring sites 25,101.60<br />
Medium cost equipment for each monitoring<br />
sites<br />
D. Establishment <strong>of</strong> Management Structure <strong>and</strong> Training <strong>of</strong> Staff<br />
35,355.00<br />
High cost equipment for each monitoring sites 88,460.70<br />
<strong>Air</strong> quality monitoring has to be performed by trained personnel comprising management <strong>and</strong> technical<br />
people. The minimum staffing should include one (1) manager, one (1) technical <strong>of</strong>ficer <strong>and</strong> one (1) field<br />
<strong>of</strong>ficer. The basic tasks for each staff member are:<br />
Manager<br />
• Responsible for <strong>the</strong> implementation <strong>and</strong> control <strong>of</strong> <strong>the</strong> data collection management system<br />
• Responsible for verifying data reports before release<br />
• Responsible for communication <strong>of</strong> results to <strong>the</strong> public<br />
• Monitors <strong>and</strong> advises on all aspects <strong>of</strong> quality in <strong>the</strong> station<br />
• Responsible for <strong>the</strong> technical operation <strong>of</strong> <strong>the</strong> quality assurance <strong>and</strong> oversees system audits,<br />
system review <strong>and</strong> data audits<br />
• Responsible for verifying that corrective actions arising from performance audit, system audit<br />
<strong>and</strong> system review are implemented <strong>and</strong> completed<br />
• Oversees <strong>the</strong> preparation <strong>and</strong> updating <strong>of</strong> <strong>the</strong> QA/QC Manual <strong>and</strong> manuals for quality assurance<br />
<strong>and</strong> audits<br />
• Ensures that all members <strong>of</strong> technical staff are properly trained<br />
• Reports to top management on <strong>the</strong> performance <strong>of</strong> <strong>the</strong> management system <strong>and</strong> any need for<br />
improvement<br />
Technical Officer<br />
• Responsible for <strong>the</strong> technical operations <strong>of</strong> field stations, technical operation <strong>of</strong> <strong>the</strong> data<br />
processing <strong>and</strong> maintenance laboratory in accordance with <strong>the</strong> management system <strong>and</strong> policy<br />
• Responsible for <strong>the</strong> preparation <strong>and</strong> updating <strong>of</strong> <strong>the</strong> data processing procedure <strong>and</strong> data<br />
validation manuals<br />
36
<strong>Environmental</strong> <strong>and</strong> <strong>Health</strong> <strong>Benefits</strong> <strong>of</strong> <strong>the</strong> <strong>Cebu</strong> City BRT: Final Report<br />
• Reviews <strong>and</strong> evaluates feedback on <strong>the</strong> operations <strong>of</strong> field stations, data processing <strong>and</strong><br />
maintenance laboratory <strong>and</strong> initiates corrective actions as required<br />
• Oversees <strong>the</strong> preparation <strong>and</strong> updating <strong>of</strong> quality control <strong>and</strong> associated technical manuals<br />
• Ensures that all quality control procedures are followed, including use <strong>of</strong> st<strong>and</strong>ards, calibration,<br />
precision checks, <strong>and</strong> proper equipment maintenance <strong>and</strong> servicing<br />
• Oversees <strong>the</strong> preparation <strong>and</strong> updating <strong>of</strong> site reports for fixed monitoring stations<br />
Field Officer<br />
• Responsible for <strong>the</strong> operation <strong>of</strong> monitoring stations, following <strong>the</strong> procedures <strong>of</strong> air quality<br />
monitoring field operation<br />
• Responsible for <strong>the</strong> acquisition <strong>and</strong> acceptance <strong>of</strong> field operation equipment <strong>and</strong> consumables<br />
• Implements all quality control procedures including use <strong>of</strong> st<strong>and</strong>ards, calibration, precision<br />
checks, <strong>and</strong> proper field maintenance <strong>and</strong> servicing<br />
• Responsible for <strong>the</strong> validation <strong>of</strong> measured air quality data<br />
• Investigates abnormal measured air quality data<br />
• Compiles <strong>and</strong> updates <strong>the</strong> relevant annexes <strong>of</strong> QA/QC manual on equipment operating<br />
procedures<br />
• Provides support to conduct siting review for <strong>the</strong> monitoring stations<br />
• Provides feedback <strong>and</strong> technical evaluation on field operation <strong>and</strong> proposes corrective action<br />
• Trains technical staff (if available) on field operation<br />
Setting up <strong>of</strong> <strong>the</strong> air quality monitoring system also requires (a) formulation <strong>of</strong> codes <strong>of</strong> practices, equipment<br />
operation manual, data processing manual as well as quality assurance/quality control (QA/QC) procedures<br />
<strong>and</strong> (b) staff training through short courses.<br />
The <strong>Cebu</strong> City Environment <strong>and</strong> Natural Resources Office (CCENRO) is to be consolidated with its o<strong>the</strong>r<br />
environment-related <strong>of</strong>fices such as <strong>the</strong> <strong>Clean</strong> <strong>Air</strong> Law Enforcement Office, <strong>the</strong> Mines <strong>and</strong> Quarries Section <strong>of</strong><br />
<strong>the</strong> City Planning <strong>and</strong> Development Office, <strong>the</strong> Coastline Management Board, Solid Waste Management<br />
Board, Bantay Dagat Commission, <strong>Cebu</strong> City Rivers Management Council <strong>and</strong> City Mining Regulatory Board,<br />
<strong>and</strong> <strong>the</strong> City <strong>Environmental</strong> Sanitation Enforcement Team. The <strong>Cebu</strong> City Mayor Michael Rama signed an<br />
executive order on 16 February 2011 to this effect <strong>and</strong> to arm <strong>the</strong> consolidated CCENRO with a budget <strong>of</strong> P7<br />
million. As <strong>of</strong> September 2012, such consolidation has yet to be implemented; <strong>the</strong> CCENRO only had one staff<br />
member.<br />
There are at least two universities in <strong>Cebu</strong> City with one or two faculty members who have experience in air<br />
quality monitoring <strong>and</strong> air quality modelling <strong>and</strong> who were involved in previous air quality research in <strong>the</strong><br />
city. These are <strong>the</strong> University <strong>of</strong> <strong>the</strong> Philippines <strong>Cebu</strong> <strong>and</strong> <strong>the</strong> University <strong>of</strong> San Carlos. These universities<br />
could support <strong>the</strong> <strong>Cebu</strong> City Government in conducting air quality research. They could be engaged to<br />
perform <strong>the</strong> air quality monitoring function while <strong>the</strong> <strong>Cebu</strong> City Government has yet to form its air quality<br />
monitoring team.<br />
The <strong>Environmental</strong> Management Bureau Region 7 <strong>of</strong> <strong>the</strong> DENR also has staff <strong>of</strong> five persons involved in air<br />
quality management. Most <strong>of</strong> <strong>the</strong> EMB-7 staff, however, hold multiple responsibilities <strong>and</strong> are not dedicated<br />
37
<strong>Environmental</strong> <strong>and</strong> <strong>Health</strong> <strong>Benefits</strong> <strong>of</strong> <strong>the</strong> <strong>Cebu</strong> City BRT: Final Report<br />
to air quality management. EMB-7 mobilizes <strong>the</strong> airshed governing board, an inter-agency <strong>and</strong> multi-sectoral<br />
board created under <strong>the</strong> Philippine <strong>Clean</strong> <strong>Air</strong> Act. The airshed governing board has been quite active in antismoke<br />
belching operations <strong>and</strong> this year, it included as a priority a focus on <strong>the</strong> health impacts <strong>of</strong> air<br />
pollution. The City should continue to be actively involved in <strong>the</strong> airshed governing board as it will need <strong>the</strong><br />
cooperation <strong>of</strong> <strong>the</strong> regional <strong>of</strong>fices <strong>of</strong> national government agencies <strong>and</strong> o<strong>the</strong>r stakeholders who are<br />
members <strong>of</strong> <strong>the</strong> board to manage its air quality – <strong>the</strong> EMB-7, LTFRB-7, LTO-7, academe <strong>and</strong> non-government<br />
organizations.<br />
In summary, it is recommended that:<br />
• The city sets up at least two air quality monitoring stations along <strong>the</strong> BRT corridor to monitor air<br />
quality levels along <strong>the</strong> corridor; <strong>the</strong> cost <strong>of</strong> which could be integrated as part <strong>of</strong> <strong>the</strong> investments for<br />
<strong>the</strong> BRT system.<br />
• If <strong>the</strong>se stations serve solely <strong>the</strong> purpose <strong>of</strong> assessing <strong>the</strong> environmental benefits <strong>of</strong> <strong>the</strong><br />
proposed BRT system, <strong>the</strong> most critical air pollutants such as those monitored in this study<br />
would be sufficient (PM2.5, CO, CO2, <strong>and</strong> VOCs). However, if <strong>the</strong>se stations would eventually<br />
serve as permanent roadside air quality monitoring stations, all regulatory air pollutants stated<br />
in <strong>the</strong> Philippine <strong>Clean</strong> <strong>Air</strong> Act (Republic Act 8749) should be monitored. In any case, <strong>the</strong><br />
common environmental parameters including temperature, relative humidity, wind speed <strong>and</strong><br />
direction should be monitored. These parameters help explain spikes <strong>and</strong> low pollution<br />
incidents.<br />
• An air quality monitoring team <strong>of</strong> at least three staff (Manager, Technical Officer, <strong>and</strong> Field Officer)<br />
be created as part <strong>of</strong> <strong>the</strong> consolidated CCENRO.<br />
• The city enters into a memor<strong>and</strong>um <strong>of</strong> agreement or underst<strong>and</strong>ing with academic institutions such<br />
as <strong>the</strong> University <strong>of</strong> <strong>the</strong> Philippines <strong>Cebu</strong> <strong>and</strong> <strong>the</strong> University <strong>of</strong> San Carlos to conduct joint air quality<br />
monitoring research.<br />
• The city continues to actively engage <strong>the</strong> airshed governing board in integrated air quality<br />
management in <strong>the</strong> region.<br />
38
4. EMISSIONS REDUCTION FROM CEBU BRT<br />
4.1 TEEMP Description<br />
<strong>Environmental</strong> <strong>and</strong> <strong>Health</strong> <strong>Benefits</strong> <strong>of</strong> <strong>the</strong> <strong>Cebu</strong> City BRT: Final Report<br />
Estimating emissions from transport is an important element in analyzing current <strong>and</strong> future transport<br />
scenarios in cities. Currently, cities embark on investing in transport infrastructure without adequately<br />
estimating <strong>the</strong> repercussions on <strong>the</strong> environment <strong>and</strong> climate. Traditional tools <strong>and</strong> methodologies for<br />
evaluating <strong>the</strong> emissions impacts <strong>of</strong> such projects require a lot <strong>of</strong> time, data <strong>and</strong> huge financial resources.<br />
Methodologies <strong>and</strong> tools that enable <strong>the</strong> rapid yet sound assessment <strong>of</strong> emission impacts <strong>of</strong> transport<br />
projects, such as simple excel-based models, using readily available data, are needed.<br />
In 2010, <strong>the</strong> CAI-Asia Center, toge<strong>the</strong>r with Institute for Transportation <strong>and</strong> Development Policy (ITDP), Asian<br />
Development Bank (ADB), Cambridge Systematics <strong>and</strong> <strong>the</strong> United Nations Environment Programme (UNEP) –<br />
Global Environment Facility (GEF) Scientific <strong>and</strong> Technical Advisory Panel, developed <strong>the</strong> excel-based, free-<strong>of</strong>charge<br />
spreadsheet models collectively called as “Transport Emissions Evaluation Models for Projects”<br />
(TEEMP). The TEEMP tools were initially developed for evaluating <strong>the</strong> emissions impacts <strong>of</strong> ADB's transport<br />
project <strong>and</strong> have been modified <strong>and</strong> extended for GEF projects. 21 In <strong>the</strong> current form, it can be easily applied<br />
for evaluating <strong>the</strong> ex-ante impacts <strong>of</strong> various transport measures at project level. To date, TEEMP has been<br />
used in more than twenty (20) cities to evaluate <strong>the</strong> impact <strong>of</strong> various types <strong>of</strong> transport projects including<br />
BRT.<br />
Data used for <strong>the</strong> TEEMP application to <strong>the</strong> planned <strong>Cebu</strong> City BRT System were as follows:<br />
• Project duration – Project analysis is carried out for 20 years. For <strong>the</strong> analysis, <strong>the</strong> starting year is<br />
assumed as 2015 <strong>and</strong> horizon year as 2034.<br />
• Ridership Projections – On <strong>the</strong> start <strong>of</strong> project BRT ridership, <strong>the</strong> BRTS Report “Study <strong>and</strong> Concept<br />
Plan for a Demonstration Bus Rapid Transit Corridor (2010)” suggests two dem<strong>and</strong> forecasts − one a<br />
high case, which showed daily patronage <strong>of</strong> 352,266, <strong>and</strong>, a low case <strong>of</strong> 220,934. The two cases vary<br />
according to attraction <strong>of</strong> riders from existing jeepneys based on implementation <strong>of</strong> regulations to<br />
accommodate <strong>the</strong> BRT. Based on experience from different public transport projects around <strong>the</strong><br />
world, <strong>the</strong> ridership projections are always very optimistic <strong>and</strong> actual ridership is much lesser than<br />
<strong>the</strong> projections. The project team considered <strong>the</strong> ridership projections for “high” <strong>and</strong> “low” scenarios<br />
<strong>and</strong> developed <strong>the</strong> emission analysis for <strong>the</strong>se scenarios. However, <strong>the</strong> Draft Final Report for<br />
Feasibility Study for BRTS corridor or <strong>the</strong> <strong>Cebu</strong> BRT Feasibility Report (ITP, 2012) suggests a single<br />
scenario with BRT ridership <strong>of</strong> 330,000, thus, along with “low” <strong>and</strong> “high” scenario – a new scenario<br />
called “feasible” scenario was developed.<br />
The Feasibility Report (ITP, 2012) <strong>and</strong> <strong>the</strong> Study <strong>and</strong> Concept Plan for a Demonstration Bus Rapid<br />
Transit Corridor (ITP, 2010) suggest an annual growth rate <strong>of</strong> 4.3% <strong>and</strong> <strong>the</strong> same has been assumed<br />
for ridership projections.<br />
21 See http://www.<strong>the</strong>gef.org/gef/node/4638<br />
39
Thous<strong>and</strong>s<br />
900.00<br />
800.00<br />
700.00<br />
600.00<br />
500.00<br />
400.00<br />
300.00<br />
200.00<br />
100.00<br />
0.00<br />
2015<br />
2016<br />
2017<br />
2018<br />
2019<br />
2020<br />
<strong>Environmental</strong> <strong>and</strong> <strong>Health</strong> <strong>Benefits</strong> <strong>of</strong> <strong>the</strong> <strong>Cebu</strong> City BRT: Final Report<br />
Ridership Projections<br />
2021<br />
2022<br />
2023<br />
2024<br />
Figure 28. Ridership Projections<br />
• Existing Trip Mode Share – Jeepneys currently carry <strong>the</strong> major traffic load with 65% <strong>of</strong> passenger<br />
trips. Two wheelers account for 17% <strong>and</strong> <strong>the</strong> remaining share is contributed by cars at 13% <strong>and</strong> taxis<br />
at 5%. It is interesting to note that: (a) Cars carry just 13% <strong>of</strong> trips despite accounting for about 30%<br />
<strong>of</strong> <strong>the</strong> vehicles on <strong>the</strong> corridor; <strong>and</strong> (b) In <strong>the</strong> absence <strong>of</strong> formal public transport modes, para-transit<br />
modes such as jeepneys account for 65% <strong>of</strong> trips while accounting for only 22% <strong>of</strong> <strong>the</strong> vehicles on <strong>the</strong><br />
corridor.<br />
With BRT being introduced in <strong>the</strong> city, <strong>the</strong>re would be substantial mode shift to BRT from existing<br />
transport modes based on many factors. The report on “Study <strong>and</strong> Concept Plan for a Demonstration<br />
Bus Rapid Transit Corridor” (ITP, 2010) suggests that motorization would increase in <strong>the</strong> absence <strong>of</strong><br />
public transport improvement; car usage would increase by 45.5% between 2010 to 2020. The<br />
proposed trip growth rate from 2010 to 2020 is 50% for private trips <strong>and</strong> 26% for public trips.<br />
The mode shift to BRT from o<strong>the</strong>r modes as projected by <strong>the</strong> report on “Study <strong>and</strong> Concept Plan<br />
for a Demonstration Bus Rapid Transit Corridor” (ITP, 2010) is shown below.<br />
2025<br />
2026<br />
Low Scenario High Scenario<br />
2027<br />
2028<br />
2029<br />
2030<br />
2031<br />
2032<br />
2033<br />
2034<br />
40
<strong>Environmental</strong> <strong>and</strong> <strong>Health</strong> <strong>Benefits</strong> <strong>of</strong> <strong>the</strong> <strong>Cebu</strong> City BRT: Final Report<br />
Table 6. Mode Shift to BRT from o<strong>the</strong>r Modes<br />
Low Case High Case<br />
Car 5%<br />
Taxi 30%<br />
Jeepney 60% 90%<br />
2 Wheeler 10%<br />
Source: ITP, 2010. Study <strong>and</strong> Concept Plan for a Demonstration Bus Rapid Transit Corridor for <strong>Cebu</strong> City<br />
Considering <strong>the</strong> experience from o<strong>the</strong>r cities, <strong>the</strong> current mode share in <strong>Cebu</strong> City, future<br />
motorization growth rates, <strong>the</strong> modes shift to BRT for “high,” “low” <strong>and</strong> “feasible” scenarios are<br />
considered as shown below.<br />
Table 7. Assumed Mode Shift (%) to BRT<br />
2015 2024 2034<br />
Car 14 16 19<br />
2-wheeler 18 21 25<br />
Taxi 5 4 4<br />
Jeepney 63 58 53<br />
The above mode shift considered motorization growth rates <strong>of</strong> 5% private <strong>and</strong> 2.6% public, <strong>and</strong><br />
forecasting mode shares over <strong>the</strong> 20-year project lifecycle. The main difference between <strong>the</strong>se<br />
assumptions <strong>and</strong> <strong>the</strong> values given in <strong>the</strong> report on “Study <strong>and</strong> Concept Plan for a Demonstration Bus<br />
Rapid Transit Corridor” (ITP, 2010) is <strong>the</strong> relatively higher shift to BRT from Cars when compared to<br />
Taxis. Taxis are mainly used for non-work commuting (i.e. social <strong>and</strong> shopping), <strong>and</strong> thus it is more<br />
logical to assume shift from trips for commuting for work than for shopping. The <strong>Cebu</strong> BRT Feasibility<br />
Report (ITP, 2012) suggests a shift <strong>of</strong> 95% from jeepney to BRT. Such a high shift from existing public<br />
transport mode to BRT is difficult considering experience in existing BRT systems <strong>and</strong> hence not<br />
considered in <strong>the</strong> analysis.<br />
• Existing trip length – Considering that <strong>the</strong> BRT route is 16 km, <strong>the</strong> trip length <strong>of</strong> BRT passengers is<br />
assumed as 6 km <strong>and</strong> <strong>the</strong> BRT impact by mode shift is calculated using 6 km average trip length. 22<br />
• Speed (kilometer/hour)–In <strong>the</strong> previous report on “Study <strong>and</strong> Concept Plan for a Demonstration Bus<br />
Rapid Transit Corridor” (ITP, 2010) cites that:<br />
“In <strong>the</strong> travel speeds <strong>of</strong> selected corridors in <strong>Cebu</strong> City by time <strong>of</strong> day were surveyed by CITOM in<br />
2005. The travel speeds <strong>of</strong> Osmeña Boulevard towards <strong>the</strong> coastal area ranged from 7 kph to 17 kph<br />
while <strong>the</strong> travel speed <strong>of</strong> Juan Luna St. ranged from 4 kph to 18 kph. From <strong>the</strong> coastal area, <strong>the</strong> travel<br />
speeds <strong>of</strong> Osmeña Boulevard had a similar range from 6 to 17 kph while <strong>the</strong> same was true for Juan<br />
Luna with a range <strong>of</strong> 4 to 21 kph.”<br />
22 Different modes have different trip lengths. When a shift from different modes to BRT occurs, <strong>the</strong>re are additional trips<br />
generated due to transfer to stations. Such trips are neglected.<br />
41
<strong>Environmental</strong> <strong>and</strong> <strong>Health</strong> <strong>Benefits</strong> <strong>of</strong> <strong>the</strong> <strong>Cebu</strong> City BRT: Final Report<br />
The speeds provided are journey speeds which account for stoppages <strong>and</strong> considering <strong>the</strong> speeds at<br />
peak hour, an average speed <strong>of</strong> 18 kph over <strong>the</strong> project life has been utilized for study computations.<br />
The BRT average speed has been considered as 25 kph based on <strong>the</strong> study. The TEEMP models use<br />
<strong>the</strong> average speeds <strong>and</strong> factor <strong>the</strong> emission factors proposed for 50 kph <strong>and</strong> replicate <strong>the</strong> impact at<br />
project speeds.<br />
4.2 Fuel Type, Emission St<strong>and</strong>ards <strong>and</strong> Emission Factors (PM & NOx)<br />
In order to capture <strong>the</strong> impact <strong>of</strong> <strong>the</strong> proposed BRT on emissions, <strong>the</strong> current vehicle emission <strong>and</strong> fuel<br />
quality st<strong>and</strong>ards roadmap needs to be considered for a more representative estimate <strong>of</strong> <strong>the</strong> future. Data on<br />
vehicle technology penetration <strong>and</strong> fuel split are also needed to gauge fleet renewal. In absence <strong>of</strong> such data,<br />
<strong>the</strong> impact <strong>of</strong> BRT on emissions (PM, NOx) would be very high. However, it is to be noted that <strong>the</strong> Philippines<br />
has developed a roadmap for vehicle emission st<strong>and</strong>ards improvement by m<strong>and</strong>ating <strong>the</strong> move to Euro 4<br />
vehicle emission st<strong>and</strong>ards <strong>and</strong> equivalent fuel quality (50ppm sulfur in gasoline <strong>and</strong> diesel) by 2016; it is<br />
expected that vehicles would emit less when compared to what <strong>the</strong>y emit now.<br />
Under <strong>the</strong> National <strong>Environmental</strong>ly Sustainable Transport (EST) framework, o<strong>the</strong>r tail-pipe policies like<br />
inspection <strong>and</strong> maintenance would improve over time <strong>and</strong> thus <strong>the</strong> emissions pr<strong>of</strong>ile from vehicles <strong>and</strong> fuel<br />
quality would improve irrespective <strong>of</strong> <strong>the</strong> BRT implementation. In order to capture this impact, <strong>the</strong> fuel split<br />
<strong>and</strong> emission st<strong>and</strong>ards distribution <strong>of</strong> vehicles are considered based on vehicle parc data obtained from a<br />
previous study by CAI-Asia <strong>and</strong> ADB titled “Transport <strong>and</strong> Carbon Dioxide Emissions: Forecasts, Options<br />
Analysis, <strong>and</strong> Evaluation” (2009). 23 Under <strong>the</strong> CAI-Asia <strong>and</strong> ADB study, vehicle market research company<br />
Segment Y, Ltd 24 projected fleet renewal <strong>and</strong> projections for “vehicles on road” for many countries including<br />
<strong>the</strong> Philippines. Tables 8 <strong>and</strong> 9 provide <strong>the</strong> vehicle fuel mix <strong>and</strong> <strong>the</strong> vehicle technology st<strong>and</strong>ards mix<br />
assumptions. The 2015 mix are assumed as <strong>the</strong> same as <strong>of</strong> <strong>the</strong> present time.<br />
Private<br />
Public<br />
Table 8. Vehicle Fuel Mix Assumptions<br />
2015 2024 2034<br />
Petrol Diesel LPG Petrol Diesel LPG Petrol Diesel LPG<br />
Car 86% 14% 72% 28% 58% 32%<br />
2-wheeler 100% 100% 100%<br />
Taxi 10% 90% 10% 90% 10% 90%<br />
3-wheeler 100% 100% 100%<br />
Bus 100% 100% 100%<br />
Jeepney 65% 35% 41% 59% 23% 77%<br />
BRT 100% 100% 100%<br />
23 http://cleanairinitiative.org/portal/node/6775<br />
24 http://www.segmenty.com/<br />
42
Private<br />
Public<br />
<strong>Environmental</strong> <strong>and</strong> <strong>Health</strong> <strong>Benefits</strong> <strong>of</strong> <strong>the</strong> <strong>Cebu</strong> City BRT: Final Report<br />
Table 9. Vehicle Technology Emissions St<strong>and</strong>ards Split Assumptions<br />
Vehicle Type<br />
Pre-Euro<br />
Euro I<br />
Technology Split (%)<br />
2015 2024 2034<br />
Euro II<br />
Euro IV<br />
Pre-Euro<br />
Car 25% 17% 11% 47% 5% 95% 100%<br />
2-wheeler 100% 100% 100%<br />
Taxi 25% 17% 11% 47% 5% 95% 100%<br />
3-wheeler 1% 99% 100% 100%<br />
Bus 53% 5% 42% 8% 1% 91% 100%<br />
Jeepney 43% 13% 10% 34% 4% 2% 3% 91% 100%<br />
BRT 100% 100% 100%<br />
It is interesting to note that <strong>the</strong> latest communication from <strong>the</strong> BRT authorities suggest that Euro IV BRT<br />
buses would be used from 2015 onwards <strong>and</strong> hence in <strong>the</strong> “feasible scenario” all “Euro IV” BRT buses have<br />
been considered.<br />
Currently, <strong>the</strong> Philippines does not have local vehicle emission factors. Researchers use emission factors<br />
based on sample dynamometer studies, external literature <strong>and</strong> expert judgment. In this project, emission<br />
factors for PM <strong>and</strong> NOx emissions are considered based on a review <strong>of</strong> literature <strong>and</strong> Global Environment<br />
Facility (GEF) default values generated by CAI-Asia <strong>and</strong> ITDP. The studies considered for generating emission<br />
factors are:<br />
a. GEF, 2011. Manual for Calculating Greenhouse Gas <strong>Benefits</strong> <strong>of</strong> Global <strong>Environmental</strong> Facility<br />
Transportation Projects (GEF-STAP)<br />
b. ADB, 2009. Transport <strong>and</strong> Carbon Dioxide Emissions: Forecasts, Options Analysis, <strong>and</strong> Evaluation<br />
(ADB)<br />
c. Biona, et.al, 2007. Energy use <strong>and</strong> emissions <strong>of</strong> two stroke-powered tricycles in Metro Manila<br />
d. Biona, et.al, 2008. Fuel cycle analysis based evaluation <strong>of</strong> <strong>the</strong> fuel <strong>and</strong> emissions reduction potential<br />
<strong>of</strong> adapting <strong>the</strong> hybrid technology to tricycles<br />
e. International Energy Agency (IEA) Sustainable Mobility Project (SMP) Model<br />
f. Traffic <strong>and</strong> Transport Planners (TTPI), 2010. A strategic approach to climate change in <strong>the</strong> Philippines:<br />
an assessment <strong>of</strong> low-carbon interventions in <strong>the</strong> transport <strong>and</strong> power sectors – final report. April<br />
2010<br />
g. CAI-Asia <strong>and</strong> ITPS, 2010. International Study <strong>of</strong> Transport Systems in a Low Carbon Society: Sou<strong>the</strong>ast<br />
Asian Region<br />
h. Automotive Research Association <strong>of</strong> India (ARAI) - Emission Factor Development for Indian Vehicles<br />
i. Developing Integrated Emissions Strategies for Existing L<strong>and</strong> (DIESEL) Project Bangkok, Thail<strong>and</strong>.<br />
Euro I<br />
Euro II<br />
Euro IV<br />
Pre-Euro<br />
Euro I<br />
Euro II<br />
43<br />
Euro IV
Private<br />
Public<br />
Private<br />
Public<br />
Private<br />
The table below summarizes <strong>the</strong> emission factors assumed in this project<br />
Pre-Euro<br />
Euro I<br />
<strong>Environmental</strong> <strong>and</strong> <strong>Health</strong> <strong>Benefits</strong> <strong>of</strong> <strong>the</strong> <strong>Cebu</strong> City BRT: Final Report<br />
Table 10. Emissions factors used in <strong>the</strong> project<br />
PM Emission Factor (g/vkm) – Gasoline<br />
2015 2024 2034<br />
Euro II<br />
Euro IV<br />
Average<br />
Pre-Euro<br />
Euro I<br />
Car 0.01 0.01 0.01<br />
2wheeler<br />
0.06 0.02 0.02 0.06 0.02 0.02 0.06 0.02 0.02<br />
Taxi<br />
3-<br />
0.01 0.01 0.01<br />
wheeler 0.05 0.02 0.02 0.05 0.02 0.02 0.05 0.02<br />
Bus 0.01 0.01 0.01<br />
Jeepney 0.01 0.01 0.01<br />
BRT 0.01 0.01 0.01<br />
Pre-Euro<br />
Euro I<br />
Euro II<br />
Euro IV<br />
Average<br />
PM Emission Factor (g/vkm) – Diesel<br />
2015 2024 2034<br />
Euro II<br />
Euro IV<br />
Average<br />
Pre-Euro<br />
Euro I<br />
Car 0.15 0.06 0.02 0.05 0.07 0.15 0.06 0.02 0.05 0.05 0.15 0.06 0.02 0.05 0.05<br />
2wheeler<br />
0.06 0.02 0.02 0.06 0.02 0.02 0.06 0.02 0.02<br />
Taxi<br />
3-<br />
0.15 0.06 0.02 0.05 0.07 0.15 0.06 0.02 0.05 0.05 0.15 0.06 0.02 0.05 0.05<br />
wheeler 0.05 0.02 0.02 0.05 0.02 0.02 0.05 0.02 0<br />
Bus 2.01 0.61 0.15 0.05 1.12 2.01 0.61 0.15 0.05 0.21 2.01 0.61 0.15 0.05 0.05<br />
Jeepney 0.66 0.48 0.1 0.05 0.37 0.66 0.48 0.1 0.05 0.08 0.66 0.48 0.1 0.05 0.05<br />
BRT 2.01 0.61 0.15 0.05 0.15 2.01 0.61 0.15 0.05 0.05 2.01 0.61 0.15 0.05 0.05<br />
Pre-Euro<br />
Euro I<br />
Euro II<br />
Euro IV<br />
Average<br />
NOx Emission Factor (g/vkm) – Gasoline<br />
2015 2024 2034<br />
Euro II<br />
Euro IV<br />
Average<br />
Pre-Euro<br />
Euro I<br />
Car 0.95 0.2 0.12 0.05 0.31 0.95 0.2 0.12 0.05 0.05 0.95 0.2 0.12 0.05 0.05<br />
2wheeler<br />
0.05 0.54 0.54 0.05 0.54 0.54 0.05 0.54 0.54<br />
Euro II<br />
Euro IV<br />
Average<br />
Pre-Euro<br />
Pre-Euro<br />
Pre-Euro<br />
Euro I<br />
Euro I<br />
Euro I<br />
Euro II<br />
Euro II<br />
Euro II<br />
Euro IV<br />
Euro IV<br />
Euro IV<br />
Average<br />
Average<br />
Average<br />
44
Public<br />
Private<br />
Public<br />
<strong>Environmental</strong> <strong>and</strong> <strong>Health</strong> <strong>Benefits</strong> <strong>of</strong> <strong>the</strong> <strong>Cebu</strong> City BRT: Final Report<br />
Taxi<br />
3-<br />
0.95 0.2 0.12 0.09 0.33 0.95 0.2 0.12 0.09 0.09 0.95 0.2 0.12 0.09 0.09<br />
wheeler 0.2 0.53 0.53 0.2 0.53 0.53 0.2 0.53 0<br />
Bus<br />
Jeepney 0.95 0.2 0.09 0.03 0.45 0.95 0.2 0.09 0.03 0.07 0.95 0.2 0.09 0.03 0.03<br />
BRT<br />
NOx Emission Factor (g/vkm) – Diesel<br />
2015 2024 2034<br />
Pre-Euro<br />
Euro I<br />
Euro II<br />
Euro IV<br />
Average<br />
Pre-Euro<br />
Euro I<br />
Car 0.45 0.49 0.28 0.1 0.27 0.45 0.49 0.28 0.1 0.11 0.45 0.49 0.28 0.1 0.1<br />
2wheeler<br />
Taxi<br />
3wheeler<br />
0.45 0.49 0.28 0.1 0.27 0.45 0.49 0.28 0.1 0.11 0.45 0.49 0.28 0.1 0.1<br />
Bus 6.24 6.66 6.24 3.9 5.28 6.24 6.66 6.24 3.9 4.11 6.24 6.66 6.24 3.9 3.9<br />
Jeepney 1.71 1.6 0.82 0.8 1.3 1.71 1.6 0.82 0.8 0.85 1.71 1.6 0.82 0.8 0.8<br />
BRT 6.24 3.9 6.24 6.24 3.9 3.9 6.24 3.9 3.9<br />
• Occupancy <strong>of</strong> Vehicles – Vehicle occupancy for different modes has been assumed based on<br />
literature review.<br />
Euro II<br />
Euro IV<br />
Average<br />
Table 11. Vehicle occupancy for different modes<br />
Private<br />
Public<br />
• Fuel Efficiency at 50 kph (km/liter)<br />
Occupancy<br />
2015 2024 2034<br />
Car 1.5 1.5 1.5<br />
2-wheeler 1 1 1<br />
Taxi 1.8 1.8 1.8<br />
3-wheeler 1.8 1.8 1.8<br />
Bus 40 40 40<br />
Jeepney 16 16 16<br />
BRT 40 40 40<br />
The TEEMP model, calibrates <strong>the</strong> fuel efficiency <strong>of</strong> different modes at different speeds using insights<br />
from existing models such as COPERT, CORINAR etc. The fuel efficiency at 50 kph is factored <strong>and</strong><br />
Pre-Euro<br />
Euro I<br />
Euro II<br />
Euro IV<br />
Average<br />
45
<strong>Environmental</strong> <strong>and</strong> <strong>Health</strong> <strong>Benefits</strong> <strong>of</strong> <strong>the</strong> <strong>Cebu</strong> City BRT: Final Report<br />
lowered as per <strong>the</strong> speed reductions. The current fuel efficiency values have been taken from<br />
literature review (as indicated in <strong>the</strong> previous discussion <strong>of</strong> emission factors) <strong>and</strong> expert judgment<br />
as no local studies are available on fuel consumption <strong>of</strong> vehicles. The fuel consumption values<br />
proposed gets adjusted with speed <strong>and</strong> thus on road fuel consumption values are generated inside<br />
<strong>the</strong> model.<br />
Private<br />
Public<br />
Table 12. Average Fuel consumption values at 50 kph speed <strong>and</strong> Values used for <strong>Cebu</strong><br />
Default considered for 50kph TEEMP analyzed for <strong>Cebu</strong><br />
Petrol<br />
(km/liter) Diesel (km/liter)<br />
Petrol<br />
(km/liter) Diesel (km/liter)<br />
Car 14 17 8 9<br />
2-wheeler 70 32<br />
Taxi 14 17 7 8<br />
3-wheeler 40 19<br />
Bus<br />
Jeepney 13 16 5<br />
BRT 5 3<br />
The table above gives <strong>the</strong> average fuel consumption values at 50kph speed <strong>and</strong> TEEMP analyzed values<br />
for fuel efficiency for <strong>Cebu</strong> speed.<br />
4.3 BRT Components<br />
The ridership <strong>and</strong> speed are sensitive to <strong>the</strong> BRTS design <strong>and</strong> hence borrowing insights from ITDP’s BRT<br />
design guide <strong>and</strong> its working experience on Asian BRT systems, in TEEMP BRT model, a concept <strong>of</strong> ridership<br />
depreciation is proposed to observe <strong>the</strong> impacts <strong>of</strong> various components on emissions. The BRT St<strong>and</strong>ard<br />
proposed by ITDP <strong>and</strong> o<strong>the</strong>rs follows a new scoring system to establish a broad, global underst<strong>and</strong>ing <strong>of</strong> what<br />
defines world-class BRT systems. The BRT St<strong>and</strong>ard outlines best practices <strong>and</strong> case studies, <strong>and</strong> introduces a<br />
universal st<strong>and</strong>ard to recognize leaders <strong>and</strong> compare BRT systems. 25<br />
The <strong>Cebu</strong> BRT is assumed to consist <strong>of</strong> <strong>the</strong> following elements based on <strong>the</strong> “Study <strong>and</strong> Concept Plan for a<br />
Demonstration Bus Rapid Transit Corridor” or <strong>the</strong> Pre-Feasibility Report (ITP, 2010) <strong>and</strong> <strong>Cebu</strong> BRT Feasibility<br />
Report (ITP, 2012).<br />
For High <strong>and</strong> Low Scenarios, <strong>the</strong> score equals 75 out <strong>of</strong> 100 <strong>and</strong> hence a ridership bonus factor <strong>of</strong> 1.15 is<br />
proposed. The <strong>Cebu</strong> BRT Feasibility Report (ITP, 2012) suggests that a Bus Priority corridor instead <strong>of</strong> a<br />
full BRT system would be developed between Ayala Center-Talamban for 6 km. Thus in order to capture<br />
this impact, in <strong>the</strong> “Feasible” scenario, <strong>the</strong> revised BRT scoring was adopted <strong>and</strong> as seen from <strong>the</strong> table a<br />
ridership bonus factor <strong>of</strong> 1.13 is proposed.<br />
25 http://www.itdp.org/index.php?/microsites/brt-st<strong>and</strong>ard/<br />
46
Service Planning<br />
<strong>Environmental</strong> <strong>and</strong> <strong>Health</strong> <strong>Benefits</strong> <strong>of</strong> <strong>the</strong> <strong>Cebu</strong> City BRT: Final Report<br />
Table 13. BRT Scorecard<br />
Component<br />
BRT<br />
System<br />
Feasible<br />
Scenario<br />
Off-vehicle fare collection <strong>and</strong> fare verification 7 4<br />
Multiple routes use same BRT infrastructure 0 0<br />
Peak period frequency 4 4<br />
Off-peak frequency 3 3<br />
Limited <strong>and</strong> local stop services 2 2<br />
System control center 2 1<br />
Routes in top 10 dem<strong>and</strong> corridors 2 2<br />
Operates late nights <strong>and</strong> weekends 0 0<br />
Part <strong>of</strong> (planned) multi-corridor BRT network 2 2<br />
Infrastructure<br />
Bus lanes in central verge <strong>of</strong> <strong>the</strong> road 7 4<br />
Physically-separated right-<strong>of</strong>-way 4 4<br />
Intersection treatments 5 4<br />
Physically-separated passing lanes at station stops 3 2<br />
Stations set back from intersections 3 3<br />
Stations are in center <strong>and</strong> shared by both directions <strong>of</strong> service 3 3<br />
Emissions st<strong>and</strong>ards 0 2<br />
Pavement quality 2 2<br />
Station Design <strong>and</strong> Station-Bus Interface<br />
Platform-level boarding 6 6<br />
Safe, wide, attractive wea<strong>the</strong>r-protected stations 3 3<br />
3+ doors on articulated buses or 2+ very wide doors on<br />
st<strong>and</strong>ard buses<br />
3 3<br />
Multiple docking bays <strong>and</strong> sub-stops 0 0<br />
Sliding doors at BRT stations 1 1<br />
Quality <strong>of</strong> Service <strong>and</strong> Passenger information Systems<br />
Br<strong>and</strong>ing <strong>of</strong> vehicles <strong>and</strong> system 3 3<br />
Passenger information at stops <strong>and</strong> on vehicles 2 1<br />
Integration <strong>and</strong> Access<br />
Universal access 3 1<br />
Integration with o<strong>the</strong>r public transport 3 3<br />
Improved safe <strong>and</strong> attractive pedestrian access system <strong>and</strong><br />
corridor environment<br />
2 2<br />
Secure bicycle parking at station stops 0 0<br />
Bike lanes on corridor or on parallel streets 0 0<br />
Bicycles permitted on vehicles 0 0<br />
Bicycle sharing systems at BRT stations 0 0<br />
Point Deduction<br />
47
Component<br />
Minimum average commercial speed below 13kph/8mph<br />
Peak passengers per hour per direction (pphpd) below 1,000<br />
Lack <strong>of</strong> enforcement <strong>of</strong> right-<strong>of</strong>-way<br />
Significant gap between bus floor <strong>and</strong> station platform<br />
Bus stop/station encroaches on sidewalk or busway<br />
Overcrowding<br />
Poorly maintained buses <strong>and</strong> stations<br />
Distances between stations too long or too short<br />
a. L<strong>and</strong> Use Factor<br />
<strong>Environmental</strong> <strong>and</strong> <strong>Health</strong> <strong>Benefits</strong> <strong>of</strong> <strong>the</strong> <strong>Cebu</strong> City BRT: Final Report<br />
BRT<br />
System<br />
Feasible<br />
Scenario<br />
TOTAL SCORE 0 0<br />
ASSESSMENT 75 65<br />
Ridership Bonus Factor 1.15 1.13<br />
Significant investment in <strong>the</strong> transport system has a pr<strong>of</strong>ound influence on adjacent l<strong>and</strong> use patterns. As <strong>the</strong><br />
accessibility to high quality public transit increases, l<strong>and</strong> value <strong>and</strong> potential for growth also subsequently<br />
increase. Such urban development patterns can influence travel behavior (i.e., locations <strong>of</strong> origin <strong>and</strong><br />
destination, trip length, mode choice, number <strong>of</strong> trips) for <strong>the</strong> long term <strong>and</strong> impact on <strong>the</strong> energy consumed<br />
<strong>and</strong> emissions resulting from transportation. Such impacts <strong>of</strong> <strong>the</strong> built environment on transport can be<br />
understood by analyzing <strong>the</strong> impact <strong>of</strong> a set <strong>of</strong> “5Ds” as popularized by <strong>the</strong> works <strong>of</strong> Cervero, Kockelman <strong>and</strong><br />
Ewing.<br />
• Density is considered as activity level per unit area. The activity can be population <strong>and</strong> employment.<br />
• Diversity is measured as availability <strong>and</strong> intensity <strong>of</strong> different types <strong>of</strong> l<strong>and</strong> use.<br />
• Design refers to <strong>the</strong> type <strong>of</strong> local street design in <strong>the</strong> neighborhood. More than aes<strong>the</strong>tics, design<br />
refers to <strong>the</strong> “functionalism” <strong>of</strong> <strong>the</strong> built environment (Sivam, 2009).<br />
• Destination accessibility is <strong>the</strong> measure <strong>of</strong> <strong>the</strong> access to trip attractions.<br />
• Distance to transit is a measure <strong>of</strong> public transport accessibility.<br />
In order to capture <strong>the</strong> impact <strong>of</strong> BRT on l<strong>and</strong> use developments <strong>and</strong> a subsequent impact on emissions, a<br />
l<strong>and</strong> use factor has been proposed. This multiplier tries to capture <strong>the</strong> subsequent impact on l<strong>and</strong> use<br />
patterns by <strong>the</strong> BRT improved accessibility. Such impact induces more transit patronage, use <strong>of</strong> sustainable<br />
modes such as biking <strong>and</strong> walking due to improved connectivity <strong>and</strong> l<strong>and</strong> use modifications. L<strong>and</strong> use Factor<br />
is defined as vehicle-mile reductions per passenger mile. Based on <strong>the</strong> current literature review, a l<strong>and</strong> use<br />
factor <strong>of</strong> 1.9 has been proposed. As discussed earlier, this factor multiplier 26 considers long term impact <strong>of</strong><br />
BRT on adjacent l<strong>and</strong> use <strong>and</strong> <strong>the</strong> added benefits <strong>of</strong> high density, l<strong>and</strong> use transformation, diversity <strong>and</strong><br />
increase in NMT trips due to improved accessibility in areas surrounding <strong>the</strong> BRT system.<br />
26 http://www.aptast<strong>and</strong>ards.com/LinkClick.aspx?fileticket=6-DL0k6lBgE%3D&tabid=249&mid=1277&language=en-US<br />
, <strong>and</strong> http://www.nelsonnygaard.com/Documents/Reports/Quantifying-Greenhouse-Gas-Emissions-from-Transit.pdf<br />
48
. Construction Emissions<br />
<strong>Environmental</strong> <strong>and</strong> <strong>Health</strong> <strong>Benefits</strong> <strong>of</strong> <strong>the</strong> <strong>Cebu</strong> City BRT: Final Report<br />
BRT construction emissions account for <strong>the</strong> emissions generated during material production <strong>and</strong> construction<br />
<strong>of</strong> infrastructure such as additional lanes, stations etc. The construction emissions are quantified based on<br />
energy required to produce – cement, steel <strong>and</strong> bitumen. The TEEMP road model provides a detailed<br />
literature review on <strong>the</strong> construction emissions. For <strong>the</strong> <strong>Cebu</strong> study, <strong>the</strong> quantity <strong>of</strong> bitumen, cement <strong>and</strong><br />
steel have been assumed from <strong>the</strong> ADB (2010) “Methodology for Estimating Carbon Footprint <strong>of</strong> Road<br />
Projects: Case Study: India” for a typical National Highway. 27<br />
4.4. Analysis<br />
The BRT emissions model captures <strong>the</strong> impact <strong>of</strong> BRT on CO2 emissions by quantifying <strong>the</strong> construction,<br />
operation <strong>and</strong> traffic impacts <strong>of</strong> projected BRT users. It is assumed that in case <strong>the</strong> BRT would not have been<br />
constructed, <strong>the</strong> users would have been forced to use <strong>the</strong> existing modes <strong>and</strong> thus <strong>the</strong> emissions saved<br />
results from quantifying <strong>the</strong> business as usual case <strong>of</strong> <strong>the</strong> proposed BRT riders. The boundary <strong>of</strong><br />
quantification is fixed across <strong>the</strong> BRT riders only.<br />
Emissions saved from BRT = Emissions from BRT riders using alternate modes without BRT – Operation<br />
emissions <strong>of</strong> BRT – construction emissions from BRT.<br />
The primary savings are derived from <strong>the</strong> mode shift impacts <strong>and</strong> increase in speed <strong>and</strong> occupancy factors.<br />
The impact on <strong>the</strong> movement <strong>of</strong> o<strong>the</strong>r modes <strong>of</strong> transport (i.e. speed increase, or vehicles which people used<br />
earlier to make <strong>the</strong> trip are still being used perhaps by ano<strong>the</strong>r family member) after <strong>the</strong> BRT has been<br />
constructed) is neglected because <strong>of</strong> induced component. Inclusion <strong>of</strong> this aspect would require not only<br />
data-intensive traffic modelling but also city-wide additional surveys <strong>and</strong> <strong>the</strong> accuracy would still depend on<br />
several network factors <strong>and</strong> information on link/future projects/investments. Currently, such kind <strong>of</strong> benefits<br />
are not reflected in <strong>the</strong> vehicle operating cost <strong>and</strong> travel time savings which are calculated during feasibility<br />
stage which have greater economic value when compared to CO2 savings. It may not be justifiable to conduct<br />
city-wide surveys just for <strong>the</strong> quantification <strong>of</strong> <strong>the</strong> CO2 benefits. 28 Instead, a l<strong>and</strong> use factor has been<br />
proposed as discussed earlier. The analysis consists <strong>of</strong> computations for construction <strong>and</strong> operation<br />
emissions from BRT system <strong>and</strong> savings due to mode shift.<br />
It is recommended to adopt <strong>the</strong> average trip lengths <strong>of</strong> BRT trips as <strong>the</strong> basis for quantification. For example,<br />
in case <strong>the</strong> average trip length <strong>of</strong> different modes (without availability <strong>of</strong> BRT) works out to be 6 km, <strong>the</strong><br />
average trip length <strong>of</strong> BRT user should be 6 km <strong>and</strong> vice versa. This assumption neglects <strong>the</strong> trip to <strong>and</strong> from<br />
<strong>the</strong> BRT stations in order to simplify <strong>the</strong> analysis <strong>and</strong> data needed for <strong>the</strong> analysis.<br />
27 http://www.adb.org/documents/reports/estimating-carbon-footprints-road-projects/default.asp<br />
28 Schipper, el al. (2010) found that in Mexico MetroBus project, if CO2 is valued even at USD$85/tonne, <strong>the</strong> CO 2 co-benefits add<br />
almost USD $4m to <strong>the</strong> total, <strong>and</strong> <strong>the</strong> CO 2 is worth about 20% <strong>of</strong> <strong>the</strong> total project benefits. Available:<br />
http://metrostudies.berkeley.edu/.../shipper-considclimatechange-latinamer.pdf<br />
49
<strong>Environmental</strong> <strong>and</strong> <strong>Health</strong> <strong>Benefits</strong> <strong>of</strong> <strong>the</strong> <strong>Cebu</strong> City BRT: Final Report<br />
Motorization trend is captured with suitable changes in <strong>the</strong> mode shares to favor private transport in <strong>the</strong><br />
intermediate <strong>and</strong> horizon year (middle <strong>and</strong> final years <strong>of</strong> assessment) when quantifying <strong>the</strong> business as usual<br />
case. As discussed earlier, impact <strong>of</strong> speed on emission factors is captured using insights from various studies<br />
such as TRL, COPERT, CORINAR, ADB Green Transport Study <strong>and</strong> DIESEL project.<br />
The upstream effect <strong>of</strong> emissions due to fuel production can be captured by using a default value <strong>of</strong> 14% 29<br />
but has been neglected in <strong>the</strong> present analysis. Fuel economy improvements due to any future fuel economy<br />
st<strong>and</strong>ards are not considered as <strong>the</strong> roadmap for establishing fuel economy st<strong>and</strong>ards is not clear. Fur<strong>the</strong>r<br />
information on how fuel efficiency <strong>of</strong> buses could be improved is provided in Annex A.<br />
4.5. TEEMP Results<br />
Table 14. TEEMP Results considering Low <strong>and</strong> High Scenario <strong>and</strong> with <strong>and</strong> without L<strong>and</strong> Use Impact<br />
Results<br />
Low<br />
Scenario<br />
Without L<strong>and</strong> Use Impact With L<strong>and</strong> Use Impact<br />
High<br />
Scenario<br />
Feasible<br />
Scenario<br />
Low<br />
Scenario<br />
High<br />
Scenario<br />
Feasible<br />
Scenario<br />
Ridership/year<br />
(millions)<br />
2015 93 134 123 93 134 123<br />
2024 136 195 180 136 195 180<br />
2034 207 297 274 207 297 274<br />
Emissions Savings<br />
PM reduction<br />
(tons) 167 239 232 347 497 470<br />
NOx reduction<br />
(tons) 1,160 1,665 1,779 4,518 6,483 6,214<br />
CO2 reduction<br />
(tons) 895,706 1,292,996 1,188,802 2,053,350 2,954,211 2,717,950<br />
PM reduction<br />
(tons/km) 10 15 14 22 31 29<br />
NOx reduction<br />
(tons/km) 73 104 111 282 405 388<br />
CO2 reduction<br />
(tons/km) 55,982 80,812 74,300 128,334 184,638 169,872<br />
PM reduction<br />
(tons/km/yr) 0.52 0.75 0.72 1 2 1<br />
NOx reduction<br />
(tons/km/yr) 4 5 6 14 20 19<br />
CO2 reduction<br />
(tons/km/yr) 2,799 4,041 3,715 6,417 9,232 8,494<br />
Co-benefits<br />
VKT Saved 6,319 9,067 8,346 12,397 17,789 16,375<br />
29 Literature review <strong>of</strong> various studies, including those from <strong>the</strong> International Energy Agency <strong>and</strong> <strong>the</strong> <strong>Clean</strong><br />
Development Mechanism, suggests a mid value <strong>of</strong> 14% as reasonable (from ADB, 2010)<br />
50
Results<br />
Low<br />
Scenario<br />
<strong>Environmental</strong> <strong>and</strong> <strong>Health</strong> <strong>Benefits</strong> <strong>of</strong> <strong>the</strong> <strong>Cebu</strong> City BRT: Final Report<br />
Without L<strong>and</strong> Use Impact With L<strong>and</strong> Use Impact<br />
High<br />
Scenario<br />
Feasible<br />
Scenario<br />
Low<br />
Scenario<br />
High<br />
Scenario<br />
Feasible<br />
Scenario<br />
(millions)<br />
Time travel<br />
savings<br />
('000s hours) 270,554 388,244 357,378 270,554 388,244 357,378<br />
No. <strong>of</strong> fatalities<br />
reduced 727 1043 960 1427 2048 1,885<br />
No. <strong>of</strong> injuries<br />
reduced 10,907 15,652 14,407 21,408 30,721 28,279<br />
Fuel Savings<br />
('000 USD) 444,666 638,094 587,365 988,959 1,419,154 1,306,330<br />
Emissions<br />
reduction<br />
('000 USD) 25,178 35,977 34,184 62,781 89,938 83,855<br />
By including <strong>the</strong> l<strong>and</strong> use multiplier, <strong>the</strong> impact increases. Currently <strong>the</strong> literature on l<strong>and</strong> use multipliers is<br />
still being investigated <strong>and</strong> thus <strong>the</strong> l<strong>and</strong> use impact values are suggested to indicate that <strong>the</strong> savings derived<br />
without l<strong>and</strong> use impact is very conservative in nature. The benefits from <strong>the</strong> <strong>Cebu</strong> BRT would be higher than<br />
what was quantified without considering l<strong>and</strong> use impact. For subsequent discussion, <strong>the</strong> results from<br />
without l<strong>and</strong> use impact have been considered.<br />
4.6. Observations<br />
a) The CO2 savings from <strong>the</strong> project is in <strong>the</strong> range <strong>of</strong> 2,799 to 4,041 tons/km/yr, which is an average <strong>of</strong><br />
3,400 tons/km/yr. With l<strong>and</strong> use impact <strong>the</strong> CO2 could be an average <strong>of</strong> 7,800 tons/km/yr. The<br />
savings from this project is comparable to o<strong>the</strong>r BRT projects in Asia as shown in <strong>the</strong> figure below.<br />
The feasibility report (ITP, 2012) data indicates a saving <strong>of</strong> 3,700 to 8,500 tons/km/yr.<br />
51
12000<br />
10000<br />
8000<br />
6000<br />
4000<br />
2000<br />
0<br />
Lima, Peru<br />
<strong>Environmental</strong> <strong>and</strong> <strong>Health</strong> <strong>Benefits</strong> <strong>of</strong> <strong>the</strong> <strong>Cebu</strong> City BRT: Final Report<br />
Figure 29. CO2 Savings from BRT Projects<br />
b) The PM savings derived from this project is conservative as emission st<strong>and</strong>ards improvement has<br />
been considered. The total savings from <strong>the</strong> project is in <strong>the</strong> range <strong>of</strong> 167 to 239 tons. The Gold<br />
st<strong>and</strong>ard BRT in Asia i.e. Guangzhou BRT 30 saves around 40 tons <strong>of</strong> PM over 10 years for a length <strong>of</strong><br />
22.5 km i.e. 0.2 tons/year/km. The <strong>Cebu</strong> project saves around 0.5 to 0.75 tons/km/year. The Rio de<br />
Janeiro BRT saves around 0.1 to 0.3 tons /year/km 31 . The Jakarta BRT corridor one saves around 0.8<br />
tons/year/km 32 . The higher savings in <strong>Cebu</strong> when compared with Guangzhou <strong>and</strong> Rio de Janeiro is<br />
due to high shift from jeepneys <strong>and</strong> high number <strong>of</strong> pre-euro vehicles which still exist on <strong>the</strong> road in<br />
<strong>Cebu</strong>. The PM savings are conservative because <strong>the</strong> analysis assumed that tighter vehicle emission<br />
st<strong>and</strong>ards would be enforced during <strong>the</strong> BRT’s operation resulting in a much cleaner fleet in <strong>Cebu</strong>.<br />
c) The total NOx savings derived from this project is <strong>the</strong> range <strong>of</strong> 1,160 to 1,780 tons or 4 to 5.5<br />
tons/km/year. In comparison Guangzhou BRT saves around 20 tons/km/year. The high savings in<br />
30 http://www.itdp.org/documents/20110810-ITDP-GZBRTImpacts.pdf<br />
31 http://164.67.121.27/files/UP/Posters%202012/26%20Lupita%20Ibarra.pdf<br />
32 http://esci-ksp.org/wp/wp-content/uploads/2012/05/Energy-<strong>and</strong>-<strong>Environmental</strong>-Impacts-<strong>of</strong>-BRT-in-APEC-<br />
Economies.pdf<br />
Cali, Colombia<br />
Mexico City, Mexico<br />
Lanzhou, China<br />
Medellin, Colombia<br />
Managua, Nicaragua<br />
Johannesburg<br />
EDOMEX, Mexico<br />
CO2 Savings from BRT Projects<br />
Bogota Colombia<br />
Zhengzhou, China<br />
TransOeste, Rio De Janeiro<br />
Jakarta<br />
Chongqing, China<br />
Quito, Ecuador<br />
<strong>Cebu</strong><br />
Guangzhou BRT<br />
Guatemala City<br />
TransCarioca, Rio De Janeiro<br />
Guatemala<br />
Lima, Peru<br />
Cali, Colombia<br />
Mexico City, Mexico<br />
Lanzhou, China<br />
Medellin, Colombia<br />
Managua, Nicaragua<br />
Johannesburg<br />
EDOMEX, Mexico<br />
Bogota Colombia<br />
Zhengzhou, China<br />
TransOeste, Rio De Janeiro<br />
Jakarta<br />
Chongqing, China<br />
Quito, Ecuador<br />
<strong>Cebu</strong><br />
Guangzhou BRT<br />
Guatemala City<br />
TransCarioca, Rio De<br />
Janeiro<br />
Guatemala<br />
52
<strong>Environmental</strong> <strong>and</strong> <strong>Health</strong> <strong>Benefits</strong> <strong>of</strong> <strong>the</strong> <strong>Cebu</strong> City BRT: Final Report<br />
Guangzhou is due to inclusion <strong>of</strong> increase in mixed traffic speed parameter <strong>and</strong> high efficient buses<br />
being introduced as BRT buses (Euro IV). Rio de Janeiro BRT saves around 1 to 3 tons/year/km <strong>and</strong><br />
Jakarta BRTS corridor saves around 5.5 tons/km/year which is comparable to <strong>Cebu</strong> BRTS.<br />
d) One <strong>of</strong> <strong>the</strong> limitations <strong>of</strong> <strong>the</strong> study is <strong>the</strong> use <strong>of</strong> general emission factors based on literature survey<br />
<strong>and</strong> expert judgment, as <strong>the</strong> Philippines does not have local emission factors for different vehicle<br />
types <strong>and</strong> equivalent emission st<strong>and</strong>ards. The government <strong>and</strong> o<strong>the</strong>r stakeholders should support<br />
development <strong>of</strong> local emission factors for deriving better insights. However, <strong>the</strong> estimates from this<br />
project are comparable with o<strong>the</strong>r CDM <strong>and</strong> o<strong>the</strong>r BRTS projects.<br />
In summary, <strong>the</strong> key messages from <strong>the</strong> analysis are:<br />
a) In terms <strong>of</strong> vehicle kilometer travel reductions, <strong>the</strong> project over its lifecycle removes 20,000 to<br />
30,000 new cars from road.<br />
b) In terms <strong>of</strong> PM reductions, <strong>the</strong> project over its lifecycle removes 600 to 1000 two stroke new<br />
tricycles.<br />
c) In terms <strong>of</strong> NOx reductions, <strong>the</strong> project over its lifecycle removes 250 to 350 new pre- euro buses.<br />
d) The project costs 60 to 90$ for 1 ton <strong>of</strong> reduction <strong>of</strong> CO2.<br />
e) The project over <strong>the</strong> lifetime saves more CO2 emissions <strong>and</strong> fuel <strong>the</strong>n one to two years <strong>of</strong> fuel<br />
consumption <strong>and</strong> CO2 emissions from transport sector in <strong>Cebu</strong>.<br />
f) In terms <strong>of</strong> accident fatalities, <strong>the</strong> project over its lifecycle saves around 727 lives (Low Scenario<br />
without l<strong>and</strong> use impact) which is almost as high as <strong>the</strong> Philippines’ annual traffic fatality.<br />
53
5. HEALTH SAVINGS FROM CEBU BRT<br />
<strong>Environmental</strong> <strong>and</strong> <strong>Health</strong> <strong>Benefits</strong> <strong>of</strong> <strong>the</strong> <strong>Cebu</strong> City BRT: Final Report<br />
The Simple Integrated Model for better air quality ( (SIM-air) family <strong>of</strong> tools uses <strong>the</strong> best available information informat<br />
with <strong>the</strong> academic, government, non non-government, government, <strong>and</strong> private bodies, to support integrated urban air quality<br />
management. Each <strong>of</strong> <strong>the</strong> modules presented in Figure 30 is designed to collate <strong>the</strong> necessary information,<br />
estimate emissions from various sources sources, <strong>and</strong> simulate <strong>the</strong> interactions between emissions, pollution<br />
dispersion, impacts, <strong>and</strong> management options. These tools are distributed for free by UrbanEmissions.Info,<br />
along with <strong>the</strong> case studies from applications in <strong>the</strong> cities <strong>of</strong> Hyderabad, Delhi, Pune, Che Chennai, Che Kathm<strong>and</strong>u,<br />
Dhaka, Shanghai, Ulaanbaatar, Hanoi, Manila, Bangkok, <strong>and</strong> Lagos. All <strong>the</strong> databases <strong>and</strong> interfaces are<br />
designed in MS Excel to visualize <strong>the</strong> flow <strong>of</strong> information between each <strong>of</strong> <strong>the</strong> modules, to better underst<strong>and</strong><br />
<strong>the</strong> bottlenecks <strong>of</strong> analytical tools, <strong>and</strong> to improve <strong>the</strong> modules with information, as <strong>and</strong> when it is made<br />
available. Each <strong>of</strong> <strong>the</strong> modules is also linked to Google Earth <strong>and</strong> ESRI ArcGIS programs for better spatial<br />
mapping <strong>of</strong> <strong>the</strong> emissions, concentrations, <strong>and</strong> impacts.<br />
Figure 30. SIM-air Program Components<br />
The methodology followed for <strong>the</strong> analysis <strong>of</strong> health benefits from BRT application in <strong>the</strong> <strong>Cebu</strong> City for is<br />
described in detail below.<br />
The emission savings (for baseline defined as without BRT <strong>and</strong> for scenario defined as with BRT system system) system are<br />
determined using <strong>the</strong> Transport Emissions Evaluation Model for Projects (TEEMP) models – results<br />
summarized in <strong>the</strong> Table 14.<br />
The modelling domain over Metro <strong>Cebu</strong> is selected as shown in Figure 31 with a spatial resolution <strong>of</strong> 0.005<br />
degrees in longitude de <strong>and</strong> latitude, which translates to ~550 meters. The modelling do domain main is designated to<br />
cover <strong>the</strong> area between 123.75° to 124.00° in longitude <strong>and</strong> 10.20° to 10.40° in latitude latitude. . The gridded domain<br />
is 50 cells in longitude <strong>and</strong> 40 cells in latitude. The gridd gridded domain presented in Figure 31 is available in<br />
Google KML or ESRI Shapefile for fur<strong>the</strong>r use. The BRT road sections are also highlighted along with <strong>the</strong> grids<br />
54
<strong>Environmental</strong> <strong>and</strong> <strong>Health</strong> <strong>Benefits</strong> <strong>of</strong> <strong>the</strong> <strong>Cebu</strong> City BRT: Final Report<br />
Figure 31. Study Area in Gridded Format<br />
The particulate pollution concentrations for <strong>the</strong> base year 2010 <strong>and</strong> <strong>the</strong> projected years (calculated using <strong>the</strong><br />
TEEMP modelling system) were modelled using <strong>the</strong> Atmospheric Transport Modelling System (ATMoS)<br />
dispersion model - a UNIX/Linux based meso-scale three-layer forward trajectory Lagrangian Puff-transport<br />
model. This model was previously utilized to study pollution management in Asia <strong>and</strong> Latin American cities<br />
<strong>and</strong> calibrated to address <strong>the</strong> area <strong>and</strong> point sources for long term pollution modelling <strong>and</strong> health<br />
assessments. The ATMoS model is a modified version <strong>of</strong> <strong>the</strong> USA National Oceanic Atmospheric<br />
Administration, Branch Atmospheric Trajectory (BAT) model with three layers - surface layer, boundary layer<br />
(designated as <strong>the</strong> mixing layer height) <strong>and</strong> a top layer. The multiple layers allow <strong>the</strong> model to differentiate<br />
<strong>the</strong> contributions <strong>of</strong> diffused area sources like transport <strong>and</strong> domestic combustion emissions <strong>and</strong> points like<br />
industrial <strong>and</strong> power plant emissions. The model also includes first order chemical reactions for SO2 <strong>and</strong> NOx<br />
emissions to estimate <strong>the</strong> secondary contributions in <strong>the</strong> form <strong>of</strong> sulphates <strong>and</strong> nitrates, added to <strong>the</strong> total<br />
PM2.5 concentrations. The model has flexible temporal <strong>and</strong> spatial resolution <strong>and</strong> can run for periods ranging<br />
from one month to a year <strong>and</strong> from regional to urban scales. The model produces monthly average<br />
concentrations as output <strong>and</strong> <strong>the</strong>n converted to seasonal <strong>and</strong> yearly averages for fur<strong>the</strong>r analysis. The model<br />
operations are explained in detail in Annex B.<br />
The meteorological data for <strong>the</strong> <strong>Cebu</strong> analysis comes from <strong>the</strong> NOAA National Centre for <strong>Environmental</strong><br />
Prediction (NCEP) Reanalysis data. In <strong>the</strong> model, <strong>the</strong> NCEP data for global 3D wind <strong>and</strong> temperature, surface<br />
wind, temperature, <strong>and</strong> pressure, surface heat flux, <strong>and</strong> precipitation fields are re-gridded to establish <strong>the</strong><br />
mixing layer height for <strong>the</strong> city domain, before <strong>the</strong> dispersion modelling.<br />
55
<strong>Environmental</strong> <strong>and</strong> <strong>Health</strong> <strong>Benefits</strong> <strong>of</strong> <strong>the</strong> <strong>Cebu</strong> City BRT: Final Report<br />
The predominant wind direction in <strong>Cebu</strong> is <strong>of</strong>ten Westerly <strong>and</strong> with speeds higher than 6 m/sec. The total<br />
precipitation levels are constant over <strong>the</strong> months. The mixing heights, being a coastal city are also very<br />
consistent over <strong>the</strong> months, with highs over <strong>the</strong> winter months due to low wind speeds. This is crucial in <strong>the</strong><br />
overall pollution calculations, which determines <strong>the</strong> seasonal trend in <strong>the</strong> concentrations. The general rule <strong>of</strong><br />
thumb is that lower <strong>the</strong> mixing heights, higher <strong>the</strong> concentrations in <strong>the</strong> region.<br />
Using <strong>the</strong> local meteorology presented in Annex C <strong>and</strong> for <strong>the</strong> domain at ~500m grid resolution, <strong>the</strong> project<br />
team used <strong>the</strong> ATMoS modelling system to develop a baseline transfer matrix, which is defined as <strong>the</strong> change<br />
in grid level concentrations for an incremental change in emissions in each <strong>of</strong> <strong>the</strong> grids. Since, <strong>the</strong> change in<br />
concentrations varies with meteorological conditions <strong>and</strong> with source type, <strong>the</strong> transfer matrix presented in<br />
this report are relevant only for use with <strong>the</strong> vehicle emission sources <strong>and</strong> for <strong>the</strong> use over Metro <strong>Cebu</strong><br />
domain presented in Figure 31. The baseline emissions analysis is for <strong>the</strong> year 2010. The same transfer matrix<br />
calculations are <strong>the</strong>n repeated for emission savings <strong>of</strong> <strong>the</strong> BRT system. The calculations are available for both<br />
<strong>the</strong> PM fractions PM10 <strong>and</strong> PM2.5.<br />
The transfer matrices for coarse PM (for PM between 2.5 <strong>and</strong> 10 micro-meters), fine PM (for PM less than 2.5<br />
micron-meter), sulphates, <strong>and</strong> nitrates are presented in <strong>the</strong> attached excel sheets for fur<strong>the</strong>r use. For <strong>the</strong><br />
domain selected for Metro <strong>Cebu</strong>, this matrix is 2000 x 2000 points <strong>and</strong> currently designed <strong>and</strong> setup for use<br />
for studies beyond <strong>the</strong> BRT analysis. Some example images from <strong>the</strong> excel-based system are presented<br />
below.<br />
An important objective <strong>of</strong> this study was to assess <strong>the</strong> baseline health impacts <strong>of</strong> current air pollution<br />
trends in <strong>the</strong> city (based on <strong>the</strong> estimated emissions inventory <strong>and</strong> concentration pr<strong>of</strong>iles over <strong>the</strong> city)<br />
<strong>and</strong> compare scenarios with BRT implemented in <strong>the</strong> city in terms <strong>of</strong> health impacts (mortality <strong>and</strong><br />
morbidity).<br />
The health impacts are calculated using <strong>the</strong> following <strong>the</strong> methodology<br />
δ E = β * δC<br />
* δP<br />
where,<br />
δ E = number <strong>of</strong> estimated health effects (various end points for mortality <strong>and</strong> morbidity)<br />
β = <strong>the</strong> dose response function (DRF) for particular health endpoint; this is defined <strong>the</strong> change in<br />
number cases per unit change in concentrations. This is established based on epidemiological studies<br />
conducted over a period <strong>of</strong> time, analyzing <strong>the</strong> trends in hospital records <strong>and</strong> air pollution monitoring. In<br />
case <strong>of</strong> mortality, this is set at 0.15% per 20 µg/m 3 increase in <strong>the</strong> PM10 concentrations <strong>and</strong> a death<br />
incidence rate <strong>of</strong> 178 per 1,000 people for <strong>the</strong> Philippines (extracted from World <strong>Health</strong> Organization).<br />
This is based on <strong>the</strong> studies conducted by <strong>the</strong> <strong>Health</strong> Effects Institute, Boston (USA)<br />
C<br />
δ = <strong>the</strong> change in concentrations; <strong>the</strong> concentrations modeled above a certain threshold value.<br />
Although, WHO claims that <strong>the</strong>re is no threshold over which <strong>the</strong> health impacts are measured. In<br />
general, <strong>the</strong> impacts are felt at <strong>the</strong> minute fluctuations <strong>of</strong> <strong>the</strong> pollution. In this study, <strong>the</strong> threshold is set<br />
at 20 µg/m 3<br />
56
<strong>Environmental</strong> <strong>and</strong> <strong>Health</strong> <strong>Benefits</strong> <strong>of</strong> <strong>the</strong> <strong>Cebu</strong> City BRT: Final Report<br />
δ P = <strong>the</strong> population exposed to <strong>the</strong> incremental concentrations above; this could be on a grid by grid<br />
basis (used in this study) or for <strong>the</strong> city or region on a whole, depending on <strong>the</strong> level <strong>of</strong> information<br />
available.<br />
Among <strong>the</strong> criteria pollutants, PM is an established endpoint for assessing <strong>the</strong> health impacts in a city.<br />
Epidemiological studies in developed <strong>and</strong> developing countries have shown that elevated ambient PM<br />
levels lead to an increased risk <strong>of</strong> mortality <strong>and</strong> morbidity. <strong>Health</strong> effects range from minor irritation in<br />
eyes <strong>and</strong> upper respiratory system to chronic respiratory disease, heart disease, lung cancer, <strong>and</strong> leading<br />
up to pre-mature death. The dispersion modeling results for annual PM10 concentrations, overlaid on<br />
<strong>the</strong> gridded population (totaling to ~1.8 million in 2010) at <strong>the</strong> same grid resolution are utilized for<br />
calculating <strong>the</strong> health impacts. The dose-response functions for various endpoints are well documented<br />
in <strong>the</strong> studies across <strong>the</strong> world 33 <strong>and</strong> summarized in <strong>the</strong> table below along with health impact costs <strong>and</strong><br />
willingness to pay.<br />
Table 15.Dose-response coefficients <strong>and</strong> health impact costs utilized in <strong>the</strong> analysis<br />
<strong>Health</strong> impact <strong>Health</strong> coefficient <strong>Health</strong> cost/effect (PHP)<br />
Effects/capita/(µg/m3)<br />
Premature mortality 0.0000066 1,880,000<br />
Adult Chronic Bronchitis 0.00004 50,000<br />
Child Acute Bronchitis 0.000544 20,000<br />
Respiratory Hospital Admission 0.000012 2,000<br />
Cardiac Hospital Admission 0.000005 500,000<br />
Emergency Room Visit 0.000235 4,000<br />
Asthma Attacks (million) 0.0029 1,000<br />
Restricted Activity Days (million) 0.03828 500<br />
Respiratory Symptom Days (million) 0.183 30<br />
For <strong>the</strong> three scenarios (LOW, HIGH <strong>and</strong> FEASIBLE) discussed in Table 14 <strong>the</strong> transfer matrices were<br />
applied, <strong>the</strong> health impacts were calculated as per <strong>the</strong> emissions avoided per year, <strong>and</strong> valuated <strong>the</strong><br />
benefits in terms <strong>of</strong> <strong>the</strong> health costs. The health benefits from <strong>the</strong> BRT without considering l<strong>and</strong> use<br />
impacts could potentially be US$94 million to US$137 million per year (Tables 16, 17, <strong>and</strong> 18).<br />
Considering l<strong>and</strong> use impacts, <strong>the</strong> health benefits could potentially range from US$269 million to<br />
US$385 million per year as shown in Tables 19, 20 <strong>and</strong> 21.<br />
33 “<strong>Health</strong> Effects <strong>of</strong> Outdoor <strong>Air</strong> Pollution in Developing Countries <strong>of</strong> Asia: A Literature Review”, Special Report 15,<br />
2004, <strong>Health</strong> Effects Institute, Boston, USA; <strong>and</strong> “Outdoor <strong>Air</strong> Pollution <strong>and</strong> <strong>Health</strong> in <strong>the</strong> Developing Countries <strong>of</strong><br />
Asia: A Comprehensive Review”, Special Report 18, 2010, <strong>Health</strong> Effects Institute, Boston, USA.<br />
57
<strong>Environmental</strong> <strong>and</strong> <strong>Health</strong> <strong>Benefits</strong> <strong>of</strong> <strong>the</strong> <strong>Cebu</strong> City BRT: Final Report<br />
Table 16. <strong>Health</strong> benefits in case without l<strong>and</strong> use impact - LOW SCENARIO<br />
Summary <strong>Health</strong> Savings cost/unit (peso) Total savings<br />
Total Population 1,822,376<br />
(mil PHP)<br />
Premature mortality 506 1,880,000 952<br />
Adult Chronic Bronchitis 3,105 50,000 155<br />
Child Acute Bronchitis 22,737 20,000 455<br />
Respiratory Hospital Admission 931<br />
2,000<br />
2<br />
Cardiac Hospital Admission 388 500,000 194<br />
Emergency Room Visit 18,241<br />
4,000<br />
73<br />
Asthma Attacks 225,097<br />
1,000 225<br />
Restricted Activity Days 2,971,285<br />
500 1,486<br />
Respiratory Symptom Days 14,204,417<br />
30 426<br />
3,967 mil PHP<br />
Emission reductions (tons) 94 mil US$<br />
Total PM10 167<br />
Total PM2.5 167<br />
Total SO2 0<br />
Total NOx 1160<br />
Table 17. <strong>Health</strong> benefits in case without l<strong>and</strong> use impact - HIGH-SCENARIO<br />
Summary <strong>Health</strong> Savings cost/unit (peso) Total savings<br />
Total Population 1,822,376<br />
(mil PHP)<br />
Premature mortality 728 1,880,000 1,368<br />
Adult Chronic Bronchitis 4,449 50,000 222<br />
Child Acute Bronchitis 32,579 20,000 652<br />
Respiratory Hospital Admission 1,335<br />
2,000<br />
3<br />
Cardiac Hospital Admission 556 500,000 278<br />
Emergency Room Visit 26,137<br />
4,000 105<br />
Asthma Attacks 322,543<br />
1,000 323<br />
Restricted Activity Days 4,257,568<br />
500 2,129<br />
Respiratory Symptom Days 20,353,579<br />
30 611<br />
5,689 mil PHP<br />
Emission reductions (tons) 135 mil US$<br />
Total PM10 239<br />
Total PM2.5 239<br />
Total SO2 0<br />
Total NOx 1665<br />
58
<strong>Environmental</strong> <strong>and</strong> <strong>Health</strong> <strong>Benefits</strong> <strong>of</strong> <strong>the</strong> <strong>Cebu</strong> City BRT: Final Report<br />
Table 18. <strong>Health</strong> benefits in case without l<strong>and</strong> use impact - FEASIBLE-SCENARIO<br />
Summary <strong>Health</strong> Savings cost/unit (peso) Total savings<br />
Total Population 1,822,376<br />
(mil PHP)<br />
Premature mortality 737 1,880,000 1,385<br />
Adult Chronic Bronchitis 4,502 50,000 225<br />
Child Acute Bronchitis 32,965 20,000 659<br />
Respiratory Hospital Admission 1,350<br />
2,000<br />
3<br />
Cardiac Hospital Admission 563 500,000 281<br />
Emergency Room Visit 26,447<br />
4,000 106<br />
Asthma Attacks 326,363<br />
1,000 326<br />
Restricted Activity Days 4,307,994<br />
500 2,154<br />
Respiratory Symptom Days 20,594,644<br />
30 618<br />
5,757 mil PHP<br />
Emission reductions (tons) 137 mil US$<br />
Total PM10 232<br />
Total PM2.5 232<br />
Total SO2 0<br />
Total NOx 1779<br />
Table 19. <strong>Health</strong> benefits in case with L<strong>and</strong> Use Impact - LOW SCENARIO<br />
Summary <strong>Health</strong> Savings cost/unit (peso) Total savings<br />
Total Population 1,822,376<br />
(mil PHP)<br />
Premature mortality 1,447 1,880,000 2,720<br />
Adult Chronic Bronchitis 8,821 50,000 441<br />
Child Acute Bronchitis 64,596 20,000 1,292<br />
Respiratory Hospital Admission 2,646<br />
2,000<br />
5<br />
Cardiac Hospital Admission 1,103 500,000 551<br />
Emergency Room Visit 51,823<br />
4,000 207<br />
Asthma Attacks 639,516<br />
1,000 640<br />
Restricted Activity Days 8,441,608<br />
500 4,221<br />
Respiratory Symptom Days 40,355,650<br />
30 1,211<br />
11,287 mil PHP<br />
Emission reductions (tons) 269 mil US$<br />
Total PM10 347<br />
Total PM2.5 347<br />
Total SO2 0<br />
Total NOx 4518<br />
59
<strong>Environmental</strong> <strong>and</strong> <strong>Health</strong> <strong>Benefits</strong> <strong>of</strong> <strong>the</strong> <strong>Cebu</strong> City BRT: Final Report<br />
Table 20. <strong>Health</strong> benefits in case with L<strong>and</strong> Use Impact- HIGH-SCENARIO<br />
Summary <strong>Health</strong> Savings cost/unit (peso) Total savings<br />
Total Population 1,822,376<br />
(mil PHP)<br />
Premature mortality 2,075 1,880,000 3,902<br />
Adult Chronic Bronchitis 12,647 50,000 632<br />
Child Acute Bronchitis 92,618 20,000 1,852<br />
Respiratory Hospital Admission 3,794<br />
2,000<br />
8<br />
Cardiac Hospital Admission 1,581 500,000 790<br />
Emergency Room Visit 74,304<br />
4,000 297<br />
Asthma Attacks 916,940<br />
1,000 917<br />
Restricted Activity Days 12,103,602<br />
500 6,052<br />
Respiratory Symptom Days 57,862,045<br />
30 1,736<br />
16,186 mil PHP<br />
Emission reductions (tons) 385 mil US$<br />
Total PM10 497<br />
Total PM2.5 497<br />
Total SO2 0<br />
Total NOx 6483<br />
Table 21. <strong>Health</strong> benefits in case with L<strong>and</strong> Use Impact - FEASIBLE-SCENARIO<br />
Summary <strong>Health</strong> Savings cost/unit (peso) Total savings<br />
Total Population 1,822,376<br />
(mil PHP)<br />
Premature mortality 1,978 1,880,000 3,718<br />
Adult Chronic Bronchitis 12,054 50,000 603<br />
Child Acute Bronchitis 88,272 20,000 1,765<br />
Respiratory Hospital Admission 3,616<br />
2,000<br />
7<br />
Cardiac Hospital Admission 1,507 500,000 753<br />
Emergency Room Visit 70,817<br />
4,000 283<br />
Asthma Attacks 873,907<br />
1,000 874<br />
Restricted Activity Days 11,535,574<br />
500 5,768<br />
Respiratory Symptom Days 55,146,554<br />
30 1,654<br />
15,426 mil PHP<br />
Emission reductions (tons) 367 mil US$<br />
Total PM10 470<br />
Total PM2.5 470<br />
Total SO2 0<br />
Total NOx 6214<br />
60
<strong>Environmental</strong> <strong>and</strong> <strong>Health</strong> <strong>Benefits</strong> <strong>of</strong> <strong>the</strong> <strong>Cebu</strong> City BRT: Final Report<br />
BRT + Area Traffic Control (ATC) Scenario<br />
In addition to <strong>the</strong> three scenarios, <strong>the</strong> Project Team also estimated <strong>the</strong> health savings resulting from <strong>the</strong><br />
combined BRT + ATC scenario.<br />
The Project Team did not quantify <strong>the</strong> emission savings from <strong>the</strong> BRT+Area Traffic Control (ATC) Scenario. It<br />
used data solely from <strong>the</strong> Pre-feasibility Report. No estimate <strong>of</strong> PM reductions was given in <strong>the</strong> Feasibility<br />
Report (ITP, 2012), thus, <strong>the</strong> analysis <strong>of</strong> health savings from BRT+ATC was based on <strong>the</strong> Pre-feasibility<br />
Report figure. The emission savings quantified in <strong>the</strong> Pre-feasibility Report (ITP, 2010) considering <strong>the</strong><br />
BRT+ATC Scenario suggests a cumulative impact <strong>of</strong> 9,655 tons <strong>of</strong> PM reductions over <strong>the</strong> appraisal period <strong>of</strong><br />
2012 to 2035 (which translates to 30 tons/year/km) <strong>and</strong> PM savings <strong>of</strong> 386 tons in year 2020. It is unclear<br />
whe<strong>the</strong>r <strong>the</strong> computation <strong>of</strong> PM reduction in <strong>the</strong> Pre-feasibility Report considered expected significant<br />
improvements in vehicle technology <strong>and</strong> fuel quality over <strong>the</strong> next twenty four years, which is aligned with<br />
current trends in <strong>the</strong> Philippines <strong>and</strong> also <strong>the</strong> ASEAN. If <strong>the</strong>se were not considered, <strong>the</strong> estimated PM<br />
savings may be optimistic; <strong>and</strong> <strong>the</strong> resulting health savings (provided for <strong>the</strong> BRT+ATC scenario in <strong>the</strong> next<br />
section) may also be an optimistic estimate.<br />
Using <strong>the</strong> estimated PM emissions savings as stated in <strong>the</strong> Pre-feasibility Report (ITP, 2010), health savings<br />
from BRT+ATC scenario was estimated. Road density (80%) <strong>and</strong> ATC location density (20%) were considered<br />
in distributing <strong>the</strong> PM savings to <strong>the</strong> grids. The BRT+ATC scenario would result in health benefits amounting<br />
to US$2,181 million for <strong>the</strong> duration <strong>of</strong> <strong>the</strong> appraisal period <strong>of</strong> 2012 to 2035 <strong>and</strong> US$87 million in year 2020.<br />
The results are provided in <strong>the</strong> tables below (Tables 22 <strong>and</strong> 23).<br />
Table 22. <strong>Health</strong> benefits – BRT+ATC SCENARIO (Appraisal Period <strong>of</strong> 2012-2035)<br />
Summary <strong>Health</strong> Savings cost/unit (peso) Total savings<br />
(mil PHP)<br />
Premature mortality 11,751 1,880,000 22,092<br />
Adult Chronic Bronchitis 71,549 50,000 3,577<br />
Child Acute Bronchitis 523,960 20,000 10,479<br />
Respiratory Hospital Admission 21,465<br />
2,000<br />
43<br />
Cardiac Hospital Admission 8,944 500,000 4,472<br />
Emergency Room Visit 420,352<br />
4,000 1,681<br />
Asthma Attacks 5,187,317<br />
1,000 5,187<br />
Restricted Activity Days 68,472,579<br />
500 34,236<br />
Respiratory Symptom Days 327,337,565<br />
30 9,820<br />
91,588 mil PHP<br />
Emission reductions (tons) 2,181 mil US$<br />
Total PM10 9655<br />
Total PM2.5 9655<br />
Total SO2 0<br />
Total NOx 0<br />
61
<strong>Environmental</strong> <strong>and</strong> <strong>Health</strong> <strong>Benefits</strong> <strong>of</strong> <strong>the</strong> <strong>Cebu</strong> City BRT: Final Report<br />
Table 23. <strong>Health</strong> benefits –BRT+ATC (Year 2020)<br />
Summary <strong>Health</strong> Savings cost/unit (peso) Total savings<br />
(mil PHP)<br />
Premature mortality 466 1,880,000 876<br />
Adult Chronic Bronchitis 2,860 50,000 143<br />
Child Acute Bronchitis 20,948 20,000 419<br />
Respiratory Hospital Admission 858<br />
2,000<br />
2<br />
Cardiac Hospital Admission 358 500,000 179<br />
Emergency Room Visit 16,805<br />
4,000<br />
67<br />
Asthma Attacks 207,385<br />
1,000 207<br />
Restricted Activity Days 2,737,485<br />
500 1,369<br />
Respiratory Symptom Days 13,086,722<br />
30 393<br />
3,654 mil PHP<br />
Emission reductions (tons) 87 mil US$<br />
Total PM10 386<br />
Total PM2.5 386<br />
Total SO2 0<br />
Total NOx 0<br />
62
6. COMMUNICATING BENEFITS OF THE CEBU BRT<br />
<strong>Environmental</strong> <strong>and</strong> <strong>Health</strong> <strong>Benefits</strong> <strong>of</strong> <strong>the</strong> <strong>Cebu</strong> City BRT: Final Report<br />
Communication <strong>of</strong> <strong>the</strong> benefits from <strong>the</strong> proposed <strong>Cebu</strong> BRT project is important to ensure acceptance by<br />
<strong>the</strong> public <strong>and</strong> <strong>the</strong> sectors that will be directly <strong>and</strong> indirectly affected by it. From <strong>the</strong> pre-feasibility <strong>and</strong><br />
throughout <strong>the</strong> feasibility studies, consultations <strong>and</strong> communications activities on <strong>the</strong> <strong>Cebu</strong> BRT project were<br />
conducted.<br />
ITP conducted focus group discussions <strong>and</strong> carried out an ethnographic study in 2009 as part <strong>of</strong> <strong>the</strong> prefeasibility<br />
study. Two priority issues were identified by transport users in <strong>Cebu</strong> City: safety <strong>and</strong> comfort. <strong>Air</strong><br />
quality was one <strong>of</strong> <strong>the</strong> comfort-related issues cited by participants. The ethnographic study confirmed that air<br />
quality is poor around intersections within <strong>the</strong> central business district. According to <strong>the</strong> Pre-Feasibility Study<br />
(ITP, 2010), “Some passengers try to negate <strong>the</strong> pollution by covering <strong>the</strong>ir nose <strong>and</strong> mouth with a<br />
h<strong>and</strong>kerchief or tissue” <strong>and</strong> “<strong>Air</strong> pollution was particularly unpleasant in <strong>the</strong> Downtown area close to<br />
intersections where <strong>the</strong>re are <strong>of</strong>ten many idling engines, <strong>and</strong> many belonging to Jeepneys. It was notable<br />
from riding Jeepneys <strong>and</strong> from walking around <strong>the</strong> downtown area that around signalled intersections where<br />
traffic would wait for up to three minutes, <strong>the</strong> pollution was at times overwhelming.”<br />
As part <strong>of</strong> its <strong>Cebu</strong> BRT Feasibility Study (ITP, 2012), ITP implemented a Communications <strong>and</strong> Consultation<br />
Plan within an overall framework coordinated by <strong>the</strong> <strong>Cebu</strong> City Government BRT Communications Team. 34<br />
The main activities <strong>of</strong> <strong>the</strong> Plan were:<br />
• Consultations to raise awareness <strong>of</strong> <strong>Cebu</strong> City BRT <strong>and</strong> get feedback from potential users <strong>and</strong> key<br />
stakeholders on <strong>the</strong>ir travel needs; facilitate development <strong>of</strong> <strong>Cebu</strong> BRT br<strong>and</strong>; <strong>and</strong> get feedback on<br />
BRT outline design principles <strong>and</strong> potential social <strong>and</strong> environmental impact <strong>of</strong> <strong>the</strong> proposed BRT<br />
• Communications by implementing a communications protocol to ensure consistency <strong>of</strong> key<br />
messages from <strong>the</strong> <strong>Cebu</strong> BRT Feasibility Study <strong>and</strong> to define <strong>the</strong> role <strong>of</strong> different parties; releasing<br />
key information at appropriate times during <strong>the</strong> study during press briefings <strong>and</strong> press conferences;<br />
developing tools such as study website, social media, posters, flyers, promotional materials (e.g.,<br />
fans, t-shirts, badges, bags); holding an exhibition <strong>of</strong> <strong>the</strong> <strong>Cebu</strong> BRT (br<strong>and</strong>ed as Trans<strong>Cebu</strong>)<br />
Since air quality is considered a key concern among <strong>Cebu</strong> City public transport users, <strong>the</strong> dissemination <strong>of</strong> <strong>the</strong><br />
results <strong>of</strong> this Report on <strong>the</strong> environmental <strong>and</strong> health benefits <strong>of</strong> <strong>the</strong> proposed <strong>Cebu</strong> BRT would convey a<br />
clear <strong>and</strong> strong message that <strong>the</strong> key proponents <strong>of</strong> this project – <strong>Cebu</strong> City Government <strong>and</strong> Department <strong>of</strong><br />
Transportation <strong>and</strong> Communication – are determined to address <strong>the</strong> issue <strong>of</strong> air pollution from <strong>the</strong> transport<br />
sector in <strong>Cebu</strong> City.<br />
In light <strong>of</strong> <strong>the</strong> above, it is recommended that communication <strong>of</strong> <strong>the</strong> environmental <strong>and</strong> health benefits from<br />
<strong>the</strong> <strong>Cebu</strong> BRT be included as an additional priority item in <strong>the</strong> Consultation <strong>and</strong> Communications Plan still to<br />
34 The <strong>Cebu</strong> City Government BRT Communications Team comprises <strong>of</strong> representatives from: Public Information<br />
Office, Division for <strong>the</strong> Welfare <strong>of</strong> <strong>the</strong> Urban Poor (DWUP), Squatters Prevention Encroachment <strong>and</strong> Elimination<br />
Division (SPEED), <strong>Cebu</strong> City Traffic Operations Management (CITOM), City Planning <strong>and</strong> Development Office<br />
(CPDO), Department <strong>of</strong> Engineering <strong>and</strong> Public Works (DEPW), City Disaster Office, City Administrator’s Office, <strong>and</strong><br />
<strong>Cebu</strong> Investment Promotions Center (CIPC)<br />
63
<strong>Environmental</strong> <strong>and</strong> <strong>Health</strong> <strong>Benefits</strong> <strong>of</strong> <strong>the</strong> <strong>Cebu</strong> City BRT: Final Report<br />
be revised or updated as indicated in <strong>the</strong> recommendations in <strong>the</strong> Feasibility Report (2012) on<br />
communications (rephrased here):<br />
• For DOTC <strong>and</strong> <strong>Cebu</strong> City Government to take <strong>the</strong> lead in <strong>the</strong> continued consultations <strong>and</strong><br />
communications during <strong>the</strong> detailed engineering design phase <strong>and</strong> <strong>the</strong> next phases<br />
• To revise or update <strong>the</strong> communications <strong>and</strong> consultation plan prioritizing:<br />
o Focused consultation with <strong>the</strong> public transport industry<br />
o Investors’ conference to engage <strong>the</strong> private sector<br />
o Communications support to project implementation activities especially where <strong>the</strong>se impact<br />
<strong>the</strong> public<br />
o Sustained information <strong>and</strong> education activities with key stakeholders<br />
o Sustained mass media campaign management (mainstream <strong>and</strong> social media channels)<br />
The target audience for <strong>the</strong> message on environmental <strong>and</strong> health benefits would be <strong>the</strong> general public <strong>and</strong><br />
particularly public transport users.<br />
An important sector to partner with in delivering this message would be medical doctors (particularly<br />
pulmonologists, cardiologist <strong>and</strong> oncologists who deal with respiratory <strong>and</strong> cardiovascular diseases <strong>and</strong> lung<br />
cancers; <strong>and</strong> industrial or occupational medicine practitioners). The <strong>Cebu</strong> City <strong>Health</strong> Office should be invited<br />
to lead this effort. Partners from <strong>the</strong> Philippine College <strong>of</strong> Chest Physicians (PCCP)-Central Visayas Chapter<br />
have expressed <strong>the</strong>ir willingness to serve as speakers in workshops <strong>and</strong> forums to convey <strong>the</strong> health impacts<br />
<strong>of</strong> air pollution <strong>and</strong> to respond to questions from <strong>the</strong> public (e.g., on facebook <strong>and</strong> o<strong>the</strong>r social media)<br />
regarding this topic.<br />
Important key messages to convey in mass media campaigns are <strong>the</strong> alarming air quality levels found along<br />
<strong>the</strong> BRT corridor <strong>and</strong> <strong>the</strong> environmental <strong>and</strong> health benefits <strong>of</strong> <strong>the</strong> <strong>Cebu</strong> BRT system.<br />
There are several occasions when <strong>the</strong>se messages could be disseminated, including during:<br />
o Annual Philippine College <strong>of</strong> Chest Physicians-Central Visayas conference<br />
o Annual November <strong>Clean</strong> <strong>Air</strong> Month activities led by <strong>the</strong> EMB-7 <strong>and</strong> <strong>the</strong> airshed governing board<br />
o Annual World Spirometry Day event celebrated by PCCP-Central Visayas in <strong>Cebu</strong> City<br />
64
REFERENCES<br />
<strong>Environmental</strong> <strong>and</strong> <strong>Health</strong> <strong>Benefits</strong> <strong>of</strong> <strong>the</strong> <strong>Cebu</strong> City BRT: Final Report<br />
ADB <strong>and</strong> CAI-Asia. 2009. Transport <strong>and</strong> Carbon Dioxide Emissions: Forecasts, Options Analysis, <strong>and</strong><br />
Evaluation. Available: http://cleanairinitiative.org/portal/sites/default/files/documents/ADB-WP09-<br />
Transport-CO2-Emissions.pdf<br />
ADB, 2010a.Reducing Carbon Emissions from Transport Projects. Independent Evaluation Study. Available:<br />
http://www.adb.org/documents/reducing-carbon-emissions-transport-projects<br />
ADB, 2010b.Methodology for Estimating Carbon Footprint <strong>of</strong> Road Projects: Case Study: India. Available:<br />
HYPERLINK "http://www.adb.org/publications/methodology-estimating-carbon-footprint-road-projects-<br />
case-study-india"http://www.adb.org/publications/methodology-estimating-carbon-footprint-road-projectscase-study-india<br />
Arndt, R.L., Carmichael, G.R., Roorda, J.M., 1998. Seasonal source-receptor relationships in Asia. Atmospheric<br />
Environment 32, 1397-1406.<br />
Calori, G., Carmichael, G.R., 1999. An urban trajectory model for sulfur in Asian megacities: model concepts<br />
<strong>and</strong> preliminary application. Atmospheric Environment 33, 3109-3117.<br />
Guttikunda, S.K., Thongboonchoo, N., Arndt, R.L., Calori, G., Carmichael, G.R., Streets, D.G., 2001. Sulfur<br />
deposition in Asia: Seasonal behavior <strong>and</strong> contributions from various energy sectors. Water <strong>Air</strong> <strong>and</strong> Soil<br />
Pollution 131, 383-406.<br />
Guttikunda, S.K., Carmichael, G.R., Calori, G., Eck, C., Woo, J.-H., 2003. The contribution <strong>of</strong> megacities to<br />
regional sulfur pollution in Asia. Atmospheric Environment 37, 11-22.<br />
Guttikunda, S.K., 2008a. Four Equations for Vehicular Emissions Inventory, in: UrbanEmissions.Info (Ed.), SIMair<br />
Working Paper Series, No. 06-2008, New Delhi, India.<br />
Guttikunda, S.K., 2008b. Estimating <strong>Health</strong> Impacts <strong>of</strong> Urban <strong>Air</strong> Pollution, in: UrbanEmissions.Info (Ed.), SIMair<br />
Working Paper Series, No. 06-2008, New Delhi, India.<br />
Guttikunda, S., Gurjar, B., 2011.Role <strong>of</strong> meteorology in seasonality <strong>of</strong> air pollution in megacity Delhi, India.<br />
<strong>Environmental</strong> Monitoring <strong>and</strong> Assessment, 1-13.<br />
HEI, 2004. <strong>Health</strong> Effects <strong>of</strong> Outdoor <strong>Air</strong> Pollution in Developing Countries <strong>of</strong> Asia: A Literature Review,<br />
Special Report 15, <strong>Health</strong> Effects Institute, Boston, USA.<br />
HEI, 2010. Outdoor <strong>Air</strong> Pollution <strong>and</strong> <strong>Health</strong> in <strong>the</strong> Developing Countries <strong>of</strong> Asia: A Comprehensive Review,<br />
Special Report 18, <strong>Health</strong> Effects Institute, Boston, USA.<br />
Heffter, J.L., 1983. Branching atmospheric trajectory (BAT) model, NOAA Tech. Memo. ERL ARL-121, <strong>Air</strong><br />
Resources Laboratory, Rockville, MD USA.<br />
Holloway, T., Levy Ii, H., Carmichael, G., 2002. Transfer <strong>of</strong> reactive nitrogen in Asia: development <strong>and</strong><br />
evaluation <strong>of</strong> a source-receptor model. Atmospheric Environment 36, 4251-4264.<br />
65
<strong>Environmental</strong> <strong>and</strong> <strong>Health</strong> <strong>Benefits</strong> <strong>of</strong> <strong>the</strong> <strong>Cebu</strong> City BRT: Final Report<br />
ITP, 2010. Study <strong>and</strong> Concept Plan for a Demonstration Bus Rapid Transit Corridor (Final Report v1) (also<br />
referred to as Pre-Feasibility Study)<br />
ITP, 2012. <strong>Cebu</strong> City Urban Transport Greenhouse Gas Emissions Study (Final Report)<br />
ITP, 2012. <strong>Cebu</strong> BRT Feasibility Study (Draft Final Report)<br />
Jinsart, W.; Sripraparkorn, C.; Siems, S. T.; et al.(2010). Application <strong>of</strong> The <strong>Air</strong> Pollution Model (TAPM) to <strong>the</strong><br />
urban airshed <strong>of</strong> Bangkok, Thail<strong>and</strong>, INTERNATIONAL JOURNAL OF ENVIRONMENT AND POLLUTION, 42: 68-<br />
84 2010<br />
Kalnay, E., Kanamitsu, M., Kistler, R., Collins, W., Deaven, D., G<strong>and</strong>in, L., Iredell, M., Saha, S., White, G.,<br />
Woollen, J., Zhu, Y., Leetmaa, A., Reynolds, R., Chelliah, M., Ebisuzaki, W., Higgins, W., Janowiak, J., Mo, K.C.,<br />
Ropelewski, C., Wang, J., Jenne, R., Joseph, D., 1996. The NCEP/NCAR 40-Year Reanalysis Project. Bulletin <strong>of</strong><br />
<strong>the</strong> American Meteorological Society 77, 437-471.<br />
Kan, H., Chen, B., Chen, C., Fu, Q., Chen, M., 2004. An evaluation <strong>of</strong> public health impact <strong>of</strong> ambient air<br />
pollution under various energy scenarios in Shanghai, China. Atmospheric Environment 38, 95-102.<br />
Oh, In-Bo; Kim, Yoo-Keun; Hwang, Mi-Kyung; et al., (2010). Elevated Ozone Layers over <strong>the</strong> Seoul<br />
Metropolitan Region in Korea: Evidence for Long-Range Ozone Transport from Eastern China <strong>and</strong> Its<br />
Contribution to Surface Concentrations. JOURNAL OF APPLIED METEOROLOGY AND CLIMATOLOGY,49:203-<br />
220.<br />
Schipper, el al. (2009). Considering Climate Change in Latin American <strong>and</strong> Caribbean Urban Transportation:<br />
Concepts, Applications, <strong>and</strong> Cases. Available: http://metrostudies.berkeley.edu/pubs/reports/Shipper-<br />
ConsidClimateChange-LatinAmer.pdf<br />
Streets, D.G., Guttikunda, S.K., Carmichael, G.R., 2000. The growing contribution <strong>of</strong> sulfur emissions from<br />
ships in Asian waters, 1988-1995. Atmospheric Environment 34, 4425-4439.<br />
Tao, Yebin; Zhong, Liuju; Huang, Xiaoliang; et al.(2011), Acute mortality effects <strong>of</strong> carbon monoxide in <strong>the</strong><br />
Pearl River Delta <strong>of</strong> China, SCIENCE OF THE TOTAL ENVIRONMENT, 410: 34-40<br />
Wang, T. <strong>and</strong> Xie, S. (2009). Assessment <strong>of</strong> Traffic-related <strong>Air</strong> Pollution in <strong>the</strong> Urban Streets before <strong>and</strong> during<br />
<strong>the</strong> 2008 Beijing Olympic Games Traffic Control Period. Atmospheric Environment, 43: 5682–5690.<br />
World Bank, 2002. Philippines Environment Monitor: <strong>Air</strong> Quality. Available:<br />
http://go.worldbank.org/BGE1VX9MT0<br />
66
ANNEX A. Bus Maintenance<br />
<strong>Environmental</strong> <strong>and</strong> <strong>Health</strong> <strong>Benefits</strong> <strong>of</strong> <strong>the</strong> <strong>Cebu</strong> City BRT: Final Report<br />
Fuel efficiency <strong>of</strong> buses deteriorates without proper maintenance. Implementing good maintenance practices<br />
by transit agencies could lead to improved fuel efficiency, reduced emissions <strong>and</strong> improved performance<br />
(fewer breakdowns). Various reports 35 have documented <strong>the</strong> impact <strong>of</strong> bus maintenance <strong>and</strong> driver training<br />
on fuel consumption. Some even suggest that advancing good maintenance practices to ensure peak<br />
performance <strong>of</strong> <strong>the</strong> bus fleet may be <strong>the</strong> most cost effective greenhouse gas (GHG) mitigation action a transit<br />
agency can take. Literature review suggests that <strong>the</strong> impact <strong>of</strong> bus maintenance <strong>and</strong> driver training can be as<br />
high as 20%.<br />
Bus maintenance is now considered as a foundation <strong>of</strong> <strong>Clean</strong> Fleet Management strategies. A systematic<br />
approach to clean fleet management will ensure that improvements do not stop with one-<strong>of</strong>f measures but<br />
will be sustained. In practice it has been observed that fleets <strong>of</strong>ten start with low-cost measures such as<br />
driver training <strong>and</strong> better maintenance, <strong>of</strong>ten resulting in 20% or higher fuel savings, before moving to more<br />
expensive measures, such as installing new technologies.<br />
Potential <strong>Benefits</strong> for <strong>Clean</strong> Fleet Management for Bus Fleets<br />
1. Reduced fuel use, CO2 <strong>and</strong> air pollutant emissions<br />
2. Financial savings not only in replacement <strong>of</strong> parts but also in fuel costs. The combined savings will<br />
lead to greater financial flexibility for expansion <strong>of</strong> <strong>the</strong> fleet, incentives to staff <strong>and</strong> promotion <strong>and</strong><br />
support for o<strong>the</strong>r projects like BRTS, ITS, which can garner more ridership <strong>and</strong> make public transport<br />
attractive.<br />
3. Greater ridership, reducing <strong>the</strong> number <strong>of</strong> private motor vehicles on <strong>the</strong> roads <strong>and</strong> increasing <strong>the</strong> bus<br />
speed.<br />
4. Improved image <strong>of</strong> <strong>the</strong> bus industry i.e. black smoke coming out <strong>of</strong> a bus is a commonly used<br />
example for air pollution. Under a national program, a media campaign could be launched to change<br />
<strong>the</strong> perception <strong>of</strong> people from ‘dirty buses’ to ‘green buses’.<br />
5. Improved safety as eco-driving has been shown to also improve safer driving<br />
6. Potential for replication to o<strong>the</strong>r vehicle fleets, such as trucks, taxes <strong>and</strong> corporate fleets<br />
7. Capacity building among fleet managers <strong>and</strong> mechanics to give <strong>the</strong>m best practices’ knowledge <strong>and</strong><br />
optimize <strong>the</strong>ir operations.<br />
One <strong>of</strong> <strong>the</strong> best case studies available on Bus maintenance in Asia is <strong>the</strong> <strong>Clean</strong> <strong>Air</strong> Project Jakarta (CAP) 36 . The<br />
conclusions <strong>of</strong> <strong>the</strong> project are very interesting <strong>and</strong> are applicable for <strong>Cebu</strong> City.<br />
1. The exhaust gas emissions <strong>of</strong> participating buses were improved. The average reduction <strong>of</strong> opacity<br />
was 22.1%, Bosch-Value was 41.6% <strong>and</strong> fuel consumption was 10%.<br />
2. The efficiency was improved, since <strong>the</strong> only service required was low emissions maintenance.<br />
35 Current Practices <strong>of</strong> Greenhouse Gas Emissions Savings from Transit- TCRP Syn<strong>the</strong>sis, The Route to Carbon <strong>and</strong><br />
Energy Savings, Guidance Note – Best Operational <strong>and</strong> Maintenance Practices for City Bus Fleets to Maximize Fuel<br />
Economy<br />
36 <strong>Clean</strong> Bus Program – Project Implementation Report – Swisscontact Indonesia<br />
67
<strong>Environmental</strong> <strong>and</strong> <strong>Health</strong> <strong>Benefits</strong> <strong>of</strong> <strong>the</strong> <strong>Cebu</strong> City BRT: Final Report<br />
3. By adopting CAP’s maintenance procedure, required operation costs were decreasing.<br />
4. Checks on engines before <strong>and</strong> after I/M systems were implemented, proved that engine conditions<br />
improved once <strong>the</strong> systems were installed.<br />
5. Technicians’ knowledge in carrying out bus Inspection <strong>and</strong> Maintenance was improved.<br />
6. Only strong commitment from partners could lead to cooperation success; clear formulation <strong>of</strong> cooperation<br />
would assure smooth operation. Partner’s organization structure had to be clear.<br />
7. Pilot emission reduction actions were able to directly influence air quality.<br />
8. CAP’s program helped bus companies in improving <strong>the</strong>ir I/M systems <strong>and</strong> increasing <strong>the</strong>ir long-term<br />
pr<strong>of</strong>its.<br />
9. CAP attempted to engage in partnership <strong>and</strong> association with <strong>the</strong> Association <strong>of</strong> Transport<br />
Companies, ORGANDA, but without financial incentives <strong>the</strong>y were uninterested.<br />
10. Bus manufacturers’ involvements in designing <strong>and</strong> conducting training were highly beneficial <strong>and</strong><br />
highly recommended.<br />
11. Customer indirect involvement in <strong>the</strong> co-operation was motivating bus operators to carry out regular<br />
maintenance.<br />
Steps to Implement Fuel Efficiency Improvements in <strong>the</strong> fleet 37<br />
1. Management commitment <strong>and</strong> ownership. The technical support plan must be owned by <strong>the</strong> city<br />
transit agency so that its implementation is undertaken in a coordinated manner.<br />
a. Appoint a senior executive in charge <strong>of</strong> fleet fuel economy <strong>and</strong> some part <strong>of</strong> his/her bonus to<br />
meeting fuel economy goals<br />
b. Benchmark <strong>and</strong> set appropriate fuel economy goals by bus type for each year<br />
c. Communicate <strong>the</strong> fuel economy results achieved each year to both employees <strong>and</strong> <strong>the</strong> public<br />
<strong>and</strong> create a environment friendly br<strong>and</strong><br />
d. Develop policy strategy to improve speed, replace old bus(scrap) <strong>and</strong> reduce idling <strong>and</strong><br />
emissions<br />
2. Data collection <strong>and</strong> analysis. Technical support interventions should be determined by benchmarks,<br />
targets <strong>and</strong> measurement <strong>of</strong> fuel economy indicators.<br />
a. Automate data collection process to <strong>the</strong> extent feasible <strong>and</strong> use analysis s<strong>of</strong>tware to support<br />
maintenance<br />
b. Set up data QA/QC procedures<br />
c. Analyze <strong>the</strong> data for separating <strong>the</strong> effects <strong>of</strong> driver, route <strong>and</strong> bus related effects on fuel<br />
economy<br />
d. GPS/Black Box to collect data on driver behavior <strong>and</strong> infrastructure routing<br />
e. Use data to refine periodic maintenance<br />
37 Modified from Guidance Note – Best Operational <strong>and</strong> Maintenance Practices for City Bus Fleets to Maximize Fuel<br />
Economy- http://www.esmap.org/esmap/sites/esmap.org/files/FINAL_EECI-BusGuideNote_BN010-11.pdf<br />
68
<strong>Environmental</strong> <strong>and</strong> <strong>Health</strong> <strong>Benefits</strong> <strong>of</strong> <strong>the</strong> <strong>Cebu</strong> City BRT: Final Report<br />
3. Maintenance directed at low fuel economy buses. Technical support interventions should be<br />
focused on <strong>the</strong> 10 percent <strong>of</strong> <strong>the</strong> fleet showing <strong>the</strong> lowest fuel economy, <strong>and</strong> underperforming buses<br />
should undergo proper O&M practices <strong>and</strong> quality assurance <strong>of</strong> repairs.<br />
a. Select at least 10 percent <strong>of</strong> <strong>the</strong> fleet showing <strong>the</strong> lowest fuel economy <strong>and</strong> conduct simple<br />
checks at depot<br />
b. Conduct detailed checks at central facility if bus passes simple check find out <strong>the</strong> issues<br />
c. Compare pre-repair <strong>and</strong> post-repair fuel economy data on <strong>the</strong>se buses to estimate program<br />
benefits<br />
d. Check repair quality on a r<strong>and</strong>om <strong>and</strong> periodic basis<br />
e. Obtain mechanic sign-<strong>of</strong>f on repairs for traceability<br />
f. Conduct independent team audit <strong>of</strong> repairs across depots<br />
g. Retrain mechanics <strong>and</strong> update repair procedures periodically<br />
4. Training directed at low-performing drivers. On-road <strong>and</strong> classroom training with a trained<br />
instructor is required to improve overall driving quality.<br />
a. Train drivers in fuel-efficient driving techniques <strong>and</strong> periodically retrain <strong>the</strong>m<br />
b. Select at least 10 percent <strong>of</strong> drivers with <strong>the</strong> lowest fuel efficiency <strong>and</strong> conduct special<br />
additional training<br />
5. Employee communications <strong>and</strong> rewards. The operator should periodically communicate efficiency<br />
results <strong>and</strong> give incentives to employees to create a culture <strong>of</strong> fuel economy.<br />
a. Publicly display <strong>the</strong> fuel economy performance by driver <strong>and</strong> bus depot to employees<br />
b. Reward mechanics at <strong>the</strong> depot level <strong>and</strong> drivers individually for exceeding targets<br />
69
<strong>Environmental</strong> <strong>and</strong> <strong>Health</strong> <strong>Benefits</strong> <strong>of</strong> <strong>the</strong> <strong>Cebu</strong> City BRT: Final Report<br />
ANNEX B. Simplified Atmospheric Transport Modelling System<br />
(ATMoS-4.0) for <strong>the</strong> SIM-air tool<br />
[see separate .pdf file]<br />
70
<strong>Environmental</strong> <strong>and</strong> <strong>Health</strong> <strong>Benefits</strong> <strong>of</strong> <strong>the</strong> <strong>Cebu</strong> City BRT: Final Report<br />
ANNEX C. Summary <strong>of</strong> Meteorological Fields over <strong>Cebu</strong> City<br />
Data extracted from NCEP reanalysis fields available at 6 hour intervals<br />
Wind speed <strong>and</strong> Wind Direction by month<br />
270<br />
270<br />
270<br />
270<br />
315<br />
225<br />
315<br />
225<br />
315<br />
225<br />
315<br />
225<br />
January<br />
0<br />
180<br />
45<br />
0% 20% 40% 60%<br />
April<br />
0<br />
135<br />
45<br />
0% 10% 20% 30% 40% 50%<br />
180<br />
July<br />
0<br />
135<br />
45<br />
0% 5% 10% 15% 20% 25%<br />
180<br />
October<br />
0<br />
135<br />
45<br />
0% 10% 20% 30%<br />
180<br />
135<br />
90<br />
90<br />
90<br />
90<br />
2 - 4<br />
>4 - 6<br />
>6 - 8<br />
>8 - 10<br />
>10<br />
2 - 4<br />
>4 - 6<br />
>6 - 8<br />
>8 - 10<br />
>10<br />
2 - 4<br />
>4 - 6<br />
>6 - 8<br />
>8 - 10<br />
>10<br />
2 - 4<br />
>4 - 6<br />
>6 - 8<br />
>8 - 10<br />
>10<br />
270<br />
270<br />
270<br />
270<br />
315<br />
225<br />
315<br />
225<br />
315<br />
225<br />
315<br />
225<br />
February<br />
0<br />
180<br />
45<br />
0% 20% 40% 60% 80%<br />
May<br />
0<br />
180<br />
135<br />
45<br />
0% 5% 10% 15% 20% 25%<br />
August<br />
0<br />
135<br />
45<br />
0% 4% 8% 12% 16% 20%<br />
180<br />
November<br />
0<br />
135<br />
45<br />
0% 10% 20% 30% 40% 50%<br />
180<br />
135<br />
90<br />
90<br />
90<br />
90<br />
2 - 4<br />
>4 - 6<br />
>6 - 8<br />
>8 - 10<br />
>10<br />
2 - 4<br />
>4 - 6<br />
>6 - 8<br />
>8 - 10<br />
>10<br />
2 - 4<br />
>4 - 6<br />
>6 - 8<br />
>8 - 10<br />
>10<br />
2 - 4<br />
>4 - 6<br />
>6 - 8<br />
>8 - 10<br />
>10<br />
270<br />
270<br />
270<br />
270<br />
315<br />
225<br />
315<br />
225<br />
315<br />
225<br />
315<br />
225<br />
March<br />
0<br />
180<br />
45<br />
0% 20% 40% 60% 80%<br />
June<br />
0<br />
180<br />
135<br />
45<br />
0% 10% 20% 30% 40%<br />
September<br />
0<br />
180<br />
135<br />
45<br />
0% 4% 8% 12% 16% 20%<br />
December<br />
0<br />
135<br />
45<br />
0% 20% 40% 60%<br />
180<br />
135<br />
90<br />
90<br />
90<br />
90<br />
2 - 4<br />
>4 - 6<br />
>6 - 8<br />
>8 - 10<br />
>10<br />
2 - 4<br />
>4 - 6<br />
>6 - 8<br />
>8 - 10<br />
>10<br />
2 - 4<br />
>4 - 6<br />
>6 - 8<br />
>8 - 10<br />
>10<br />
2 - 4<br />
>4 - 6<br />
>6 - 8<br />
>8 - 10<br />
>10<br />
71
Total precipitation by month<br />
Mixing layer height<br />
<strong>Environmental</strong> <strong>and</strong> <strong>Health</strong> <strong>Benefits</strong> <strong>of</strong> <strong>the</strong> <strong>Cebu</strong> City BRT: Final Report<br />
This data is critical for calculating emissions mixing rate over <strong>the</strong> region<br />
72
<strong>Environmental</strong> <strong>and</strong> <strong>Health</strong> <strong>Benefits</strong> <strong>of</strong> <strong>the</strong> <strong>Cebu</strong> City BRT: Final Report<br />
Example images from <strong>the</strong> MS Excel-based SIM-air analysis system for <strong>Cebu</strong> City<br />
Gridded population database<br />
Comparison <strong>of</strong> concentrations<br />
(baseline vs. scenario)<br />
Gridded concentration calculations<br />
Summary sheet <strong>of</strong> results<br />
(reductions <strong>and</strong> health benefits)<br />
73