Open-Data for Low Emission Development (in ... - Clean Air Initiative
Open-Data for Low Emission Development (in ... - Clean Air Initiative
Open-Data for Low Emission Development (in ... - Clean Air Initiative

You also want an ePaper? Increase the reach of your titles
YUMPU automatically turns print PDFs into web optimized ePapers that Google loves.
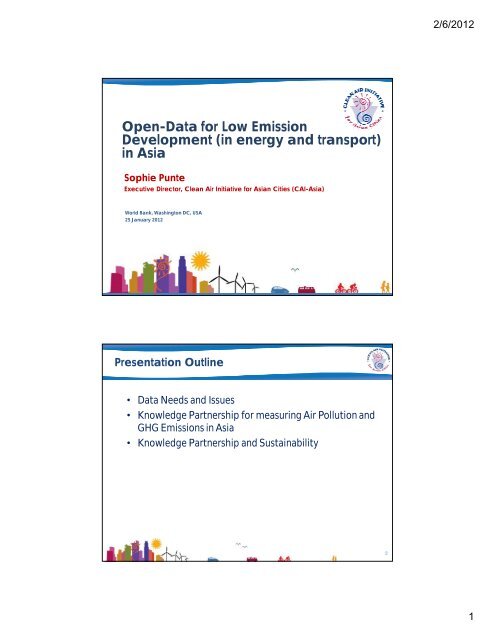
<strong>Open</strong>-<strong>Data</strong> <strong>for</strong> <strong>Low</strong> <strong>Emission</strong><br />
<strong>Development</strong> (<strong>in</strong> energy and transport)<br />
<strong>in</strong> Asia<br />
Sophie Punte<br />
Executive Director, <strong>Clean</strong> <strong>Air</strong> <strong>Initiative</strong> <strong>for</strong> Asian Cities (CAI-Asia)<br />
World Bank, Wash<strong>in</strong>gton DC, USA<br />
25 January 2012<br />
Presentation Outl<strong>in</strong>e<br />
• <strong>Data</strong> Needs and Issues<br />
• Knowledge Partnership <strong>for</strong> measur<strong>in</strong>g <strong>Air</strong> Pollution and<br />
GHG <strong>Emission</strong>s <strong>in</strong> Asia<br />
• Knowledge Partnership and Susta<strong>in</strong>ability<br />
2<br />
2/6/2012<br />
1
Why we need data?<br />
Investments<br />
<strong>in</strong>clud<strong>in</strong>g<br />
development<br />
<strong>in</strong>terventions<br />
<strong>Low</strong> <strong>Emission</strong>s <strong>Development</strong><br />
<strong>Data</strong><br />
<strong>Data</strong> <strong>for</strong><br />
estimat<strong>in</strong>g<br />
emissions<br />
<strong>Data</strong> needs <strong>for</strong> different purposes<br />
Rout<strong>in</strong>ely monitored<br />
Budget<br />
Policies, Plans,<br />
Regulations<br />
On demand Adhoc<br />
CAI-Asia, 2010<br />
3<br />
2/6/2012<br />
2
Million tons CO2<br />
High variability <strong>in</strong> <strong>Emission</strong>s data<br />
2500<br />
2000<br />
1500<br />
1000<br />
500<br />
0<br />
2005<br />
estimates vary<br />
from 98 to 216<br />
million tons<br />
1980 1990 2000 2010 2020 2030 2040 2050 2060<br />
India transport CO2 emissions estimates and BAU <strong>for</strong>ecast<br />
by different <strong>in</strong>stitutions and publications (e.g. TERI, IEA, WRI, CAI-Asia)<br />
Gota.S. (to be published). Crunch<strong>in</strong>g Numbers<br />
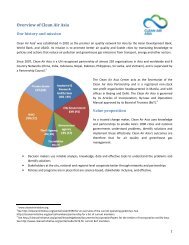
About CAI-Asia: Who we are<br />
www.cleanair<strong>in</strong>itiative.org<br />
CAI-Asia promotes better air quality and livable cities by translat<strong>in</strong>g<br />
knowledge to policies and actions that reduce air pollution and<br />
greenhouse gas emissions from transport, energy and other sectors.<br />
CAI-Asia was established as the premier air quality network <strong>for</strong> Asia<br />
by the Asian <strong>Development</strong> Bank, World Bank and USAID <strong>in</strong> 2001, and<br />
operates s<strong>in</strong>ce 2007 as an <strong>in</strong>dependent non-profit organization.<br />
CAI-Asia us a UN recognized Partnership with more than 230<br />
organizational members and 8 Country Networks<br />
6<br />
5<br />
2/6/2012<br />
3
Government<br />
agencies<br />
About CAI-Asia<br />
www.cleanair<strong>in</strong>itiative.org<br />
CAI-Asia Partnership Members<br />
(231 organizational members as of December 2011)<br />
Ch<strong>in</strong>a<br />
Vietnam<br />
Sri Lanka<br />
NGOs, academic &<br />
research <strong>in</strong>stitutions<br />
What we do<br />
• Knowledge & & <strong>Data</strong> <strong>Data</strong><br />
• Tools & Assessments<br />
8 Country Networks<br />
Cities<br />
India<br />
CAI-Asia<br />
Center<br />
Philipp<strong>in</strong>es<br />
• Policy & Program Support<br />
• Network<strong>in</strong>g & Partnerships<br />
<strong>Development</strong><br />
agencies<br />
Indonesia<br />
Nepal<br />
Pakistan<br />
Private sector<br />
About CAI-Asia: How we work<br />
www.cleanair<strong>in</strong>itiative.org<br />
CAI-Asia Programs<br />
<strong>Air</strong> Quality and<br />
Climate Change<br />
<strong>Low</strong> <strong>Emission</strong>s Urban<br />
<strong>Development</strong><br />
<strong>Clean</strong> Fuels and Vehicles<br />
Green Freight and<br />
Logistics<br />
Input from partners<br />
Network of City Networks<br />
• Asian Cities Climate Change<br />
Resilience Network<br />
• Cities <strong>Development</strong> <strong>Initiative</strong> <strong>for</strong> Asia<br />
• CITYNET<br />
• Earthquakes and Megacities <strong>Initiative</strong><br />
• Global City Indicators Facility<br />
• Global Energy Network <strong>for</strong><br />
Susta<strong>in</strong>able Cities<br />
• ICLEI-Local Governments <strong>for</strong><br />
Susta<strong>in</strong>ability Southeast Asia<br />
Secretariat<br />
• Kitakyushu <strong>Initiative</strong> (IGES)<br />
• Metropolis<br />
• Susta<strong>in</strong>able Cities International<br />
• Susta<strong>in</strong>able Mobility & Accessibility<br />
Research & Trans<strong>for</strong>mation (SMART)<br />
• Union of Cities and Local<br />
Governments Asia Pacific (UCLG-<br />
ASPAC)<br />
• Urban Age Institute<br />
7<br />
What we aim <strong>for</strong><br />
Reduced air pollution<br />
and greenhouse gas<br />
emissions<br />
Improved health<br />
Energy sav<strong>in</strong>gs<br />
Livable cities<br />
8<br />
2/6/2012<br />
4
CAI-Asia Portal and Helpdesk<br />
CAI-Asia Portal and Helpdesk<br />
Participant<br />
CAI-Asia<br />
• Tools and assessments<br />
• Publications<br />
• <strong>Clean</strong> <strong>Air</strong> Mgt Profiles<br />
•Newsletters<br />
• Surveys<br />
• <strong>Data</strong> and <strong>in</strong>dicators<br />
• Helpdesk<br />
• Policies, Projects<br />
• Country profiles<br />
• Events<br />
www.cleanair<strong>in</strong>itiative.org<br />
Audience<br />
Feedback<br />
<strong>Clean</strong> <strong>Air</strong> Portal<br />
<strong>Clean</strong> <strong>Air</strong> Portal<br />
CAI-Asia Helpdesk :<br />
Over 500 queries <strong>in</strong> 2011<br />
<strong>Clean</strong> <strong>Air</strong> Portal with organizations, projects, policies, news, publications, tools, and events relevant to<br />
air quality, climate change, energy and transport<br />
CitiesACT database on air quality levels, CO 2 emissions, transport and energy data and <strong>in</strong>dicators <strong>for</strong> 250<br />
Asian cities and 22 countries. Users can search by location, topic, and create onl<strong>in</strong>e charts and figures<br />
<strong>Clean</strong> <strong>Air</strong> at Mega-Events website with <strong>in</strong><strong>for</strong>mation<br />
of past, present and future mega-events to guide<br />
future host cities on measures and strategies to<br />
improve clean air management <strong>in</strong> their cities<br />
www.cleanair<strong>in</strong>itiative.org<br />
Green Freight and Logistics website<br />
with <strong>in</strong><strong>for</strong>mation on policies and<br />
programs, technologies and logistics, and data<br />
relevant to the freight sector<br />
10<br />
9<br />
2/6/2012<br />
5
Knowledge Partnership <strong>for</strong><br />
measur<strong>in</strong>g <strong>Air</strong> Pollution and GHG<br />
<strong>Emission</strong>s <strong>in</strong> Asia<br />
2/6/2012<br />
Knowledge Partnership <strong>for</strong> measur<strong>in</strong>g <strong>Air</strong><br />
Pollution and GHG <strong>Emission</strong>s <strong>in</strong> Asia<br />
• Objective :<br />
– To help policy makers, development agencies and<br />
other stakeholders <strong>in</strong> Asia have better access to air<br />
pollution and GHG emissions data to further enrich<br />
policy development activities and development<br />
<strong>in</strong>terventions relevant to energy and transport<br />
sectors and urban development.<br />
• Scope: Road transport (national and city) and<br />
electricity generation (national)<br />
– Road Transport: CO2, NOx and PM emissions<br />
– Electricity generation: CO2, PM and SO2 emissions<br />
• Donor: 15% World Bank <strong>Development</strong> Grant Facility<br />
(DGF) and 85% leveraged through other donors<br />
• Duration: Nov 2009 -Dec 2012<br />
• TTL: Sameer Akbar (sakbar@worldbank.org)<br />
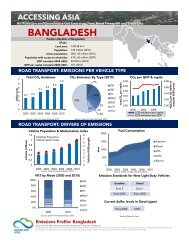
Bangladesh<br />
• Dhaka<br />
• Chittagong<br />
Ch<strong>in</strong>a<br />
• Beij<strong>in</strong>g<br />
• Shanghai<br />
India<br />
• Delhi<br />
• Bangalore<br />
Indonesia<br />
• Jakarta<br />
• Surabaya<br />
Lao PDR<br />
• Vientiane<br />
Mongolia<br />
• Ulaanbaatar<br />
11<br />
11<br />
Nepal<br />
• Kathmandu<br />
Pakistan<br />
• Islamabad<br />
• Karachi<br />
Philipp<strong>in</strong>es<br />
• Manila<br />
• Davao<br />
S<strong>in</strong>gapore<br />
Sri Lanka<br />
• Colombo<br />
• Kandy<br />
Thailand<br />
• Bangkok<br />
• Chiang Mai<br />
Vietnam<br />
• Hanoi<br />
• HCMC<br />
12<br />
2/6/2012<br />
6
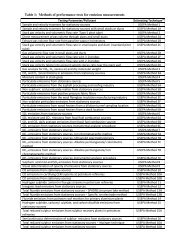
Steps and Outputs<br />
1. Select Indicators + Input Parameters (Long list)<br />
2. <strong>Data</strong> Mapp<strong>in</strong>g <strong>for</strong> Energy and Transport Input Parameters<br />
3. Select Indicators + Input Parameters (short list)<br />
4. Develop Guidel<strong>in</strong>es <strong>for</strong> development,<br />
measurement and use of GHG and AP Indicators<br />
5. <strong>Data</strong> collection of transport and energy <strong>in</strong>put<br />
parameters (<strong>in</strong>put data)<br />
Collection of<br />
available data<br />
Estimation <strong>for</strong><br />
unknown data<br />
6. Derive <strong>in</strong>dicators + 7. Review results<br />
8. Upload of data and Indicators <strong>in</strong> CitiesACT<br />
9. Benchmark<strong>in</strong>g Report<br />
10. Dissem<strong>in</strong>ation and Communication<br />
Launch at BAQ 2012<br />
1. Select Indicators + Input Parameters<br />
(Long list)<br />
• Purpose of Indicators<br />
• Describe the state of air<br />
pollution and GHG<br />
emissions <strong>in</strong> the transport<br />
and energy sectors<br />
• Assess and measure trends<br />
and tendencies aga<strong>in</strong>st a<br />
basel<strong>in</strong>e<br />
• Identify priority areas and<br />
track progress of actions<br />
• Selection Criteria<br />
Demand-driven<br />
Scientifically robust<br />
Measurable<br />
<strong>Data</strong> availability<br />
Representative<br />
Understandable<br />
Transparency<br />
13<br />
14<br />
2/6/2012<br />
7
1. Select Indicators + Input Parameters<br />
(Long list) - Example<br />
• Indicator: Road transport CO2 emissions per<br />
passenger km<br />
• Unit of measure: grams CO2 per passenger km<br />
• Input parameters (<strong>for</strong> different types of<br />
passenger vehicles)<br />
– Average vehicle km travelled (Ave VKT)<br />
– Vehicle population<br />
– Average occupancy<br />
• Vehicle population long list<br />
– Vehicle registration<br />
– Vehicle sales<br />
– Vehicle production<br />
– In use vehicles<br />
2. <strong>Data</strong> Mapp<strong>in</strong>g <strong>for</strong> Input Parameters:<br />
Transport data availability<br />
15<br />
• Most available data is vehicle<br />
registration, production and<br />
sales – but level of<br />
aggregation is high, typically,<br />
only disaggregated by<br />
vehicle- vehicle fuel type.<br />
• Limited <strong>in</strong><strong>for</strong>mation on<br />
vehicle technology uptake<br />
• In-use vehicle population data<br />
is not available. Estimates are<br />
<strong>for</strong> purchase<br />
• Limited activity data<br />
• Local emission factors rarely<br />
available, except <strong>for</strong> Ch<strong>in</strong>a<br />
and India<br />
2/6/2012<br />
8
<strong>Data</strong> quality checks<br />
2. <strong>Data</strong> Mapp<strong>in</strong>g <strong>for</strong> Input Parameters:<br />
Energy data availability<br />
• Limited data available <strong>for</strong><br />
– pollution abatement technologies <strong>for</strong><br />
power plants<br />
– population with access to electricity<br />
– non-fossil fuel/renewable energy<br />
sources<br />
– electricity consumption data <strong>for</strong><br />
transport, own-use, and losses<br />
– heat rate data<br />
• Aggregated data <strong>for</strong> fossil fuels,<br />
lumped under “thermal” energy<br />
– e.g. Ch<strong>in</strong>a, Pakistan, and India<br />
• Lack of local values <strong>for</strong> data<br />
needed to calculate emission<br />
factors<br />
– i.e. combustion efficiency, heat<strong>in</strong>g<br />
value, combustion factors, calorific<br />
values, etc.<br />
2. <strong>Data</strong> Mapp<strong>in</strong>g <strong>for</strong> Energy Input Parameters:<br />
example vehicle registration data <strong>in</strong> Sri Lanka<br />
Potential errors and uncerta<strong>in</strong>ties<br />
CAI-Asia, 2010<br />
Dept of<br />
Census &<br />
Statistics<br />
Veh class, Fuel used<br />
Central Bank of SL<br />
Vehicle class<br />
Divisional Secretariat: <strong>Data</strong> Generator<br />
For annual revenue license: Vehicle class, Fuel used, Vehicle weight, others<br />
Dept of Motor Traffic: <strong>Data</strong> Generator<br />
Easily<br />
accessible to<br />
data users<br />
New Registrations: Vehicle make, Color, Manufacture year, Model, Veh. No., Eng<strong>in</strong>e No., Tire size, Wheel<br />
base, Chassis No., Type of body, Gross veh. weight., Veh category, Ownership, Usage, Import license,<br />
Overall measurement, Purpose of use, Registration status, Driv<strong>in</strong>g side, Country of orig<strong>in</strong>, Fuel used, Pay<br />
load, Cyl<strong>in</strong>der capacity, Seat<strong>in</strong>g capacity, Veh type description by manufacturer<br />
<strong>Data</strong> availability<br />
Ease of accessibility<br />
18<br />
2/6/2012<br />
9
2. <strong>Data</strong> Mapp<strong>in</strong>g <strong>for</strong> Input Parameters:<br />
summary data issues<br />
• Limited data availability<br />
• Vary<strong>in</strong>g data quality<br />
• Limited data accessibility<br />
• Lack of coord<strong>in</strong>ation<br />
between agencies<br />
collect<strong>in</strong>g data<br />
• Limited budget<br />
M<strong>in</strong>istry <strong>Data</strong><br />
Motor vehicle registration<br />
Transport Licenses issued<br />
Passenger and freight kilometers<br />
Rail<br />
<br />
<br />
Length of railways<br />
Passenger and freight kilometers<br />
Length of roads<br />
Public Works<br />
<br />
<br />
Surface type and paved roads<br />
Number and length of bridges<br />
Road accidents<br />
Fuel consumption by volume and by<br />
Energy<br />
type of fuel<br />
Fuel pump price<br />
Environment <strong>Emission</strong>s <strong>in</strong>ventories<br />
Economy/ Trade/ Economic growth – , etc.<br />
Customs Volume of trade; Vehicle imports<br />
Economic growth and <strong>in</strong>frastructure<br />
F<strong>in</strong>ance<br />
growth<br />
Transport <strong>in</strong>vestment<br />
Census Population<br />
19<br />
3. Select Indicators and Input Parameter<br />
(Short list) - Indicators<br />
RoadTransport<br />
• CO 2 emissions<br />
• PM emissions<br />
• NOx emissions<br />
– per GDP<br />
– per capita<br />
– per passenger-km<br />
– per freight ton-km<br />
– per vehicle type<br />
– per vehicle-fuel type<br />
• Road transport total fuel<br />
consumption<br />
– per capita<br />
– per GDP<br />
Energy (Electricity)<br />
• CO 2 emissions<br />
• PM 10 emissions<br />
• SO 2 emissions<br />
– by source type (generation)<br />
– per kWh (generation)<br />
– by end-use sector (consumption)<br />
– per GDP (consumption)<br />
– per capita (consumption)<br />
• Total electricity consumption<br />
– per GDP<br />
– per capita<br />
20<br />
2/6/2012<br />
10
3. Select Indicators and Input Parameters<br />
(Short List) Example CO2 emissions<br />
Indicators Input Parameters<br />
T1 Total CO 2 emissions from road<br />
transport<br />
T2 Road transport CO2 emissions per<br />
GDP<br />
T3 Road transport CO2 emissions per<br />
capita<br />
T4 Road transport CO 2 emissions per<br />
passenger km<br />
T5 Road transport CO 2 emissions per<br />
freight ton-km<br />
T6 Road transport CO 2 emissions per<br />
vehicle type<br />
T7 Road transport CO 2 emissions per<br />
vehicle-fuel type<br />
4. Develop Guidel<strong>in</strong>es<br />
• Introduction<br />
• AP/GHG Indicators and <strong>in</strong>put<br />
parameters selection<br />
– 24 transport <strong>in</strong>dicators<br />
– 21 energy <strong>in</strong>dicators<br />
• Guidel<strong>in</strong>es <strong>for</strong> Generation,<br />
<strong>in</strong>terpretation and analysis of<br />
<strong>in</strong>dicators<br />
• Annexes<br />
– Indicator <strong>in</strong>itiatives of <strong>in</strong>ternational<br />
organizations<br />
– Default values <strong>for</strong> transport and<br />
energy <strong>in</strong>put parameters<br />
Average vehicle-kilometers traveled (VKT)<br />
Vehicle population<br />
Fuel efficiency<br />
<strong>Emission</strong> factor<br />
Fuel characteristics<br />
Total CO2 emissions from road transport<br />
Gross Domestic Product (GDP)<br />
Total CO2 emissions from road transport<br />
Total population<br />
Average occupancy<br />
Passenger kilometer travelled<br />
Total CO2 emissions from road transport<br />
Average load<br />
Freight ton-kilometer travelled<br />
Total CO2 emissions from road transport<br />
Average VKT<br />
Vehicle population per vehicle type, vehicle-fuel<br />
type<br />
Fuel efficiency<br />
<strong>Emission</strong> factor<br />
21<br />
22<br />
2/6/2012<br />
11
4. Develop Guidel<strong>in</strong>es<br />
Example Road transport CO2 / passenger km<br />
• Indicator code: T4<br />
• Def<strong>in</strong>ition: CO2 emissions per transport unit (passenger-km) by<br />
road transport (adapted from EEA TERM)<br />
• Unit of measurement: grams CO2 per passenger km<br />
• Policy relevance<br />
– Purpose: reduc<strong>in</strong>g CO2 by <strong>in</strong>creas<strong>in</strong>g occupancy rates and load factors<br />
and by decreas<strong>in</strong>g CO2 per vehicle km<br />
– International conventions and agreements<br />
• Fifth Regional EST Forum – Bangkok 2020 Declaration<br />
• Brunei Action Plan 2011-2015<br />
• ASEAN-Japan Action Plan on Env Improvement <strong>in</strong> the Transport Sector<br />
• Kyoto Protocol<br />
– International targets / recommended : no <strong>in</strong>ternational targets but<br />
some national targets (Japan, Netherlands)<br />
4. Develop Guidel<strong>in</strong>es<br />
Example Road transport CO2 / passenger km<br />
• Methodology<br />
– Measurement method<br />
(1) TKM = Σ[(Ave VKT a * Vehicle Population a ) * Load factor a ]<br />
– Sub- and associated <strong>in</strong>dicators: PM and NOx <strong>in</strong>dicators<br />
– Limitations of the <strong>in</strong>dicators:<br />
• Passenger km rarely available<br />
• Vehicle occupancy statistics <strong>for</strong> different type of vehicles<br />
• Organizations: IEA, ITF, European Environment Agency,<br />
National governments under UNFCCC<br />
• References<br />
(2) T4 = T1 x<br />
TKM<br />
23<br />
24<br />
2/6/2012<br />
12
5. <strong>Data</strong> Collection<br />
• CAI-Asia country networks and contacts<br />
• Calculation tools <strong>for</strong> easy <strong>in</strong>put of data<br />
• <strong>Data</strong> sources<br />
– Requests/Interview with primary data sources<br />
– Desktop reviews<br />
– Purchased data<br />
• Only secondary data, no primary data collection<br />
5. <strong>Data</strong> Collection: Calculation tools<br />
25<br />
26<br />
2/6/2012<br />
13
5. <strong>Data</strong> Collection: Calculation tools<br />
6. Derive Transport Indicators<br />
A<br />
TRIPS<br />
km<br />
S<br />
TRANSPORT<br />
mode<br />
I<br />
FUEL +<br />
ELECTRICITY use<br />
F<br />
Activity Structure Intensity Fuel<br />
EMISSION<br />
FACTORS<br />
CO2<br />
PM<br />
NO2<br />
28<br />
Source: Schipper et al. 1999. Flex<strong>in</strong>g the L<strong>in</strong>k. Reduc<strong>in</strong>g Carbon <strong>Emission</strong>s from Transportation <strong>in</strong> Develop<strong>in</strong>g Countries<br />
27<br />
2/6/2012<br />
14
6. Derive Transport Indicators<br />
CAI-Asia, 2011<br />
<strong>Data</strong> Sources<br />
Surveys: Vehicle <strong>in</strong>ventory and use,<br />
household travel and national travel surveys<br />
Vehicle Registration<br />
Vehicle mortality equation<br />
Vehicle Production, Sales and Imports<br />
Estimated from Average Trip Length and<br />
Average Number of Trips<br />
Orig<strong>in</strong> and Dest<strong>in</strong>ation (O-D) surveys<br />
Number Plate survey<br />
Average Odometer Read<strong>in</strong>gs<br />
Studies deriv<strong>in</strong>g emission factors <strong>for</strong><br />
different vehicle types<br />
Interviews or surveys of fleet operators<br />
Speed Surveys<br />
Speed flow equations<br />
Dynamometer-based drive cycle tests to<br />
simulate typical driv<strong>in</strong>g conditions and<br />
traffic speeds<br />
National bio-fuel mandates and targets<br />
Vehicle Occupancy <strong>Data</strong> Collection Methods<br />
Axle Load survey<br />
7. Review Results<br />
• Documentation of<br />
– Source<br />
– Assumptions<br />
– Methodology<br />
Can be broken down by<br />
vehicle-fuel type<br />
Select how<br />
detailed your<br />
vehicle<br />
population<br />
data is<br />
Vehicle population by vehicle sub-types<br />
Average VKT <strong>for</strong> each of the vehicle sub-types (VKT/year)<br />
Average fuel efficiency <strong>for</strong> each of the vehicle sub-types at 50<br />
kmph (km/liter)<br />
Average speed <strong>for</strong> each of the vehicle types<br />
CO2 emission factors <strong>for</strong> the different fuel types (km/Liter)<br />
% blend of bio-fuels <strong>in</strong> the gasol<strong>in</strong>e and diesel be<strong>in</strong>g used <strong>for</strong><br />
road transportation<br />
NOx emission factors <strong>for</strong> each of the vehicle sub-types (g/km)<br />
PM emission factors <strong>for</strong> each of the vehicle sub-types (g/km)<br />
Average occupancy/load<strong>in</strong>g of the vehicle types<br />
GDP per capita<br />
Population<br />
• Comparison of results with data from<br />
Can be broken down to<br />
vehicle-fuel-emissions<br />
standards<br />
Indicators<br />
Total VKT<br />
Total fuel consumption<br />
Total CO2 <strong>Emission</strong>s<br />
Total NOx <strong>Emission</strong>s<br />
Total PM <strong>Emission</strong>s<br />
Total PKM and TKM<br />
– Other organizations <strong>in</strong>clud<strong>in</strong>g IEA, World Bank, ADB and others<br />
– Country reports and studies<br />
• Consultation with government and local experts<br />
(through personal communication)<br />
29<br />
30<br />
2/6/2012<br />
15
8. Asia AP/GHG Indicators Report:<br />
Philipp<strong>in</strong>es Country Profile<br />
DRAFT<br />
8. Asia AP/GHG Indicators:<br />
Philipp<strong>in</strong>es Transport Indicators<br />
2W, 3W, PC, MUV, LCV, HCV<br />
Million metric tons<br />
7000<br />
6000<br />
5000<br />
4000<br />
3000<br />
2000<br />
1000<br />
Vehicle Population (’000s) Motorization Index (V/1000 P)<br />
0<br />
0<br />
2000 2002 2004 2006 2008 2010<br />
2W 3W PC MUV LCV HCV Bus<br />
Total CO2, PM and NOx emissions from<br />
road transport*<br />
35<br />
160<br />
30<br />
140<br />
25<br />
120<br />
20<br />
15<br />
10<br />
100<br />
80<br />
60<br />
40<br />
5<br />
20<br />
0<br />
0<br />
2000 2002 2004 2006 2008 2010<br />
PM emissions (thousand metric tons)<br />
NOx (thousand metric tons)<br />
CO2 emissions (million metric tons)<br />
*Does not <strong>in</strong>corporate improvements <strong>in</strong> vehicle technologies<br />
40<br />
35<br />
30<br />
25<br />
20<br />
15<br />
10<br />
5<br />
Bus<br />
Thousand metric tons<br />
80<br />
70<br />
60<br />
50<br />
40<br />
30<br />
20<br />
10<br />
0<br />
Million metric tons<br />
35<br />
30<br />
25<br />
20<br />
15<br />
10<br />
5<br />
2W 3W PC<br />
MUV Bus LCV<br />
HCV Total<br />
2000 2002 2004 2006 2008 2010<br />
CO 2 emissions per vehicle type<br />
0<br />
2000 2002 2004 2006 2008 2010<br />
2W 3W PC MUV BUS LCV HCV<br />
32 DRAFT<br />
31<br />
2/6/2012<br />
16
Million metric tons<br />
8. Asia AP/GHG Indicators Report:<br />
Philipp<strong>in</strong>es Energy Indicators<br />
TWh<br />
Total generation and consumption Electricity generation by<br />
source type (2010)<br />
80<br />
70<br />
60<br />
50<br />
40<br />
30<br />
20<br />
10<br />
GENERATION<br />
CONSUMPTION<br />
0<br />
2000 2002 2004 2006 2008 2010<br />
Total CO2, PM and SO2 emissions from<br />
1200<br />
electricity generation<br />
20000<br />
1000<br />
800<br />
600<br />
400<br />
200<br />
0<br />
0<br />
2000 2002 2004 2006 2008 2010<br />
PM emissions (thousand metric tons)<br />
SO2 emissions (thousand metric tons)<br />
CO2 emissions (million metric tons)<br />
15000<br />
10000<br />
5000<br />
8. Asia AP/GHG Indicators Report:<br />
Metro Manila City Profile<br />
DRAFT<br />
Thousand metric tons<br />
Million metric tons<br />
50<br />
40<br />
30<br />
20<br />
10<br />
Electricity consumption by<br />
end-use sector (2010)<br />
CO 2 emissions per end-use sector<br />
0<br />
2000 2002 2004 2006 2008 2010<br />
Residential sector Commercial sector Transport sector<br />
Other sectors Own-use and losses<br />
PM 10 , µ g / m 3<br />
33 DRAFT<br />
GDP AND POPULATION IN METRO MANILA<br />
GDP (Thousand PHP at<br />
constant 1985 prices) million<br />
80<br />
70<br />
60<br />
50<br />
40<br />
30<br />
20<br />
10<br />
0<br />
500<br />
450<br />
400<br />
350<br />
300<br />
250<br />
200<br />
150<br />
100<br />
50<br />
0<br />
2000 2002 2004 2006 2008<br />
Total Population (million)<br />
GDP (Thousand PHP at constant 1985 prices) (million)<br />
ANNUAL AVERAGE PM 10 AND PM 2.5<br />
LEVELS IN METRO MANILA<br />
PHI PM 10 Annual NAAQS<br />
WHO PM 10 Annual AQG<br />
WHO PM 2.5 Annual AQG<br />
2002 2003 2004 2005 2006 2007 2008 2009 2010<br />
12<br />
12<br />
11<br />
11<br />
10<br />
10<br />
9<br />
PM10<br />
PM2.5<br />
Total Population (million)<br />
34<br />
2/6/2012<br />
17
8. Asia AP/GHG Indicators Report:<br />
Metro Manila Transport Indicators<br />
2000<br />
1800<br />
1600<br />
1400<br />
1200<br />
1000<br />
Million metric tons<br />
800<br />
600<br />
400<br />
200<br />
9<br />
8<br />
8<br />
7<br />
7<br />
0<br />
Vehicle Population (’000s) Motorization Index (V/1000 P)<br />
2W 3W PC MUV<br />
Bus LCV HCV<br />
2000 2002 2004 2006 2008 2010<br />
Total CO 2, PM and NO x emissions from<br />
road transport*<br />
6<br />
2000 2002 2004 2006 2008 2010<br />
PM emissions (thousand metric tons)<br />
NOx (thousand metric tons)<br />
CO2 emissions (million metric tons)<br />
*Does not <strong>in</strong>corporate improvements <strong>in</strong> vehicle technologies<br />
30<br />
25<br />
20<br />
15<br />
10<br />
5<br />
0<br />
Thousand metric tons<br />
180<br />
160<br />
140<br />
120<br />
100<br />
80<br />
60<br />
40<br />
20<br />
0<br />
8. Asia AP/GHG Indicators Report:<br />
Country Comparisons <strong>for</strong> Transport<br />
160<br />
140<br />
120<br />
100<br />
80<br />
60<br />
40<br />
20<br />
0<br />
2000<br />
2004<br />
2008<br />
2000<br />
2004<br />
2008<br />
2000<br />
2004<br />
2008<br />
2000<br />
2004<br />
2008<br />
2000<br />
2004<br />
2008<br />
2000<br />
2004<br />
2008<br />
2000<br />
2004<br />
2008<br />
400<br />
350<br />
300<br />
250<br />
200<br />
150<br />
100<br />
50<br />
0<br />
PRC IND INO NEP PHI SRI VIE<br />
Total Vehicles (millions) (Left Axis) Motorization Index (V/1000 P) (Right Axis)<br />
Million metric tons<br />
9<br />
8<br />
7<br />
6<br />
5<br />
4<br />
3<br />
2<br />
1<br />
2000 2002 2004 2006 2008 2010<br />
2W 3W PC MUV Bus LCV HCV Total<br />
CO 2 emissions per vehicle type<br />
0<br />
2000 2002 2004 2006 2008 2010<br />
2W 3W PC MUV BUS LCV HCV<br />
35<br />
DRAFT<br />
Total Vehicle Population and Motorization Index Motor Vehicles by Mode <strong>for</strong> 7 Asian<br />
Countries<br />
Road Transport Sector CO 2 <strong>Emission</strong>s Road Transport Sector PM <strong>Emission</strong>s*<br />
The image cannot be displayed. Your computer may not have enough memory to open the image, or the image may have been corrupted.<br />
Restart your computer, and then open the file aga<strong>in</strong>. If the red x still appears, you may have to delete the image and then <strong>in</strong>sert it aga<strong>in</strong>.<br />
Millions<br />
300<br />
250<br />
200<br />
150<br />
100<br />
Thousand metric tons<br />
50<br />
0<br />
400<br />
350<br />
300<br />
250<br />
200<br />
150<br />
100<br />
2005<br />
2007<br />
2009<br />
2006<br />
2008<br />
2005<br />
2007<br />
2009<br />
2006<br />
2008<br />
2005<br />
2007<br />
2009<br />
2006<br />
2008<br />
2005<br />
2007<br />
2009<br />
50<br />
2W 3W PC MUV Bus LCV HCV<br />
PR Ch<strong>in</strong>a<br />
India<br />
Indonesia<br />
Nepal<br />
Philipp<strong>in</strong>es<br />
Sri Lanka<br />
Vietnam<br />
DRAFT<br />
0<br />
2005 2006 2007 2008 2009<br />
36<br />
*Does not <strong>in</strong>corporate improvements <strong>in</strong> vehicle technologies<br />
2/6/2012<br />
18
Million metric tons<br />
Thousand metric tons<br />
8. Asia AP/GHG Indicators Report:<br />
Country Comparisons <strong>for</strong> Energy<br />
CO 2 emissions from electricity generation Electricity consumption per capita<br />
5,000<br />
4,000<br />
3,000<br />
2,000<br />
1,000<br />
-<br />
2000 2002 2004 2006 2008 2010<br />
Ch<strong>in</strong>a India Indonesia Nepal<br />
Pakistan Philipp<strong>in</strong>es Sri Lanka Vietnam<br />
SO 2 emissions from electricity generation Electricity consumption per country (2010)<br />
The image cannot be displayed. Your computer may not have enough memory to open the image, or the image may have been corrupted.<br />
Restart your computer, and then open the file aga<strong>in</strong>. If the red x still appears, you may have to delete the image and then <strong>in</strong>sert it aga<strong>in</strong>.<br />
9. <strong>Open</strong> <strong>Data</strong>: CitiesACT – www.citiesACT.org<br />
TWh<br />
kWh/capita<br />
37 DRAFT<br />
CitiesACT database on air quality levels, CO 2 emissions, transport and energy data and <strong>in</strong>dicators <strong>for</strong> 250<br />
Asian cities and 22 countries. Users can search by location, topic, and create onl<strong>in</strong>e charts and figures<br />
Countries & Cities<br />
•Population (total,<br />
percent urban,<br />
electricity access)<br />
•GDP<br />
•Number and list of<br />
mega-cities<br />
<strong>Air</strong> Quality<br />
& Climate Change<br />
• <strong>Air</strong> quality standards<br />
• <strong>Air</strong> quality data<br />
(PM10, SO2, NOx)<br />
• Monitor<strong>in</strong>g stations<br />
• <strong>Air</strong> pollution and CO2<br />
<strong>in</strong>dicators<br />
Ma<strong>in</strong> data source <strong>for</strong> WHO Outdoor<br />
<strong>Air</strong> Pollution <strong>in</strong> Cities database<br />
(www.who.<strong>in</strong>t/phe/health_topics/out<br />
doorair/databases/en/)<br />
Energy<br />
Transport<br />
• <strong>Emission</strong>s from electricity • <strong>Emission</strong>s standards<br />
generation by source type, kWh • Fuel quality standards<br />
• <strong>Emission</strong>s from electricity • Fuel economy<br />
consumption by end-use standards<br />
sector, GDP, capita<br />
• Road transport<br />
• Energy statistics<br />
emissions total and per<br />
capita, GDP, passenger<br />
km and freight, vehicle<br />
type, vehicle-fuel type<br />
• Motorization <strong>in</strong>dex<br />
• Transport statistics<br />
38<br />
38<br />
2/6/2012<br />
19
39<br />
40<br />
2/6/2012<br />
20
9. <strong>Open</strong> <strong>Data</strong>: CitiesACT – www.citiesACT.org<br />
• <strong>Data</strong> and graphs can be downloaded<br />
41<br />
42<br />
2/6/2012<br />
21
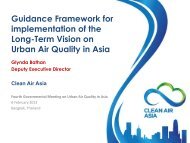
10. Dissem<strong>in</strong>ation and Communication<br />
• Launch at BAQ 2012 (Dec 2012)<br />
• Dissem<strong>in</strong>ation at other events<br />
and through partners<br />
How the project fits <strong>in</strong> Knowledge<br />
Partnership and Susta<strong>in</strong>ability<br />
2/6/2012<br />
44<br />
44<br />
2/6/2012<br />
22
Leverag<strong>in</strong>g both ways<br />
TRL: Comp<br />
Review<br />
Transport + CC<br />
ADB Transport<br />
<strong>Data</strong> <strong>in</strong> Asia<br />
Study<br />
TEEMP (ADB,<br />
ITDP, Veolia,<br />
World Bank)<br />
GIZ Country<br />
Profiles<br />
ITPS <strong>Low</strong> Carbon<br />
Transport ASEAN<br />
<strong>Low</strong> <strong>Emission</strong>s<br />
Cities Project<br />
1. Select Indicators + Input Parameters (Long list)<br />
2. <strong>Data</strong> Mapp<strong>in</strong>g <strong>for</strong> Energy and Transport Input Parameters<br />
3. Select Indicators + Input Parameters (short list)<br />
4. Develop Guidel<strong>in</strong>es <strong>for</strong> development,<br />
measurement and use of GHG and AP Indicators<br />
5. <strong>Data</strong> collection of transport and energy <strong>in</strong>put<br />
parameters (<strong>in</strong>put data)<br />
Collection of<br />
available data<br />
Estimation <strong>for</strong><br />
unknown data<br />
6. Derive <strong>in</strong>dicators + 7. Review results<br />
8. Upload of data and Indicators <strong>in</strong> CitiesACT<br />
9. Benchmark<strong>in</strong>g Report<br />
10. Dissem<strong>in</strong>ation and Communication<br />
Launch at BAQ 2012<br />
IGES MRV<br />
Adoption of Indicators by Asian governments<br />
• Environmentally Susta<strong>in</strong>able Transport<br />
(EST) Forum of 22 Asian countries<br />
organized each year by UNCRD<br />
• Bangkok 2020 Declaration - Asian<br />
governments agree on 20 EST goals <strong>for</strong><br />
2010-2020<br />
• Includes per<strong>for</strong>mance <strong>in</strong>dicators <strong>for</strong> each<br />
goal<br />
• CAI-Asia prepared Background Paper on<br />
data and <strong>in</strong>dicators <strong>for</strong> Susta<strong>in</strong>able<br />
Transport under the Bangkok 2020<br />
Declaration<br />
• http://www.uncrd.or.jp/env/est/<br />
UNCRD EST<br />
<strong>Data</strong> and<br />
Indicators<br />
EF Green<br />
Freight Ch<strong>in</strong>a<br />
Program<br />
ADB <strong>Data</strong><br />
<strong>Initiative</strong><br />
Shell PHI<br />
45<br />
46<br />
2/6/2012<br />
23
<strong>Data</strong> Need <strong>for</strong> National Green Freight<br />
programs and <strong>in</strong>itiatives<br />
World<br />
• US SmartWay<br />
• European<br />
SmartWay<br />
• Canada FleetSmart<br />
• Mexio Transporte<br />
Limpio<br />
• Australia<br />
• Other…<br />
Asia<br />
Green Freight at<br />
EST Forum<br />
Carbon neutral<br />
freight corridor <strong>in</strong><br />
GMS region<br />
Green Freight <strong>in</strong><br />
India<br />
Green Freight<br />
Asia Network<br />
(private sector )<br />
Other…<br />
<strong>Low</strong> <strong>Emission</strong>s Cities Project<br />
• <strong>Development</strong> and application<br />
of the rapid assessment <strong>for</strong><br />
city emissions (RACE) tool :<br />
– Energy use <strong>in</strong> <strong>in</strong>dustrial,<br />
commercial, residential<br />
build<strong>in</strong>gs and transport<br />
– Land use and transport<br />
<strong>in</strong>tegration<br />
Green<br />
Logistics<br />
Wuhan<br />
Ch<strong>in</strong>a<br />
Study Tours<br />
to US and<br />
Europe<br />
Guangdong GEF<br />
Green Trucks<br />
Project<br />
Other…<br />
Ch<strong>in</strong>a<br />
Institutions<br />
and Policy<br />
Study<br />
Guangdong<br />
International<br />
Green Freight<br />
Fair<br />
Guangzhou Green<br />
Trucks Pilot<br />
Project<br />
Second Green<br />
Freight Sem<strong>in</strong>ar<br />
Green Freight<br />
Ch<strong>in</strong>a Program<br />
Phase 2<br />
First Green<br />
Freight<br />
Sem<strong>in</strong>ar<br />
Green Freight<br />
Ch<strong>in</strong>a Program<br />
Phase 1<br />
World Bank TTL: Ke Fang<br />
(kfang@worldbank.org)<br />
47<br />
48<br />
2/6/2012<br />
24
<strong>Low</strong> <strong>Emission</strong>s Cities Project:<br />
HCMC Scenarios<br />
Basel<strong>in</strong>e 2010<br />
<strong>Low</strong> <strong>Emission</strong>s Cities Project:<br />
HCMC Scenarios Results<br />
BAU 2030<br />
Alternative <strong>Development</strong> 2030<br />
• 2030 reductions potential under alternative scenario<br />
– Transport<br />
– 27% CO2 emissions<br />
– 44% PM emissions<br />
– 54% NOx emissions<br />
• Indirect emissions reductions from grid electricity use<br />
– 12% CO2 emissions<br />
– 16% PM emissions<br />
– 11% NOx emissions<br />
– 13% CO emissions<br />
– 10% SOx emissions<br />
Basel<strong>in</strong>e2010 BAU2030 Alternative2030<br />
Total CO2 (tons) 4,385,100.13 9,788,747.01 7,156,105.82<br />
Total PM (tons) 11,645.49 10,989.27 6,148.52<br />
Total NOx (tons) 23,210.10 48,219.43 22,019.73<br />
49<br />
50<br />
2/6/2012<br />
25
Potential l<strong>in</strong>kages with<br />
WB Climate Change Knowledge Portal<br />
• <strong>Data</strong> shar<strong>in</strong>g on transport<br />
and energy AP and GHG<br />
emissions <strong>for</strong> Asia<br />
• As a recognized partner on<br />
knowledge management<br />
Proposed Next Steps<br />
• Launch Asia AP/GHG Indicators Report at BAQ 2012<br />
together with World Bank<br />
• Pre-event / session at BAQ 2012 on data<br />
• Translation of guidel<strong>in</strong>es, report, CitiesACT <strong>in</strong>to other<br />
Asian languages<br />
• Updat<strong>in</strong>g of data / <strong>in</strong>dicators<br />
• Issuance of Indicators Report every 2 years at BAQ<br />
• Embed data use and collection methods <strong>in</strong>to<br />
agreements, programs, policies/plans, development<br />
assistance<br />
51<br />
52<br />
2/6/2012<br />
26
For more <strong>in</strong><strong>for</strong>mation<br />
CAI-Asia Ch<strong>in</strong>a Office<br />
cpo@cai-asia.org<br />
901A Reignwood Build<strong>in</strong>g,<br />
No. 8 YongAnDongLi<br />
Jianguomenwai Avenue Beij<strong>in</strong>g<br />
Ch<strong>in</strong>a<br />
CAI-Asia Center<br />
center@cai-asia.org<br />
Unit 3505 Rob<strong>in</strong>sons-Equitable Tower<br />
ADB Avenue, Pasig City<br />
Metro Manila 1605<br />
Philipp<strong>in</strong>es<br />
CAI-Asia Country Networks<br />
Ch<strong>in</strong>a . India . Indonesia . Nepal . Pakistan . Philipp<strong>in</strong>es . Sri Lanka . Vietnam<br />
CAI-Asia Center Members 231 CAI-Asia Partnership Members<br />
www.cleanair<strong>in</strong>itiative.org<br />
CAI-Asia India Office<br />
<strong>in</strong>dia@cai-asia.org<br />
Regus Elegance<br />
Elegance Tower, Mathura Road,<br />
Jasola Vihar, New Delhi<br />
India<br />
• 45 Cities<br />
Donors <strong>in</strong> 2011<br />
Asian <strong>Development</strong> Bank ClimateWorks Foundation Energy Foundation<br />
Fredskorpset Norway Fu Tak Iam Foundation German International<br />
• 19 Environment m<strong>in</strong>istries<br />
Cooperation (GIZ) Guangdong Government Institute <strong>for</strong> Global<br />
• 13 Other Government agencies<br />
Environmental Strategies (IGES) Institute <strong>for</strong> Transport Policy Studies <br />
• 17 <strong>Development</strong> agencies and foundationsInstitute<br />
<strong>for</strong> Transportation and <strong>Development</strong> Policy International Union <strong>for</strong><br />
Conservation of Nature Korea Transport Institute MAHA Philipp<strong>in</strong>e<br />
• 66 NGOs<br />
Bus<strong>in</strong>ess <strong>for</strong> the Environment United Nations Centre <strong>for</strong> Regional<br />
• 37 Academic and research <strong>in</strong>stitutes<br />
<strong>Development</strong> (UNCRD) United Nations Environment Program Partnership<br />
• 32 Private sector companies<br />
53<br />
<strong>for</strong> <strong>Clean</strong> Fuels and Vehicles (UNEP PCFV) Veolia World Bank<br />
2/6/2012<br />
27