

carbon dioxide capture and storage carbon dioxide capture and ...
carbon dioxide capture and storage carbon dioxide capture and ...
carbon dioxide capture and storage carbon dioxide capture and ...

You also want an ePaper? Increase the reach of your titles
YUMPU automatically turns print PDFs into web optimized ePapers that Google loves.
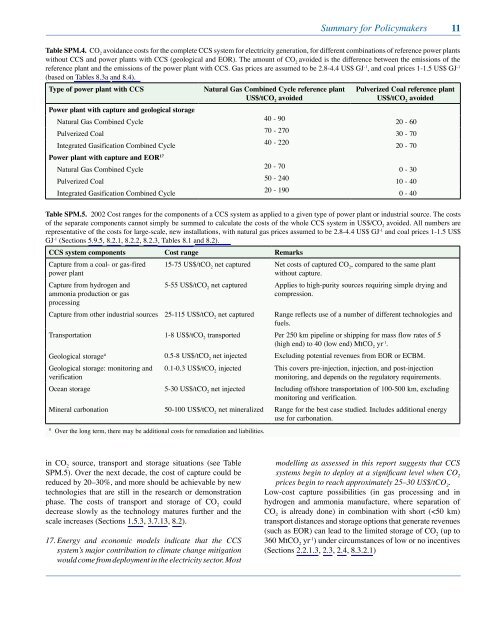
in CO 2 source, transport <strong>and</strong> <strong>storage</strong> situations (see Table<br />
SPM.5). Over the next decade, the cost of <strong>capture</strong> could be<br />
reduced by 20–30%, <strong>and</strong> more should be achievable by new<br />
technologies that are still in the research or demonstration<br />
phase. The costs of transport <strong>and</strong> <strong>storage</strong> of CO 2 could<br />
decrease slowly as the technology matures further <strong>and</strong> the<br />
scale increases (Sections 1.5.3, 3.7.13, 8.2).<br />
17. Energy <strong>and</strong> economic models indicate that the CCS<br />
system’s major contribution to climate change mitigation<br />
would come from deployment in the electricity sector. Most<br />
Summary for Policymakers<br />
Table SPM.4. CO 2 avoidance costs for the complete CCS system for electricity generation, for different combinations of reference power plants<br />
without CCS <strong>and</strong> power plants with CCS (geological <strong>and</strong> EOR). The amount of CO 2 avoided is the difference between the emissions of the<br />
reference plant <strong>and</strong> the emissions of the power plant with CCS. Gas prices are assumed to be 2.8-4.4 US$ GJ -1 , <strong>and</strong> coal prices 1-1.5 US$ GJ -1<br />
(based on Tables 8.3a <strong>and</strong> 8.4).<br />
Type of power plant with CCS<br />
Power plant with <strong>capture</strong> <strong>and</strong> geological <strong>storage</strong><br />
Natural Gas Combined Cycle reference plant<br />
US$/tCO avoided<br />
Natural Gas Combined Cycle<br />
40 - 90<br />
Pulverized Coal<br />
70 - 270<br />
Integrated Gasification Combined Cycle<br />
Power plant with <strong>capture</strong> <strong>and</strong> EOR<br />
40 - 220<br />
17<br />
Natural Gas Combined Cycle<br />
20 - 70<br />
Pulverized Coal<br />
50 - 240<br />
Integrated Gasification Combined Cycle<br />
20 - 190<br />
Pulverized Coal reference plant<br />
US$/tCO avoided<br />
20 - 60<br />
30 - 70<br />
20 - 70<br />
0 - 30<br />
10 - 40<br />
0 - 40<br />
Table SPM. . 2002 Cost ranges for the components of a CCS system as applied to a given type of power plant or industrial source. The costs<br />
of the separate components cannot simply be summed to calculate the costs of the whole CCS system in US$/CO2 avoided. All numbers are<br />
representative of the costs for large-scale, new installations, with natural gas prices assumed to be 2.8-4.4 US$ GJ-1 <strong>and</strong> coal prices 1-1.5 US$<br />
GJ-1 (Sections 5.9.5, 8.2.1, 8.2.2, 8.2.3, Tables 8.1 <strong>and</strong> 8.2).<br />
CCS system components Cost range Remarks<br />
Capture from a coal- or gas-fired<br />
power plant<br />
Capture from hydrogen <strong>and</strong><br />
ammonia production or gas<br />
processing<br />
15-75 US$/tCO2 net <strong>capture</strong>d Net costs of <strong>capture</strong>d CO2 , compared to the same plant<br />
without <strong>capture</strong>.<br />
5-55 US$/tCO2 net <strong>capture</strong>d Applies to high-purity sources requiring simple drying <strong>and</strong><br />
compression.<br />
Capture from other industrial sources 25-115 US$/tCO2 net <strong>capture</strong>d Range reflects use of a number of different technologies <strong>and</strong><br />
fuels.<br />
Transportation 1-8 US$/tCO2 transported Per 250 km pipeline or shipping for mass flow rates of 5<br />
(high end) to 40 (low end) MtCO2 yr-1 .<br />
Geological <strong>storage</strong>a 0.5-8 US$/tCO2 net injected Excluding potential revenues from EOR or ECBM.<br />
Geological <strong>storage</strong>: monitoring <strong>and</strong><br />
verification<br />
0.1-0.3 US$/tCO 2 injected This covers pre-injection, injection, <strong>and</strong> post-injection<br />
monitoring, <strong>and</strong> depends on the regulatory requirements.<br />
Ocean <strong>storage</strong> 5-30 US$/tCO2 net injected Including offshore transportation of 100-500 km, excluding<br />
monitoring <strong>and</strong> verification.<br />
Mineral <strong>carbon</strong>ation 50-100 US$/tCO2 net mineralized Range for the best case studied. Includes additional energy<br />
use for <strong>carbon</strong>ation.<br />
a<br />
Over the long term, there may be additional costs for remediation <strong>and</strong> liabilities.<br />
11<br />
modelling as assessed in this report suggests that CCS<br />
systems begin to deploy at a significant level when CO 2<br />
prices begin to reach approximately 25–30 US$/tCO 2 .<br />
Low-cost <strong>capture</strong> possibilities (in gas processing <strong>and</strong> in<br />
hydrogen <strong>and</strong> ammonia manufacture, where separation of<br />
CO 2 is already done) in combination with short (


